
1. INTRODUCTION
Rice, with a yield of 7.2 million metric tons and productivity of 3809 kg/ha [1], is considered the main kharif crop in Tamil Nadu and covers an area of 1.92 million hectares. The most important cereal crop, rice, accounts for almost 45% of the world’s production of food grains. Weed invasion and disturbance in rice fields are important problems that significantly reduce yield. Transplanted weed populations in rice include mixed populations of broad leaf weeds, sedges, and grasses, which cause 28–45% more damage than insects, diseases, and pests combined [2]. Rice weed infestation has been reported to reduce grain production by 27–80% [3]. Weeds affect native biodiversity, the aesthetics of the ecosystem, the cost of cultivation, the efficiency of inputs, interference with agricultural processes, and quality. Weeds serve as alternative hosts for many disease-causing insects and pests [4].
The system of rice intensification (SRI) is gaining popularity as a low-cost alternative to conventional rice cultivation [5]. SRI is more efficient, greener, and more sustainable than conventional rice cultivation [6]. Severe weed growth is a critical limitation of the SRI method due to increased field spacing. The SRI technique of agriculture requires weeding, either by hand or with the help of a machine like a cono weeder. However, the effectiveness of hand weeding depends on variables such as weed species, weed density, time, and frequency of weeding. In addition, hand weeding is labor-intensive and can be expensive, which may limit its practicality for some farmers [7]. The cono weeder has rolling spiked wheels to roll over the soil surface; in the case of hardpan soil conditions, there might be chances for the cono weeder to roll over it without uprooting the weeds from the soil [8]. In SRI, weed populations can be effectively controlled through the use of herbicides. Different weed management techniques, including the use of herbicides and cultural and manual methods, have been developed and implemented in rice production systems. Among them, chemical herbicide methods can economically and reliably control emerging weeds if applied at the appropriate dosage and time [9]. In light of this, the current experiment was carried out to investigate the effectiveness of different pre-emergence herbicides against the weed flora and the potential of rice production when grown using the SRI approach.
2. MATERIALS AND METHODS
2.1. Experimental Site
The field experiment was carried out in the wetland block field No. Q7 of the Faculty of Agriculture, Department of Agronomy, Annamalai University, Chidambaram, Tamil Nadu, India [Figure 1], to determine the effects of pre-emergence herbicides on weed dynamics and rice production potential in rice intensification systems. The Experimental Farm is geographically located at an altitude of +5.79 m above mean sea level, at 11° 24 North Latitude and 79° 44 East Longitude. The study area is a tropical, humid environment with an average rainfall of 282.5 mm throughout the growing season. During the farming season, the maximum temperature is 34.8°C and the minimum temperature is 25.5°C. The total amount of evaporation is 54.2 mm, and the relative humidity is 85.2%. The soil has a clay loam texture, pH 7.2, organic matter (0.78%), and contains nitrogen (245.7 kg/ha), phosphorous (23.2 kg/ha), and potassium (290.6 kg/ha).
 | Figure 1: Geographical location of experimental site in Chidambaram, Cuddalore Dt, Tamil Nadu, India. [Click here to view] |
2.2. Methodology
Eight treatments were used in the experiment, including T1- Control (unweeded), T2- Hand weeding twice at 20 and 40 Days after transplanting, T3- Cono weeding twice at 20 and 40 Days after transplanting, T4- Butachlor 50 EC (1.25 kg ai/ha), T5- Thiobencarb 50 EC (1.8 kg ai/ha), T6- Pretilachlor 50 EC (0.5 kg ai/ha), T7- Oxadiazon 25 EC (0.75 kg ai/ha), and T8- Pyrazosulfuron ethyl 10% WP (0.0015 kg ai/ha). A randomised block design (RBD) with three replications was used for all treatments. The ADT-43 short-term (110 days) rice variety was used in the study. The single seedling in each hill was transplanted at the age of 14 days, and the row spacing was 25 × 25 cm. Seedlings were transplanted in the middle of July, and the area of the plot was 5 × 4 m2. Hand weeding and weeding with a cono weeder were done twice at 20 and 40 DAT. The pre-emergence herbicides were sprayed with a knapsack sprayer at 3–5 DAT. Urea, Single superphosphate, and Muriate of potash were used to apply the fertilizer at the recommended rate (150:50:50 NPK kg/ha) according to the Crop Production Guidelines [10]. Irrigation was given up to 3–5 cm depth throughout the cropping period up to 10 days prior to harvest. Visual observation was used to assess the phytotoxicity of herbicides on rice crops (leaf speckling, leaf margin necrosis, yellowing of leaves, leaf twisting, growth retardation, etc.). Toxicity levels for rice crops were determined according to the following scale adopted by IRRI [11], as shown in Table 1. Following the application of herbicides, the toxicity of 10 samples from each plot was rated in a week (6th and 10th).
Table 1: Phytotoxicity assess visually on a scale of 1–10, as shown below.
| Class | Category | Damage symptoms |
|---|---|---|
| 0 | No toxicity | No damage/healthy plant |
| 1 2 3 | Slightly toxicity | Slight crop discoloration or stunting, crop damage is noticeable, but not lasting |
| 4 5 6 | Moderate toxicity | Moderate damage, crop usually regenerate, damage last longer/cannot be restored |
| 7 8 9 | Severe toxicity | The crop is severely damage and the stands were lost |
| 10 | Toxic (plant kill) | Complete crop destruction |
2.3. Data Collection
2.3.1. Weed data
Observations of weed density and dry weight were calculated from the sample strips of each plot at 30 and 60 DAT using quadrats (0.5 m × 0.5 m). At 600C, the weed samples were dried in the oven.
2.3.2. Weed Control Efficiency (WCE)
The effectiveness of weed control is calculated by comparing the weed population in the treated plot to the weed population in the unweeded plot. The following formula is used to calculate WCE: [12].
 |
Where WPC = Weed species population in the control plot
WPT = Weed species population in the treated plot
2.3.3. Weed control index (WCI)
The reduction in weed dry weight in the treated plot above the reduction in weed dry weight in the unweeded check is taken into account when calculating the WCI. The formula provided below was used to calculate the WCI [13].
 |
where WC = Weed species dry weight in the control plot
WT = Weed dry weight in the treated plot
2.3.4. Grain yield
The field’s net plot area was used to harvest the mature crop, and the grains were then cleaned and dried to a moisture level of 14%. Yields were calculated in kg/ha and recorded.
2.3.5. Straw yield
Straw was sun- dried after threshing and calculated to kg/ha.
2.4. Statistical Analysis
Before statistical analysis, the data on the individual weed count and total weed count, as well as WCI, were submitted to a square root transformation (√x+0.5) to normalize their distribution [14]. The crucial difference (CD) at the 5% level of significance was used to determine the statistical significance of the treatment effects on several parameters.
3. RESULTS AND DISCUSSION
3.1. Effect on Weed Flora
Table 2 shows the weed flora in the experimental field. Weed species from four different taxonomic groups, including three species of grasses, two species of sedges, and two species of broad-leaved weeds, were observed during the crop growth phase. The most common weeds were Echinochloa colonum, Echinochloa crus-galli, and Leptochloa chinensis among grasses; sedges were Cyperus rotundus, Cyperus difformis, Sphenoclea zeylanica, and Eclipta alba among broad-leaved weeds.
Table 2: The experimental field-weed flora.
| S. No | Botanical name | Common name | Life form | Family |
|---|---|---|---|---|
| I | Grasses | |||
| 1 | Echinochloa colonum | Deccan grass | Annual | Poaceae |
| 2 | Echinochloa crus-galli | Japanese millet | Annual | Poaceae |
| 3 | Leptochloa chinensis | Red sprangle grass | Annual | Poaceae |
| II | Sedges | |||
| 1 | Cyperus rotundus | Purple nutsedge | Perennial | Cyperaceae |
| 2 | Cyperus difformis | Souchet difforme | Annual | Cyperaceae |
| III | Broad Leaved Weeds | |||
| 1 | Sphenoclea zeylanica | Goose weed | Annual | Campanulaceae |
| 2 | Eclipta alba | Bhringraj/false daisy | Annual | Asteraceae |
3.2. Effect of Treatments on Weed Density
3.2.1. Individual weed population at 30 DAT
The data on individual weed populations recorded at 30 DAT are shown in Table 3. Among the treatments, cono weeding (T3) recorded the lowest individual weed population (m-2) of 1.7, 2.53, and 2.22 weeds of E. colonum, C. rotundus, and C. difformis. Among the herbicide treatments, application of pre-emergence herbicide pretilachlor (0.5 kg ai/ha) (T6) recorded the lowest individual weed population (m-2) of 1.95, 1.76, 1.61, 2.81, 2.57, 1.79, and 1.38 weeds of E. colonum, E. crus-galli, L. chinensis, C. rotundus, C. difformis, S. zeylanica, and E. alba, respectively, on 30 DAT. The unweeded control recorded the highest individual weed count on DAT 30.
Table 3: Effects of weed management practices on the number of weed count (m2) in rice grown under SRI at 30 DAT.
| Treatments | Grasses | Sedges | BLW | ||||
|---|---|---|---|---|---|---|---|
| E. colonum | E. crus-galli | Leptochloa chinensis | C. rotundus | C. difformis | Sphenoclea zeylanica | Eclipta alba | |
| T1 | 4.47 (19.5) | 4.21 (17.23) | 3.16 (9.51) | 7.66 (58.2) | 6.23 (38.3) | 3.91 (14.8) | 2.94 (8.12) |
| T2 | 1.76 (2.6) | 1.73 (2.5) | - | 2.66 (6.6) | 2.30 (4.8) | - | - |
| T3 | 1.75 (2.58) | - | - | 2.53 (5.92) | 2.22 (4.41) | - | - |
| T4 | 1.97 (3.4) | 1.92 (3.2) | 1.61 (2.1) | 3.27 (10.2) | 2.59 (6.21) | 1.95 (3.3) | 1.61 (2.1) |
| T5 | 2.42 (5.35) | 2.17 (4.2) | 1.64 (2.2) | 3.61 (12.54) | 3.04 (8.75) | 2.39 (5.2) | 1.79 (2.7) |
| T6 | 1.95 (3.3) | 1.76 (2.6) | 1.61 (2.1) | 2.81 (7.4) | 2.57 (6.1) | 1.79 (2.7) | 1.38 (1.4) |
| T7 | 2.39 (5.2) | 2.41 (5.3) | 1.97 (3.4) | 3.17 (9.55) | 2.77 (7.2) | 1.97 (3.4) | 1.64 (2.2) |
| T8 | 1.97 (3.4) | 1.89 (3.1) | 1.70 (2.4) | 3.10 (9.17) | 2.60 (6.24) | 1.89 (3.1) | 1.48 (1.7) |
| S.Em | 0.046 | 0.05 | 0.07 | 0.19 | 0.11 | 0.08 | 0.07 |
| CD (P=0.05) | 0.14 | 0.15 | 0.19 | 0.57 | 0.33 | 0.24 | 0.23 |
*Data in parentheses were subjected to square root (√x+0.5) transformation and used for statistical analysis, BLW: Broad leaf weeds, SEm: Standard error of mean.
3.2.2. Individual weed population at 60 DAT
The data on individual weed populations recorded at 60 DAT are shown in Table 4. At 60 DAT, individual weed populations were found to be significantly lower under conoweeding and hand weeding treatments over the rest of the treatments and at par with the treatment (T6). Application of pretilachlor (0.5 kg ai/ha) recorded a lower individual weed population (m-2) of 2.10, 2.14, 1.79, 3.21, 2.99, 1.84, and 1.48 weeds of E. colonum, E. crus-galli, L. chinensis, C. rotundus, C. difformis, S. zeylanica, and E. alba, respectively, which suppressed the early emerged weeds on 60 DAT effectively. The highest individual weed count at 60 DAT was recorded in the control plot (T1).
Table 4: Weed management practices in weed number (m2) of rice grown under SRI at 60 DAT.
| Treatments | Grasses | Sedges | BLW | ||||
|---|---|---|---|---|---|---|---|
| Echinochloa colonum | Echinochloa crus-galli | Leptochloa chinensis | Cyperus rotundus | Cyperus difformis | Sphenoclea zeylanica | Eclipta alba | |
| T1 | 5.36 (28.2) | 4.57 (20.4) | 3.62 (12.6) | 8.29 (68.22) | 7.06 (49.3) | 4.0 (15.5) | 3.38 (10.9) |
| T2 | 2.01 (3.54) | 2.06 (3.73) | - | 2.96 (8.29) | 2.88 (7.78) | - | - |
| T3 | 1.82 (2.81) | 1.73 (2.5) | - | 2.86 (7.67) | 2.71 (6.86) | - | - |
| T4 | 2.17 (4.2) | 2.17 (4.2) | 1.89 (3.1) | 3.41 (11.1) | 3.11 (9.2) | 2.37 (5.1) | 1.70 (2.4) |
| T5 | 3.02 (8.61) | 2.72 (6.9) | 2.19 (4.3) | 3.82 (14.1) | 3.58 (12.3) | 2.61 (6.3) | 1.79 (2.7) |
| T6 | 2.10 (3.9) | 2.14 (4.1) | 1.79 (2.7) | 3.21 (9.8) | 2.99 (8.42) | 1.84 (2.9) | 1.48 (1.7) |
| T7 | 2.88 (7.8) | 2.51 (5.8) | 2.0 (3.5) | 3.66 (12.9) | 3.35 (10.7) | 2.24 (4.5) | 1.92 (3.2) |
| T8 | 2.17 (4.19) | 2.17 (4.2) | 1.89 (3.1) | 3.38 (10.95) | 3.11 (9.2) | 2.32 (4.89) | 1.7 (2.39) |
| S.Em | 0.09 | 0.17 | 0.04 | 0.21 | 0.29 | 0.13 | 0.07 |
| CD (P=0.05) | 0.29 | 0.53 | 0.13 | 0.65 | 0.88 | 0.40 | 0.22 |
*Data in parentheses were subjected to square root (√x+0.5) transformation and used for statistical analysis, BLW: Broad leaf weeds, SEm: Standard error of mean.
3.2.3. Effect of treatments on total weed population
The total weed count m-2 at 30 and 60 DAT is calculated and shown in Table 5. Among the chemical treatments, the lowest weed count (m-2) of 5.11 and 5.83 at 30 DAT and 60 DAT, respectively, was recorded in treatment (T6) with the application of pretilachlor (0.5 kg ai/ha), which is on par with cono weeding (T3). The highest weed count (m-2) of 12.89 and 14.34 at 30 and 60 DAT, respectively was recorded in unweeded control (T1). The reduced weed density is due to mechanical weeding, where the weeds are uprooted and incorporated into the same yield [15]. The pre-emergence application of herbicide has selective systemic absorption by leaves and secondary absorption by roots and acts as a seed germination inhibitor by virtue of interfering with protein synthesis and proteinase activity, which block the chained amino acids on weedy plants and inhibit weed growth [16].
Table 5: Weed management practices in rice under SRI for weed dynamics, removal nutrients and phytotoxicity scores at 30and 60 DAT.
| Treatments | Total weed count (m2) | Weed DMP (kg/ha) | Weed Control Index (WCI) | Weed control efficiency (WCE) | Nutrient removal by weeds (kg/ha) | Phytotoxicity scoring | ||||||
|---|---|---|---|---|---|---|---|---|---|---|---|---|
| 30 DAT | 60 DAT | 30 DAT | 60 DAT | 30 DAT | 60 DAT | 30 DAT | 60 DAT | N | P | K | 0 | |
| T1 | 12.89 (165.66) | 14.34 (205.12) | 331.3 | 410.5 | - | - | - | - | 32.7 | 6.6 | 15.4 | 0 |
| T2 | 4.12 (16.5) | 4.88 (23.34) | 33.4 | 46.6 | 89.9 | 88.6 | 90.0 | 88.6 | 13.5 | 2.2 | 10.3 | 0 |
| T3 | 3.66 (12.91) | 4.51 (19.84) | 25.8 | 39.6 | 92.2 | 90.4 | 92.2 | 90.3 | 12.5 | 2.11 | 9.2 | 0 |
| T4 | 5.57 (30.51) | 6.31 (39.3) | 63.4 | 80.5 | 80.9 | 80.4 | 81.6 | 80.8 | 20.4 | 3.2 | 13.6 | 0 |
| T5 | 6.43 (40.94) | 7.46 (55.21) | 82.8 | 112.4 | 75.0 | 72.6 | 75.3 | 73.1 | 24.3 | 3.5 | 15.9 | 0 |
| T6 | 5.11 (25.6) | 5.83 (33.52) | 52.1 | 67.5 | 84.3 | 83.6 | 84.5 | 83.7 | 16.7 | 2.9 | 11.6 | 0 |
| T7 | 6.06 (36.25) | 6.99 (48.4) | 74.5 | 96.8 | 77.5 | 76.4 | 78.1 | 76.4 | 22.5 | 3.3 | 13.8 | 0 |
| T8 | 5.44 (29.11) | 6.28 (38.92) | 59.1 | 77.8 | 82.2 | 81.0 | 82.4 | 81.0 | 18.5 | 3.1 | 12.8 | 0 |
| S.Em | 0.75 | 1.81 | 2.25 | 1.41 | - | - | - | - | 0.33 | 0.06 | 0.18 | - |
| CD P=0.05 | 2.26 | 5.49 | 6.82 | 4.26 | - | - | - | - | 1.01 | 0.18 | 0.55 | - |
*Data in parentheses were subjected to square root (√x+0.5) transformation and used in statistical analysis, *DAT: Days after transplanting, N: Nitrogen, P: Phosphorus, K: Potassium, SEm: Standard error of the mean.
3.3. Weed Dry Matter Production (DMP)
The weed DMP recorded at 30 DAT and 60 DAT are shown in Table 5. All the treatments were significantly influenced by each other. Among the chemical treatments, the treatment (T6) recorded the lowest weed DMP of 52.1 and 67.5 kg/ha at 30 and 60 DAT, respectively. The highest weed DMPs of 331.3 and 410.5 kg/ha at 30 and 60 DAT, respectively, were noticed in treatment T1 (unweeded control). The study’s findings showed a significant decrease in weed biomass in all the herbicide-treated plots as compared to the weed-free control. Due to their limited spectrum of activity, the use of a single herbicide rarely produces satisfactory and season-long weed control [17].
3.4. WCE
The data pertaining to WCE was recorded at 30 DAT and 60 DAT, as shown in Table 5. Among the herbicide treatments, as could be expected, the maximum WCE of 84.5 and 83.7% at 30 and 60 DAT, respectively, was recorded in treatment (T6) pretilachlor (0.5 kg ai/ha), which is on par with cono weeding (T3). A higher WCE was achieved as a result of decreased weed biomass brought on by successful weed management strategies [18].
3.5. WCI
The data on WCI were recorded at 30 DAT and 60 DAT, as shown in Table 5. Among the herbicides, as could be expected, the higher WCI of 84.3 and 83.6% on 30 and 60 DAT, respectively, was recorded in treatment (T6) with pretilachlor (0.5 kg ai/ha). Due to the superior performance of cono weeding and hand weeding by removing all weeds and existing vegetation without sparing any one of the groups of individual weeds, the overall weed count and weed DMP were lower and the WCI was greater [19].
3.6. Nutrient Removal by Weeds
The computed data on NPK removal by weeds were recorded and shown in Table 5. The ability of weeds to consume nutrients was significantly affected by all treatments. Among the chemical treatments (T6), pretilachlor (0.5 kg ai/ha) recorded the nutrient removal of weeds of 16.7, 2.9, and 11.6 kg/ha of Nitrogen, Phosphorus, and Potassium, respectively. The higher nutrient removal by weeds of 32.7, 6.6, and 15.4 kg/ha of Nitrogen, Phosphorus, and Potassium, respectively, was recorded in treatment T1 (unweeded control). Increased nutrient removal by weeds in unweeded areas may be a result of weeds’ quick growth, which allowed them to take up available nutrients before crop plants and led to an insufficient supply of nutrients for the crop [20].
3.7. Phytotoxicity of Herbicides
Table 5 shows the impact of herbicide phytotoxicity on the visual grading of paddy crops. On days 6 and 10, the pre-emergent herbicide caused no visible damage or signs of phytotoxicity [21,22].
3.8. Grain yield and Straw Yield
The data computed and recorded on grain yield and straw yield is shown in Figure 2. Among the cultural treatments, (T3) twice-cono weeding recorded the highest grain and straw yields of 5804.5 and 7352.5 kg/ha, respectively, which was on par with (T2). Among the chemical treatments, (T6) was recorded with grain yield and straw yield of 5347.6 and 6893.6 kg/ha, respectively. The maximum grain yield could be due to lower weed crop competition at crop growth stages by herbicide application, which promoted the effective use of resources. The application of pretilachlor gave effective control of weeds like grasses and sedges, which led to increased grain yield. The variance in weed biomass and density caused the variation in grain yield under the various treatments [22]. Rice growth and yield may have been better achieved if weeds had been effectively suppressed and controlled beginning in the early phases of the crop. The lowest grain yield and straw yield of 2138.2 and 3428.5 kg/ha, respectively, were recorded in the control plot (T1). Lower grain yield is due to decreased yield components and higher weed biomass, since weeds compete for nutrients, light, and space more than crop plants. Due to heavy competition for resources, weeds prevent rice from growing and limit the uptake of nutrients. The results are in line with the findings of others [23], who also found that complex weed flora affected yield components of rice, which resulted in varying grain yields.
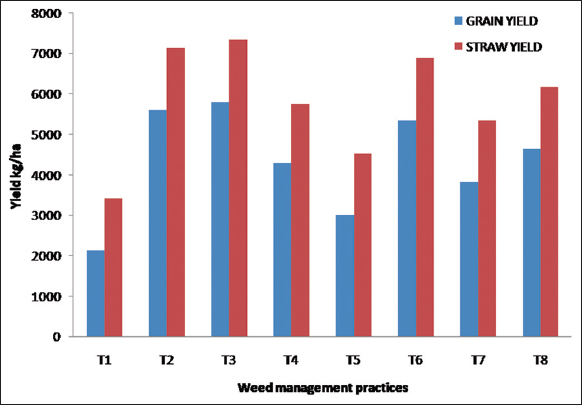 | Figure 2: Weed management practices on grain and straw yield (kg/ha) in rice under SRI. [Click here to view] |
4. CONCLUSION
The findings demonstrate that various weed control strategies have a significant impact on weed dynamics and yield measures. Pretilachlor application of 0.5 kg ai/ha under the rice intensive production technology system at 3-5 DAT can be safely used for weed flora control during rice vegetative growth.
5. ACKNOWLEDGMENT
The authors wish to express their gratitude to the Department of Agronomy, Faculty of Agriculture, Annamalai University, Chidambaram, for providing necessary facilities to carry out the research.
6. AUTHORS’ CONTRIBUTIONS
All authors made substantial contributions to conception and design, acquisition of data, or analysis and interpretation of data; took part in drafting the article or revising it critically for important intellectual content; agreed to submit to the current journal; gave final approval of the version to be published; and agreed to be accountable for all aspects of the work. All the authors are eligible to be an author as per the International Committee of Medical Journal Editors (ICMJE) requirements/guidelines.
7. FUNDING
This work was financially supported by UGC-National Fellowship Scheme (grant-02015), NFST, MOTA, New Delhi.
8. CONFLICTS OF INTEREST
The authors report no financial or any other conflicts of interest in this work.
9. ETHICAL APPROVALS
This study does not involve experiments on animals or human subjects.
10. DATA AVAILABILITY
All data generated and analyzed are included within this research article.
11. PUBLISHER’S NOTE
This journal remains neutral with regard to jurisdictional claims in published institutional affiliation.
REFERENCES
1. Agriculture Statistics at a Glance. Directorate of Economics and Statistics, Department of Agriculture and Cooperation, Ministry of Agriculture, Government of India, New Delhi;2022. Available from:https://eands.dacnet.nic.in
2. Asraf U, Hussain S, Sher A, Abrar M, Khan I, Anjum SA. Planting Geometry and Herbicides for Weed Control in Rice:Implication and Challenges. Vol. 2. London:Intechopen;2018. 178. [CrossRef]
3. Yadav DB, Yadav A, Punia SS, Singh N, Duhab A. Pretilachlor +Pyrazosulfuron-ethyl (ready mix) against complex weed flora in transplanted rice and its residual effects. Indian J Weed Sci 2018;50:257-61. [CrossRef]
4. Rao AN, Singh RG, Mahajan G and Wani SP. Weed research issues, challenges and opportunities in India. Crop Prot 2020;134:104451. [CrossRef]
5. Arsil P, Tey YS, Brindal M, Ardiansyah, Sumarni S, Masrukhi. Perceived attributes driving the adoption of system of rice intensification:The Indonesian farmer's view. Open Agric 2022;1:217-25. [CrossRef]
6. Singh AK, Yadav RS, Kumar D, Kumar S, Kumar G. Outcomes of yield attributes, yield and economics of rice through applied various planting methods and weed management practices. Pharm Innov J 2021;10:1135-9.
7. Shekhawat K, Rathore SS, Chauhan BS. Weed management in direct seeded rice. Agronomy 2020;10:1264. [CrossRef]
8. Sebastian S, Karuna K. Study on comparative performances of selected paddy weeders developed in India. J Agric Eng 2023;59:333-45. [CrossRef]
9. Cordeau S, Baudron A, Busset H, Farcy P, Vieren E, Smith RG, et al. Legacy effects of contrasting long-term integrated weed management systems. Front Agron 2022;3:769992. [CrossRef]
10. Crop Production Guide. Published by Directorate of Agriculture, Chennai and Tamil Nadu. Agricutlure University, Coimabatore;2020. Available from:https://agritech.tnau.ac.in/pdf/AGRICULTURE.pdf
11. International Rice Research Institute. Annual Report for 1963. Los Banos, Philippines:IRRI;1965. 224-31. Available from:https://ricetoday.irri.org/in-retrospect-irri-annual-report-1963/
12. Mani VS, Malla ML, Gautam KC, Das B. Weed killing chemicals in potato cultivation. Indian Farm 1973;23:17-8.
13. Mishra A, GC Tosh. Chemical weed control studies in dwarf wheat. J Res Orissa Univ Agric Technol 1979;10:1-6.
14. Gomez KA, Gomez AA. Statistical Procedures for Agricultural Research. 2nd ed. New York, USA:John Wiley and Sons, A Wiley-International Science Publication;1984. 316-66.
15. Derrouch D, Dessaint F, Fried G, Chauvel B. Weed community diversity in conservation agriculture:Post-adoption changes. Agric Ecosyst Environ 2021;312:107351. [CrossRef]
16. Reddy BG, Guruprasad GS, Shivayoganya DP, Gowdar SB, Sridhar D. Bioefficacy of penoxsulam 24% SC herbicide against weeds in direct seeded rice under puddled conditions. J Farm Sci 2016;29:337-9.
17. Suryakala P, Murugan G, Stalin P, Saravanaperumal M, Suseendran K. Effect of pre and post emergence herbicides on weed flora and yield of transplanted rice. Plant Arch 2019;19:3093-6.
18. Choudhary VK, Naidu D, Dixit A. Weed prevalence and productivity of transplanted rice influences by varieties, weed management regimes and row spacing. Arch Agron Soil Sci 2022;68:1872-89. [CrossRef]
19. Saha S, Munda S, Singh S, Kumar V, Jangde HK, Mahapatra A, et al. Crop establishment and weed control options for sustaining dry direct seeded rice production in Eastern India. Agronomy 2021;11:389. [CrossRef]
20. Raj R, Kumar A, Kumar V, Singh CB, Pandey UC. Herbicide options for controlling weeds in transplanted rice (Oryza sativa) under North Eastern Plains Zone. Indian J Agron 2016;61:197-203.
21. Yadav DB, Yadav A, Punia SS. Effectiveness of triafamone+ethoxysulfuron (pre-mix) against complex weed flora in transplanted rice and its residual effects on wheat. Indian J Weed Sci 2019;51:106-10. [CrossRef]
22. Pramanik K, Shah MH, Gupta RK, Singhal M. Bio-efficacy of ready-mix herbicide on weed flora and productivity of transplanted rice. Int J Bio-Resour Stress Manag 2020;11:132-7. [CrossRef]
23. Yadav VR, Singh VP, Kabdal P. Integrated weed management in transplanted rice-an effective approach. Int J Cur Microbiol App Sci 2018;7:1670-9. [CrossRef]