
1. INTRODUCTION
Rice is a staple food majorly in South East Asian countries such as India, Nepal, and Bangladesh. In India, rice is a summer crop, whereas there are regions (mainly West Bengal and Northeast India), where rice is grown 3 times a year (Aus-Aman-Boro). In the Gangetic plain, rice is grown only in the summer months and is harvested with the onset of winter after which Wheat (Triticum spp.) or Mustard (Brassica spp.) is grown. Growing rice needs a lot of water. Farmers of the Indian Gangetic plain use groundwater as a major source of irrigation. Groundwater is mainly pumped out through pumps connected through borewells. Recent studies suggest that due to overexploitation of groundwater and less recharge of groundwater through rains, there has been alarming depletion of groundwater [1-4]. The reserves left will sustain us for less than a decade ultimately resulting to find an alternative crop to grow in this region [5]. Hence, alternative strategies to grown rice in the Gangetic plains are the need of the hour. In this paper, we tried to find out the possibility of growing rice in the areas proximal to the perennial rivers with the intention that irrigation will be easy for the farmers, thereby using the already existing perennial river water for irrigation purposes and try to find out the places best suitable for rice cultivation for sustainable production. It will help to continue growing rice using lesser resources. The broader aim of this paper is to prepare a “suitability map” for rice cultivation in the Gangetic plains of India.
2. MATERIALS AND METHODS
A raster layer can be defined as one or more raster bands, wherein one band represents the value, and the other band represents the color. This paper uses raster layers of annual precipitation, annual mean temperature, height above sea level (DEM or digital elevation model), and new derived raster layers (distance from rivers) to create a final “suitability map” for rice cultivation in Gangetic plain (India) using Multi-Criteria Analysis (MCA) approach in Q-geographical information system (GIS) software.
2.1. Study Area
The study area chosen is the “Gangetic Plains of India” [Figure 1]. It compromises three plains, the upper, middle, and lower Gangetic plains. The soil being highly fertile, the region is also called the “cradle of agriculture in India.” The high fertility of the soil in this region has resulted in intensive farming practices by the farmers, often leading to rice monoculture. Rice being a highly water-demanding crop, farmers use the groundwater resources as the source of irrigation. A study published says that due to this overuse of groundwater and the water aquifers not recharging on time, there has been an immense depletion of the groundwater resources [2]. Thus, this study area was chosen to study if the water from the rivers can be used for irrigation, taking into account the hypothesis that there will be no cultivation of rice crops outside the 20 km radius of a flowing perennial river. Other factors, such as roads, highways, expressways, and human settlement were not taken into account, as this study is trying to map out a suitable map for rice cultivation.
 | Figure 1: The study area: Gangetic plains of India (Source: Google Maps). [Click here to view] |
2.2. Multi-criteria Decision-Making (MCDM)
Multi-criteria decision-making is a method for combining and transforming a variety of geographic data inputs into a decision output [6]. Decision problems that are geographic in nature need to consider a large number of alternate options for the evaluation criteria. This results in many problems which are spatial in nature. Thus, MCDM is needed, which is based on a GIS. While doing MCDM which involves a lot of input data, the preference of selection of criteria’s and also the combination of both is essential [7,8]. In this study, the slope of the study area (recalculated from DEM model), distance from rivers, yearly precipitation, annual mean temperature, and height above mean sea level is the factors taken into account to develop a “suitability map” (Table 1) for rice cultivation in the Gangetic plain (India).
Table 1: The suitability level or suitability class with its description. When the suitability level is 3, it means that rice is highly suitable to cultivate in those areas followed by suitability level 2, where it is moderately suitable and 0 means that rice cultivation is not at all suitable.
| Suitability Level | Description of Each Suitability level |
|---|---|
| 0 | Not at all suitable |
| 1 | Less Suitable |
| 2 | Moderately Suitable |
| 3 | Highly Suitable |
2.3. The Analytic Hierarchy Process (AHP)
The Analytic Hierarchy Process, or AHP, is a commonly used and highly acknowledged approach for making multi-criteria decisions. It helps researcher’s to employ both the original and ideal modes [9]. The correct estimate of appropriate facts is the most critical phase in this decision-making process. As a result, the decision-making processes try to figure out each factor that goes into creating the suitability map. Herein, the approach, which was proposed [10], was used and it is noteworthy to state that this approach of Saaty has long interested other researchers as well. In this project, a scale of four values (suitability level or suitability class) was used to weigh the attribute of any raster. The scales along with a suitable description are given Table 1.
2.4. Collection of Data and the Preparation of GIS Layers
2.4.1. Topography
Slope is important for cropland suitability mapping. It determines the flow of water, runoff, etc. In this paper, the slope was calculated – from DEM [11]. The elevation data given by the Shuttle Radar Topography Mission (STRM) are a common source of DEM data [12]. The 30 m spatial resolution DEM data of STRM were taken from USGS Earth Explorer (https://earthexplorer.usgs.gov). The slope function in the Raster Terrain Analysis of the QGIS long-term release version was used to generate the slope layer. A slope value is assigned to each cell in the raster, with a lower slope indicating flatter terrain and a higher slope indicating steeper terrain. Rice production will benefit from fields on lower slopes that are flatter, as this encourages an equitable and balanced distribution of water. Higher sloped terrain, on the other hand, necessitates the creation of terraces for rice farming. It should be noted that rice cultivation in India extends from 8°N to 35°N latitude and from sea level to as high as 3000 m above sea level [13].
After the slope from 0° to 80° was divided into different classes [Table 2], the layers were reclassified into different suitability levels. The suitability level for each factor was ranked as follows:
Table 2: This above table shows the suitability level or suitability class with its description. When the suitability level is 3, it means rice is highly suitable to cultivate in those areas with slope between 0 – 20 degrees followed by suitability level 2 where it’s moderately suitable with slope being in between 20-40 degrees and 0 means rice cultivation is not at all suitable with slope being 60-80°.
| Suitability Level | Description of Each Suitability level | Slope (in degrees) |
|---|---|---|
| 0 | Not at all suitable | 60–80 |
| 1 | Less suitable | 40–60 |
| 2 | Moderately suitable | 20–40 |
| 3 | Highly suitable | 0–20 |
From Figure 2, we can see that majority of our study area lies within the slope of 0–10°. The slope raster reclassified is analyzed in the result area.
 | Figure 2: The slope of study area after calculating through slope function in Raster Terrain. [Click here to view] |
2.4.2. Climatic variable data: (Temperature and precipitation data)
Crop growth, development, and yield are dependent directly or indirectly on climatic variations. Temperature and rainfall are the two most important climatic parameters, and this is not a secret. Similarly, temperature and precipitation play a significant impact in rice production. Rice which is grown mainly in the tropical and subtropical areas needs high temperature and water availability. The rice crop requires an average temperature range of 21–37°C during its life cycle. Annual precipitation of more than 750 mm is required for rice cultivation. Data of both annual mean temperature and annual precipitation were taken from the world clim v2 data set (worldclim.com/version2). The EPSG:4326 coordinate system was used to set the raster data layers. Layers were classed into different appropriateness levels when the suitability criterion was determined. The suitability level for each factor was then ranked in Table 3. The map obtained can be seen in Figure 3 (temperature) and 4 (precipitation).
Table 3: The suitability level or suitability class with its description. When the suitability level is 3, it means that rice is highly suitable to cultivate along with the best suitable temperature and annual precipitation in those areas followed by suitability level 2, where it is moderately suitable and 0 means rice cultivation that is not at all suitable.
| Suitability Level | Description of Each Suitability level | Temperature in (°C) | Annual Precipitation (in mm) |
|---|---|---|---|
| 0 | Not at all suitable | 30–40 | 3000–4000 |
| 1 | Less suitable | 0–10 | 0–1000 |
| 2 | Moderately suitable | 10–20 | 1000–2000 |
| 3 | Highly suitable | 20–30 | 2000–3000 |
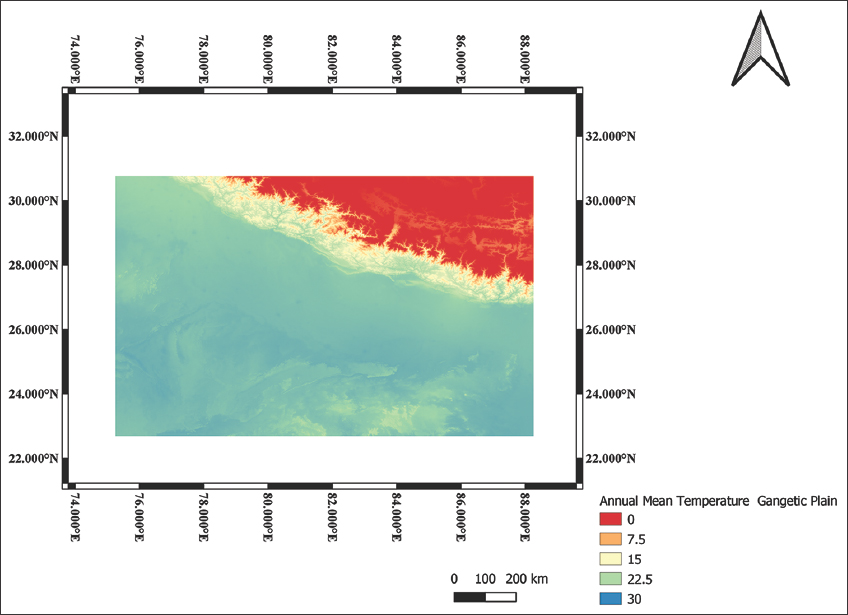 | Figure 3: The annual mean temperature of the study area, wherein we can see that the study area lies within the temperature range of 20–30°C. [Click here to view] |
 | Figure 4: The annual precipitation of the study area. The study area lies within the range of 1250–2500 mm rainfall annually. [Click here to view] |
2.4.3. Distance from rivers
Vector layers of rivers were taken, which were then rasterized with the help of a QGIS tool named “Rasterize (vector to raster).” Then, the proximity map was calculated, where distance was measured in pixels (1 pixel = 0.8 m). Then, the suitability of each factor was taken into account as shown in the following Table 4 [Figures 5 and 6].
Table 4: The suitability level or suitability class with its description. When the suitability level is 3 that the cultivated land is within a range of 0–20km from the river, it means that rice is highly suitable to cultivate in those areas followed by suitability level 2, where it is moderately suitable and 0 means rice cultivation is not at all suitable.
| Suitability Level | Description of Each Suitability level | Distance from Rivers in km |
|---|---|---|
| 0 | Not at all suitable | 100–500 |
| 1 | Less suitable | 40–100 |
| 2 | Moderately suitable | 20–40 |
| 3 | Highly suitable | 0–20 |
 | Figure 5: Rasterized rivers in the study area. [Click here to view] |
 | Figure 6: Proximity map where the distance was measured in pixels (1 pixel=0.8 m). [Click here to view] |
3. RESULTS AND DISCUSSION
Each set of data, namely, annual mean temperature, annual Precipitation, distance from rivers, and slope are classified according to the suitability class [Tables 1-4], and then, the suitability map was constructed with the help of the raster calculator in Q-GIS applying the following formulae:
(“temperature classify” + “precipitation classify” + “proximity from rivers classify” + “slope classify”)/4
The final raster layer with suitability ranging from 0 to 3 was obtained and is displayed below:
4. DISCUSSION
From the results reported in the previous section, we can understand that the study area is moderately suitable for rice cultivation. As in this study, we have taken the distance from rivers into account, so in the “suitability map,” the areas surrounding the rivers are showing moderate suitability for rice cultivation. Now, in the suitability map, there are some parts that are highly suitable, mainly located in the foothills of the Himalayas. How is this happening? Well for this we have to understand the onset and withdrawal of monsoon in India, the windward, and the rain shadow area of the mountains in India [Figures 8 and 9].
 | Figure 7: The suitability map obtained showed that the study area is moderately suitable for rice cultivation when all the assumptions are followed. [Click here to view] |
 | Figure 8: The onset and withdrawal of Indian Monsoon (Map not to scale). [Click here to view] |
 | Figure 9: The windward side of a mountain and the rain-shadow (leeward) side of the mountain. (The straight blue line depicts a mountain for understanding purpose) (Map not to scale). [Click here to view] |
During the summer months, the southwest and southeast monsoon take us moisture from the Arabian sea and the Bay of Bengal respectively. The southeast monsoon cannot cross the Eastern Ghats, thereby moving upward and going toward the northern part of India. While trying to cross the Himalayan range which it is unable to, it showers all its moisture in the foothills of the Himalayas, thus making the place most suitable for rice cultivation according to the assumptions made in this study.
During the winter months, the northwest monsoon takes up moisture from the Caspian Sea and travels along with Afghanistan, Pakistan finally entering India and showering its moisture in the foothills of the Himalayas as it is unable to cross it. Thus, the foothills of the Himalayas receive a lot of rainfall throughout the year which makes it suitable for rice cultivation, when all the assumptions in the study are held.
5. CONCLUSION
5.1. Inference
The study finally comes to a conclusion that with the criterion taken into account, the Gangetic plains of India are moderately suitable for rice cultivation [Figure 7]. In fact, rice cultivation was implemented in the upper and the middle Gangetic plains after the initialization of the green revolution in the 1960s to meet the country’s growing food insecurity. With the drastic effect of climate change and the alarming decrease of groundwater resources, there needs to be a shift in agriculture practices which can otherwise have a drastic impact on the sustainability of agriculture.
Precision agriculture is the future of agriculture; hence, this study with satellite images (DEM) is an eye-opener. This study depicts where we are going wrong in terms of the cultivation of crops. This study should be, further, expanded with each crop all over the country to find the place most suitable for growing the specific crops. The study can be repeated every 5 years to see the change in agroecological and edaphic factors. If this can be done, this will be a great step toward sustainability in Indian agriculture.
5.2. Future Scope of the Study
This study has a lot of future scopes. With the emerging new precision agriculture systems and GIS software, extensive mapping based on MCA decision-making can be done. This will help us to understand the suitable rice-growing areas following the assumptions taken above. This opens up a new area of research that will help us to strengthen our fight against groundwater depletion in the northern Gangetic plains of India.
5.3. Limitations of the Study
There are a few limitations of the study.
Population settlements, roads, and other areas near the river banks have not been taken into consideration. If they are taken into consideration and made a new point map in GIS, the results will be more accurate
The paper considered a 20 km radius from the flowing perennial river
The study can be done for the whole of India, but while performing the MCA, it will be too tedious to rasterize the data at once; hence, the recommendation is to do the study zone-wise and then bring them in one layer.
6. ACKNOWLEDGMENT
Sambit Shome, Padua International Excellence Fellow at the University of Padua, Italy would like to thank the University of Padua for giving him a chance to deal in depth with GIS, during his first-year master’s program. He would also like to thank Shreya Some, Research Fellow-Ahmedabad University, India for her interest and time to come up with her valuable comments which have helped Sambit to give this project a proper shape. Finally, Sambit will extend his heartfelt thanks to Associate Professor, Dr. Hina Upadhyay, School of Agriculture, Lovely Professional University, for her collaboration.
7. AUTHORS’ CONTRIBUTIONS
All authors made substantial contributions to conception and design, acquisition of data, or analysis and interpretation of data; took part in drafting the article or revising it critically for important intellectual content; agreed to submit to the current journal; gave final approval of the version to be published; and agreed to be accountable for all aspects of the work. All the authors are eligible to be an author as per the International Committee of Medical Journal Editors (ICMJE) requirements/guidelines.
8. FUNDING
The research did not receive any funding from in public or commercial sectors.
9. CONFLICTS OF INTEREST
The authors report no financial or any other conflicts of interest in this work.
10. ETHICAL APPROVALS
This study does not involve experiments on animals or human subjects.
11. DATA AVAILABILITY
All data generated and analyzed are included within this research article.
12. PUBLISHER’S NOTE
This journal remains neutral with regard to jurisdictional claims in published institutional affiliation.
REFERENCES
1. Dangar S, Asoka A, Mishra V. Causes and implications of groundwater depletion in India:A review. J Hydrol 2021;596:126103. [CrossRef]
2. MacDonald A, Bonsor H, Ahmed K, Burgess W, Basharat M, Calow R, et al. Groundwater quality and depletion in the Indo-Gangetic basin mapped from in situ observations. Nat Geosci 2016;9:762-6. [CrossRef]
3. Nair AS, Indu J. Assessment of groundwater sustainability and identifying factors including groundwater depletion in India. Geophys Res Lett 2021;48:087255. [CrossRef]
4. Panda DK, Ambast SK, Shamsudduha M. Groundwater Depletion in Northern India:Impacts of the Subregional Anthropogenic Land-use, Socio-politics and Changing. Wiley;2020. 1-16. [CrossRef]
5. Tiwari V, Wahr J, Swenson S. Dwindling groundwater resources in Northern India, from satellite gravity observations. Geophys Res Lett 2009;36:184-201. [CrossRef]
6. Drobne S, Lisec A. Multi-attribute decision analysis in GIS:Weighted linear combination and ordered weighted averaging. Slovenia Inform 2009;33:459-74.
7. Al-Mashreki MH, Mat Akhir JB, Rahim SA, Desa KM, Lihan T, et al. GIS-based sensitivity analysis of multi-criteria weights for land suitability evaluation of sorghum crop in ibb government, republic of yemen. J Basic Appl Sci Res 2011;1:1102-11.
8. Chow T, Sadler R. The consensus of local stakeholders and outside experts in suitability modeling for future cramp development. Landscape Urban Planningm2010;94:9-19. [CrossRef]
9. Triantaphyllou E, Mann S. Using the analytic hierarchy process for decision making in engineering applications:Some challenges. Int J Ind Eng Appl Pract 1995;2:35-44.
10. Saaty T. The Analytical Hierarchy Process. New York:McGraw Hill;1980.
11. Wilson J, Gallant J. Terrain Analysis:Principle and Application. New York:John Wiley and Sons;2000. 87-131.
12. Coltelli M, Fornaro G, Franceschetti G, Lanari R, Migiaccio M, Moreira JR, et al. SIR-C/X-SAR multifrequency multipass interferometry:A new tool for geological interpretation. J Geophys Res 1996;101:23127-48. [CrossRef]
13. Government of India. Farmers'Portal One-stop Shop for Farmers. Tratto da;2020. Available from:https://www.farmer.gov.in/cropstaticsrice.aspx#:~:text=Rice%20cultivation%20in%20India%20extends,an%20assured%20supply%20of%20water [Last accessed on 2021 Jan 20].