
1. INTRODUCTION
Maize (Zea mays L.) is one of the most important food crops in the world, playing a crucial role in food security and agricultural economies, especially in sub-Saharan Africa [1]. In Burkina Faso, maize is the main cereal crop, with an annual production of approximately 2 million tons [2]. It is essential for the country’s food security, with a growing demand due to population growth and the growth of the poultry and industrial sectors [3]. However, maize production faces numerous abiotic stresses such as drought and suboptimal soil nitrogen, which reduce yield and grain quality [4,5]. Indeed, both drought and suboptimal soil nitrogen reduce maize photosynthetic rates, cause ear abortion, and limit assimilate translocation, affecting grain filling and leading to yield loss [1,6]. In addition, climate change exacerbates these abiotic constraints by decreasing the availability of water and soil nutrients [7]. These climatic and edaphic challenges emphasize the need to develop resilient and high-yielding maize varieties adapted to stressful environmental conditions.
A common strategy for developing high-yielding and stress-tolerant varieties is to exploit heterosis, or hybrid vigour [8], which is a process where hybrids resulting from crosses between two parental lines show superior performance [9]. However, not all parental lines exhibit exploitable heterosis when hybridized. Therefore, analysing the combining ability of parental lines is crucial to determine the performance of hybrids [10]. Several authors used combining ability to create superior hybrids with high grain yields [11], strong tolerance to biotic [12] and abiotic stresses [13]. Different methods, including diallel design [1], “line by tester” design [14], and North Carolina design [15], have been used to estimate the combining ability of new maize lines. The “line by tester” method is commonly used because it provides information on general combining ability (GCA) and specific combining ability (SCA) effects of lines and testers. However, very few large-scale studies have been carried out on new parental lines using the “line by tester” method. Therefore, this study aims to estimate GCA and SCA of new maize lines developed at CIMMYT, under optimal, drought, and suboptimal soil nitrogen conditions, using a large-scale line by tester analysis.
2. MATERIAL AND METHODS
2.1. Experimental Sites
The trials were conducted at five research stations in Kenya in 2021 and 2022: Kiboko, Embu, Kirinyaga, Kitale, and Kakamega [Table 1]. The Kiboko station, located at an altitude of 975 m with rainfall ranging from 545 to 629 mm and a sandy-clay soil, is situated at coordinates 37°75‘E, 2°15’S [Table 1]. The Kiboko station hosted trials under optimal moisture and optimal soil nitrogen, suboptimal soil in 2021 and 2022, as well as trials under drought stress (DS) and suboptimal soil nitrogen (LN) conditions in 2022. The Kitale station is located at 35.0°E, 1.0°N at an altitude of 1,900 m, with rainfall ranging from 1,000 to 1,499 mm and a clay-loam soil type [Table 1]. The Kirinyaga station is located at an altitude of 1,464 m at coordinates 37°20‘E, 0°30’S, with rainfall ranging from 800 to 1,200 mm and a clay-loam soil. Trials under optimal moisture and soil nitrogen fertilization (OP) were carried out at the Kitale and Kirinyaga stations in 2022. The Embu station is located at an altitude of 1,510 m, with a rainfall of 1,200 to 1,500 mm and a clay-loam soil, at coordinates 37°42‘E, 0°449’S. Finally, the Kakamega station, located at an altitude of 1585 m with a rainfall of 1995 mm and sandy-loam soil, is situated at coordinates 34°45‘E, 0°16’N [Table 1]. Trials under optimal moisture and nitrogen fertilization (OP) were carried out at Embu and Kakamega in 2021 and 2022.
Table 1: Characteristics of the experimental sites.
| Site | Elevation (masl) | Rainfall (mm) | Soil type | Longitude | Latitude | Year 2021 | Year 2022 |
|---|---|---|---|---|---|---|---|
| Kiboko | 975 | 545–629 | Sandy clay | 37°75’E | 2°15’S | OP | OP, DS, and LN |
| Kitale | 1900 | 1,000–1,499 | Clay loam | 35°0’E | 1.0°N | - | OP |
| Kirinyaga | 1,464 | 800–1,200 | Clay loam | 37°20’E | 0°30’S | - | OP |
| Embu | 1510 | 1,200–1,500 | Clay loam | 37°42’E | 0°449’S | OP | - |
| Kakamega | 1585 | 1995 | Sandy loam | 34°45’E | 0°16’N | OP | - |
OP: Optimal moisture and nitrogen fertilization condition, DS: Drought stress condition, LN: Low nitrogen condition.
2.2. Plant Material
Thirty-two tropical maize lines developed at CIMMYT were used in this study [Table 1].
Among these lines, 14 were from the CIMMYT-Zimbabwe maize breeding program, and 18 were from the CIMMYT-Kenya program. These 32 lines were crossed to 10 testers to develop single-cross hybrids [Table 2]. These lines and testers have been used in hybrid development in CIMMYT maize breeding programs [7,16].
Table 2: Plant material used.
| N° | Code | Pedigree | Type | Source |
|---|---|---|---|---|
| 1 | L1 | CZL1470 | Lines | CIMMYT-Zimbabwe |
| 2 | L2 | CZL15089 | CIMMYT-Zimbabwe | |
| 3 | L3 | CZL15109 | CIMMYT-Zimbabwe | |
| 4 | L4 | CZL15110 | CIMMYT-Zimbabwe | |
| 5 | L5 | CZL15111 | CIMMYT-Zimbabwe | |
| 6 | L6 | CZL15206 | CIMMYT-Zimbabwe | |
| 7 | L7 | CZL15231 | CIMMYT-Zimbabwe | |
| 8 | L8 | CZL15237 | CIMMYT-Zimbabwe | |
| 9 | L9 | CZL16101 | CIMMYT-Zimbabwe | |
| 10 | L10 | CZL16151 | CIMMYT-Zimbabwe | |
| 11 | L11 | CZL17003 | CIMMYT-Zimbabwe | |
| 12 | L12 | CZL17015 | CIMMYT-Zimbabwe | |
| 13 | L13 | CZL17016 | CIMMYT-Zimbabwe | |
| 14 | L14 | CZL17033 | CIMMYT-Zimbabwe | |
| 15 | L15 | EB098-76 | CIMMYT-Kenya | |
| 16 | L16 | EBL17595 | CIMMYT-Kenya | |
| 17 | L17 | EBL17596 | CIMMYT-Kenya | |
| 18 | L18 | EBL17599 | CIMMYT-Kenya | |
| 19 | L19 | EBL17602 | CIMMYT-Kenya | |
| 20 | L20 | EBL17608 | CIMMYT-Kenya | |
| 21 | L21 | EBL192108 | CIMMYT-Kenya | |
| 22 | L22 | EBL192110 | CIMMYT-Kenya | |
| 23 | L23 | EBL192112 | CIMMYT-Kenya | |
| 24 | L24 | EBL192127 | CIMMYT-Kenya | |
| 25 | L25 | EBL192163 | CIMMYT-Kenya | |
| 26 | L26 | EBL192166 | CIMMYT-Kenya | |
| 27 | L27 | EBL192167 | CIMMYT-Kenya | |
| 28 | L28 | EBL192168 | CIMMYT-Kenya | |
| 29 | L29 | EBL192169 | CIMMYT-Kenya | |
| 30 | L30 | EBL192170 | CIMMYT-Kenya | |
| 31 | L31 | EBL192184 | CIMMYT-Kenya | |
| 32 | L32 | EBL192185 | CIMMYT-Kenya | |
| 33 | T1 | CKDHL120918/CML494 | Testers | CIMMYT-Kenya |
| 34 | T2 | CKLMARSI0037/CKLTI0138 | CIMMYT-Kenya | |
| 35 | T3 | CKLMARSI0037/CML543 | CIMMYT-Kenya | |
| 36 | T4 | CKLTI0138/CKLMARSI0022 | CIMMYT-Kenya | |
| 37 | T5 | CKLTI0138/CML550 | CIMMYT-Kenya | |
| 38 | T6 | CKLTI0227/CKDHL120918 | CIMMYT-Kenya | |
| 39 | T7 | CML322/CML543 | CIMMYT-Kenya | |
| 40 | T8 | CML543/CML566 | CIMMYT-Kenya | |
| 41 | T9 | CML566/CML395 | CIMMYT-Kenya | |
| 42 | T10 | CML566/CML569 | CIMMYT-Kenya |
2.3. Experimental Design
In 2021, the test-cross hybrids were evaluated under optimal conditions using a 4 × 83 alpha lattice design with two replications. In 2022, the testcross hybrids were evaluated under optimal, drought, and suboptimal soil nitrogen using a 4 × 83 alpha lattice design with two replications for the stress trials. For optimal conditions, a sparse testing was used to evaluate the 320 test-crosses over five sites, with 220 test-crosses per site using a 10 × 23 alpha lattice design.
2.4. Field Managements
In all trials, each entry was sown in a 5 m long single row plot, with a spacing of 0.75 m between rows and 0.25 m between hills corresponding to a density of 53,333 plants/ha. In the 2022 trials, water deficit was induced by stopping irrigation 2 weeks before flowering until harvest. Suboptimal nitrogen levels were achieved at the site by continuous maize planting without the application of nitrogen fertilizer. Under suboptimal nitrogen, 50 kg P2O5/ha was applied, whereas an additional 192 kg N/ha was applied under optimal and DS conditions. The optimal condition is characterized by an adequate supply of water through regular irrigation or in areas with high rainfall, and a recommended nitrogen application used for optimal maize growth.
2.5. Data Collection
Data were collected for the following parameters:
Plant height (PH): This corresponds to the size of the plant from the base to the last node before the panicle. Measurements were taken in centimeters, after anthesis, using a measuring tape on a randomly selected sample of 10 plants per plot;
Ear height (EH): This corresponds to the measurement in centimeters of the insertion height of the ear from the base of the plant to the insertion node of the main ear. Measurements were also taken on a sample of 10 plants per useful plot, using the measuring rod, chosen at random;
Days to 50% anthesis (DA): This was assessed on half the plants in the plot by counting the number of days between sowing and pollen shed;
Days to 50% silking (DS): This was assessed by counting the number of days between sowing and stigma emission on half the plants in the plot.
Anthesis-silking interval (ASI): This is the number of days between male and female flowering. It is calculated using the following formula ASI = DS − DA
Plant aspect (PA): Rated on a scale of 1–5 according to plant and EH, uniformity, disease, and insect damage, and lodging: 1: Excellent. Healthy plants, optimal height, well-positioned ears, perfect uniformity, no disease or insect damage, no lodging; 2: Very good. Slight variations in height or uniformity, some minor disease or insect damage, but overall healthy, slight lodging possible; 3: Fair. Variable height and uniformity, visible signs of disease or insect damage, some poorly positioned ears, moderate lodging; 4: Poor. Marked height and uniformity problems, significant disease and insect damage, several poorly positioned ears, pronounced lodging; 5: Very poor, plants in poor condition, very poor height and uniformity, severe disease and insect damage, severe lodging compromising harvest.
Ear aspect (EA): This was assessed on a scale of 1–5 according to ear size, filling, uniformity, disease, and insect damage. 1: Excellent, large ears, well filled, uniform, no signs of disease or insect damage; 2: Very good, good size ears, slightly irregular, with some minor imperfections, but overall sound; 3: Fair, ears of variable size, uneven filling, some signs of disease or insect damage, but acceptable; 4: Poor, small and poorly filled ears, with visible disease or insect damage, reduced quality; 5: Very poor, very small ears, poorly filled, with significant undesirable characteristics, seriously affecting their quality.
Ear per plant (EP): This corresponds to the number of ears with at least one fully developed grain divided by the number of plants harvested.
Grain yield (GY): This is the production potential of the variety based on the weight of the ear, the grains harvested, and the relative humidity of the grains after drying. This yield is calculated using the following formula: .
 |
With: RW: Raw weight in kilograms of all the ears harvested per elementary plot; GWs: Grain weight in kilograms of the ears in the sample; EWs: Weight in kilograms of the ears in the sample. H: Relative humidity of grain at harvest S: Plot area in square meters (m2); GY: Grain yield in t/ha.
2.6. Data Analysis
The “Line by Tester” procedure was used to estimate GCA, SCA, and variance components for all parameters studied using AGD-R software [17]. The analysis was carried out using the Kempthorne [18] method for multi-environment data from trials conducted using the alpha lattice experimental design. The sums of squares of the genotypic and genotype-by-environment variances were partitioned into variations due to the lines, the testers (GCA), the line-by-tester interaction (SCA), and their interactions with the environments. The following statistical model was used: Yijk = μ + Li + Tj + LTij + LEie + TEje + LTEije + Ee + REPk(Ee) + BLK(REPk(Ee)) + €ijke; Where: Yijk = Mean trait value observed on a cross i × j in kth replication, μ = Grand mean, Li = GCA effect of the ith line, Tj = GCA effect of the jth tester, LTij = SCA effect of the cross i x j, LEie = Effect of the ith line in the eth environment, TEje = Effect of the jth tester in the eth environment, LTEije = Effect of the cross i × j in eth environment, Ee = Effect of the eth environment, REPk (Ee) = Effect of kth replication nested within eth environment, BLK (REPk (Ee)) = Random effect of block nested in replicate k nested in environment e, €ijke = Error associated with each observation or experimental error. The proportion of additive and dominance variance components was computed using
 [19]. [19]. |
3. RESULTS AND DISCUSSION
3.1. Effects of Genotypes and Environments on Measured Parameters
The analysis of variance revealed significant variations between lines, testers, and line by tester interaction for most of the parameters measured under optimal, drought, and suboptimal soil nitrogen conditions [Table 3]. These results show significant genetic diversity among the lines and testers tested, highlighting the potential to identify superior parental lines with strong combining ability for the development of stress-tolerant and high-yielding hybrid maize varieties. Similar results have been reported by several authors [20,21]. In addition, the significant variation in line-by-tester interactions indicates that the variability in measured parameters is primarily due to gene combinations in test-crosses. These interactions reveal unique combined effects on yield and plant morpho-physiological traits, underscoring the importance of selecting appropriate testers for evaluating new germplasm, as reported by Chandel et al. [22]. Moreover, the ANOVA results also showed that experimental site conditions significantly affected the measured traits, confirming the need for multi-environment testing to accurately select stress-tolerant varieties [23]. These findings enhance understanding of factors influencing crop performance under stress and support the development of stress-tolerant maize varieties for diverse agroecological zones, as noted in previous studies [7].
Table 3: ANOVA for the parameters studied under three management conditions.
| Optimal | |||||||||
|---|---|---|---|---|---|---|---|---|---|
| Source | DF | GY | DA | DS | ASI | EH | PH | EP | EA |
| Site (S) | 7 | 224.31*** | 19483.12*** | 19204.03*** | 318.62*** | 10388.85*** | 12038.30*** | 1.07*** | 15.57*** |
| Rep (S) | 8 | 20.58*** | 18.62*** | 26.64*** | 13.17*** | 672.61*** | 1167.99*** | 0.07*** | 6.95*** |
| G. | 311 | 5.64*** | 20.92*** | 22.40*** | 2.96*** | 505.46*** | 702.86*** | 0.02*** | 0.54*** |
| L. | 31 | 28.47*** | 113.52*** | 113.59*** | 8.38*** | 2972.41*** | 3585.59*** | 0.05*** | 2.18*** |
| T. | 9 | 37.05*** | 204.93*** | 213.57*** | 16.50*** | 3207.96*** | 2981.76*** | 0.12*** | 2.14*** |
| L × T | 271 | 1.99*** | 4.21*** | 5.61*** | 1.88** | 133.47*** | 297.42*** | 0.02*** | 0.30*** |
| S × G | 1684 | 1.67*** | 3.36*** | 3.90*** | 1.61* | 83.27*** | 147.07** | 0.01 | 0.27*** |
| S × L | 217 | 3.54*** | 6.16*** | 6.36*** | 2.26*** | 157.40*** | 281.34*** | 0.02*** | 0.49*** |
| S × T | 63 | 5.92*** | 10.20*** | 12.37*** | 2.60*** | 88.9 | 193.58* | 0.02* | 0.51*** |
| S × L × T | 1404 | 1.19 | 2.63 | 3.14 | 1.50 | 71.34 | 123.81 | 0.01 | 0.22 |
| Error | 1401 | 1.19 | 1401 | 3.13 | 1.50 | 66.50 | 121.34 | 0.01 | 1398 |
| Drought | |||||||||
| Source | DF | GY | DA | DS | ASI | EH | PH | EP | EA |
| Rep | 1 | 87.71*** | 23.76*** | 1.23 | 47.42*** | 360.94** | 2458.17*** | 2.30*** | 11.67*** |
| G. | 311 | 0.52* | 3.37*** | 5.78*** | 2.51** | 121.30*** | 163.67*** | 0.03 | 0.24 |
| L. | 31 | 1.47*** | 15.22*** | 22.08*** | 7.57*** | 563.61*** | 535.68*** | 0.07*** | 0.76*** |
| T. | 9 | 0.85* | 17.19*** | 36.29*** | 8.72*** | 505.90*** | 203.46** | 0.08*** | 0.37 |
| L × T | 271 | 0.39* | 1.56 | 2.89 | 1.72 | 57.93*** | 119.80*** | 0.02 | 0.18 |
| Error | 167 | 0.40 | 1.44 | 2.57 | 1.75 | 29.94 | 66.54 | 0.02 | 0.21 |
| Suboptimal soil nitrogen | |||||||||
| Source | DF | GY | DA | ASI | DS | EH | PH | EP | EA |
| Rep | 1 | 0.16 | 15.89*** | 28.86*** | 86.70*** | 15.10 | 75.23 | 0.02* | 0.06** |
| G. | 311 | 0.64*** | 3.25*** | 2.76*** | 6.87*** | 92.33*** | 196.13*** | 0.03 | 0.15* |
| L. | 31 | 1.72*** | 16.49*** | 9.06*** | 25.22*** | 547.18*** | 752.21*** | 0.07*** | 0.30*** |
| T. | 9 | 1.33** | 22.01*** | 10.47*** | 53.50*** | 169.40*** | 556.00*** | 0.12*** | 0.22 |
| L × T | 271 | 0.50* | 1.11 | 1.79 | 3.22* | 37.74** | 120.57 | 0.02 | 0.13 |
| Error | 167 | 0.39 | 0.99 | 1.75 | 2.54 | 26.52 | 99.34 | 0.02 | 0.12 |
Rep: replication, G.: Genotypes, DF: Degree of freedom, GY: Grain yield, DA: Days to anthesis, ASI: Interval between anthesis and silking, DS: Days to silking, PH: Plant height, EH: Ear height, EP: Ear per plant, EA: Ear aspect, MS: Mean square, ANOVA: Analysis of variance,
Significance at P<0.05;
Significance at P<0.01;
Significance at P<0.001
3.2. GCA
3.2.1. GCA under optimal conditions
Under optimal conditions, lines L1, L2, L4, L5, L6, L9, and L10 as well as testers T8, T9, and T10, showed positive and significant GCA for grain yield (GY), plant height (PH), ear height (EH), days to anthesis (DA), and days to silking (DS) [Table 4], indicating their potential as good general combiners. Conversely, lines L7, L8, L11, L13, L14, L15, and L32, as well as testers T1, T4, and T6, showed negative GCA, indicating their status as poor general combiners under optimal conditions. These GCA values for lines and testers indicate their potential role in hybrid development, reflecting additive gene effects passed on to the offspring [10,24]. The positive GCA observed for grain yield (GY) in this study suggests that these lines and testers enhance yield potential. Similarly, positive GCA values for PH and EH may reflect desirable plant architecture and ear positioning, supporting overall plant performance. A positive GCA for male and female flowering days indicates a genetic tendency toward delayed flowering, which can lead to late maturity and prolonged grain filling. Many previous studies have also reported positive GCA for maize yield and other traits under optimal conditions, highlighting the predominance of additive genetic effects [21,25].
Table 4: General combining ability (GCA) of lines and testers under optimal conditions.
| Line | GY | DA | DS | ASI | EH | PH | EA | PA | EP |
|---|---|---|---|---|---|---|---|---|---|
| 0.51* | 1.22*** | 1.39*** | 0.16 | 1.82 | 3.86 | −0.03 | −0.05 | 0.02* | |
| 0.74*** | 1.04*** | 0.69* | −0.25 | 15.39*** | 13.93*** | 0.06 | 0.05 | 0.00 | |
| L3 | 0.17 | 0.65* | 0.72* | 0.06 | −1.95 | −2.4 | −0.05 | −0.01 | −0.03* |
| 0.69*** | 0.57* | 0.75* | 0.14 | 3.88* | 8.32*** | −0.01 | 0.00 | 0.00 | |
| 0.55*** | 0.92*** | 0.95*** | 0.03 | 4.65* | 5.35* | 0.07 | 0.01 | −0.01 | |
| 0.5* | 1.04*** | 0.96*** | −0.02 | −1.69 | 4.99 | −0.15* | −0.09 | 0.01 | |
| L7 | −0.72*** | 1.03*** | 0.93*** | −0.03 | −10.09*** | −16.6*** | 0.13* | −0.03 | −0.01 |
| L8 | −0.38* | 1.2*** | 0.85* | −0.24 | 1.51 | −6.27* | 0.13* | 0.06 | 0.01 |
| 0.57*** | 0.64* | 0.03 | −0.44*** | 4.03* | 4.15 | −0.2*** | −0.06 | 0.00 | |
| 0.76*** | 0.11 | −0.04 | −0.13 | 9.3*** | 8.08*** | −0.13* | −0.08 | 0.00 | |
| L11 | −0.22 | −0.39 | −0.64* | −0.21 | −6.47*** | −1.45 | −0.09 | −0.02 | 0.00 |
| 0.24 | 1.77*** | 1.86*** | 0.08 | 3.31 | −0.28 | −0.01 | 0.02 | 0.02 | |
| L13 | −1.04*** | −3.32*** | −2.93*** | 0.18 | −13.48*** | −13.3*** | 0.05 | −0.02 | −0.01 |
| L14 | −0.45* | −0.11 | −0.3 | −0.13 | 0.97 | 5.59* | −0.09 | −0.01 | 0.01 |
| L15 | −0.54* | −2.01*** | −1.98*** | −0.01 | −2.12 | 2.00 | 0.03 | −0.07 | 0.00 |
| L16 | −0.02 | −0.29 | −0.27 | 0.04 | −1.50 | −1.12 | −0.14* | 0.00 | −0.01 |
| L17 | −0.09 | −0.31 | −0.28 | 0.04 | 1.11 | −0.57 | −0.11 | 0.00 | 0.00 |
| L18 | 0.35 | 0.17 | 0.33 | 0.14 | 4.28* | 7.7*** | −0.11 | −0.03 | 0.00 |
| 0.07 | 0.98*** | 0.79* | −0.12 | 4.84* | 4.46 | −0.09 | 0.02 | −0.01 | |
| L20 | −0.11 | −0.37 | −0.67* | −0.23 | 4.09* | −5.55* | −0.07 | 0.01 | 0.01 |
| −0.39* | −1.05*** | −0.78* | 0.22 | −6.35*** | −0.39 | 0.09 | 0.04 | 0.00 | |
| L22 | −0.15 | −0.47 | −0.34 | 0.09 | 0.91 | 5.55* | 0.1 | 0.03 | −0.01 |
| L23 | −0.29 | −0.73* | −0.52 | 0.12 | −4.21* | 0.58 | 0.07 | 0.03 | 0.01 |
| L24 | −0.24 | 0.48 | 0.57* | 0.06 | −3.59* | −3.55 | −0.06 | 0.03 | −0.01 |
| L25 | 0.16 | −0.49 | −0.73* | −0.17 | −0.35 | 0.73 | 0.11 | 0.06 | 0.03* |
| L26 | −0.22 | −0.78* | −0.83* | −0.05 | 3.29 | −0.76 | 0.13* | 0.05 | 0.01 |
| L27 | 0.06 | −0.39 | −0.37 | 0.01 | 2.41 | −0.58 | −0.02 | 0.04 | 0.02* |
| L28 | 0.00 | −0.49 | −0.55 | −0.07 | 3.18 | −0.23 | −0.04 | 0.00 | 0.00 |
| 0.33 | 0.19 | 0.22 | 0.01 | 5.46* | 2.51 | 0.04 | 0.07 | 0.00 | |
| L30 | −0.3 | −1.12 | −1.28*** | −0.14 | −0.85 | −5.68* | 0.12* | 0.03 | −0.01 |
| L31 | −0.15 | −0.04 | 0.43 | 0.36*** | −9.17*** | −7.23* | 0.14* | −0.01 | −0.02 |
| −0.4* | 0.36 | 1.03*** | 0.49*** | −12.62*** | −11.86*** | 0.13* | −0.04 | −0.01 | |
| Tester | |||||||||
| T1 | −0.37* | 0.12 | −0.01 | −0.13 | −3.42*** | −3.45* | 0.01 | 0.04 | 0.01 |
| T2 | −0.19 | −0.5* | −0.68* | −0.14 | −3.26* | −1.63 | 0.06 | 0.00 | 0.01 |
| T3 | 0.13 | −0.13 | 0.28 | 0.37*** | −0.89 | −1.13 | −0.01 | 0.00 | −0.02* |
| T4 | −0.27* | −0.16 | −0.2 | −0.04 | −3.53*** | −2.58 | 0.11*** | 0.02 | 0.00 |
| T5 | −0.04 | −1.11*** | −1.2*** | −0.09 | −0.87 | 0.62 | −0.03 | −0.01 | 0.03*** |
| T6 | −0.38* | −0.97*** | −0.88*** | 0.05 | −2.6* | −1.75 | 0.05 | 0.05 | 0.00 |
| T7 | 0.19 | 0.44* | 0.54* | 0.11 | 0.04* | −2.72 | −0.06 | 0.00 | −0.01 |
| | 0.36* | 0.94*** | 0.65* | −0.23*** | 5.91*** | 5.77*** | −0.06 | −0.04 | 0.00 |
| | 0.29* | 0.7*** | 0.80*** | 0.09 | 4.33*** | 5.04*** | −0.04 | −0.03 | −0.02* |
| | 0.29* | 0.68*** | 0.7* | 0.02 | 4.3*** | 1.83 | −0.04 | −0.04 | −0.01 |
GY: Grain yield, DA: Days to anthesis, ASI: Anthesis silking interval, DS: Days to silking, PH: Plant height, EH: Ear height, EP: Ear per plant, EA: Ear aspect.
Significance at P<0.05; **Significance at P<0.01;
Significance at P<0.001. The underlines mean positive and significance GCA for Grain Yield
3.2.2. GCA under drought and low N conditions
Under drought conditions, lines L1, L2, L3, L4, L5, L14, L15, L18, L20, and L25, together with testers T2, T3, T5, T6, and T7 showed a positive GCA for grain yield (GY) [Table 5], indicating their potential for drought tolerance. These lines and testers are promising germplasm to breed for drought tolerance, highlighting the presence of effective physiological mechanisms. These mechanisms could include traits such as deep root systems and efficient photosynthetic processes that promote optimal water uptake to maintain productivity during drought periods [6]. Similar observations have been reported by several authors [7,26]. Conversely, some lines (L19, L22, L23, L24, L26, L27, L31, and L32) and testers (T1, T4, T8, T9, and T10) showed negative GCA for GY, suggesting their limited usefulness to breed for drought tolerance.
Table 5: General combining ability (GCA) of lines and testers under drought conditions.
| Line | GY | DA | DS | ASI | EH | PH | EA | EP |
|---|---|---|---|---|---|---|---|---|
| 0.14 | 1.45*** | 1.02* | −0.45 | 0.61 | 0.69 | −0.03 | 0.04 | |
| 0.19 | 0.27 | −0.65 | −0.64* | 9.18*** | 7.46* | 0.15 | 0.00 | |
| L3 | 0.25 | 0.11 | −0.38 | −0.35 | −4.27 | −5.09* | −0.08 | −0.01 |
| 0.31* | −0.11 | 0.09 | 0.30 | 0.65 | 2.10 | −0.16 | 0.01 | |
| 0.25 | 0.80* | 0.74 | −0.03 | 1.38 | −1.98 | 0.03 | −0.02 | |
| L6 | 0.00 | 1.01*** | 1.05* | 0.05 | 1.63 | 6.75* | 0.12 | −0.01 |
| L7 | −0.03 | 1.74*** | 1.42* | −0.07 | −0.55 | −9.68*** | 0.03 | −0.05 |
| L8 | 0.02 | 1.07*** | 0.51 | −0.44 | −1.38 | −6.85* | 0.21* | −0.02 |
| L9 | 0.08 | 0.82* | 0.46 | −0.43 | 2.03 | 0.12 | −0.05 | 0.00 |
| L10 | 0.02 | 0.24 | 0.27 | 0.06 | 8.00*** | 4.81* | −0.15* | −0.04 |
| L11 | 0.07 | −0.03 | −0.55 | −0.51 | −5.16* | −1.67 | −0.20* | 0.04 |
| L12 | −0.07 | 1.43*** | 2.32*** | 0.80* | 8.12*** | −1.45 | 0.10 | 0.02 |
| L13 | −0.09 | −2.74*** | −2.31*** | 0.24 | −14.31*** | 11.42*** | −0.02 | 0.01 |
| L14 | 0.14 | −0.34 | −1.18* | −0.84* | 0.76 | 4.02 | −0.35*** | 0.05 |
| L15 | 0.11 | −1.59*** | −1.72*** | −0.25 | −2.97 | 0.33 | 0.06 | 0.07* |
| L16 | 0.05 | −0.34 | −0.36 | 0.01 | −2.03 | 0.12 | −0.28* | 0.04 |
| L17 | 0.05 | 0.74* | −0.54 | 0.20 | 0.24 | −0.33 | −0.10 | 0.02 |
| 0.29* | −0.16 | −0.48 | −0.31 | 1.44 | 5.03* | −0.10 | 0.03 | |
| L19 | −0.18 | 0.66* | 1.31*** | 0.61* | 5.46* | 3.34 | 0.05 | −0.06* |
| 0.34* | −0.21 | −0.71 | −0.49 | 8.9*** | 2.34 | −0.4*** | 0.06 | |
| L21 | −0.02 | −1.48*** | −1.09* | 0.37 | −7.59*** | 1.14 | 0.11 | −0.01 |
| L22 | −0.15 | −0.43 | −0.26 | 0.10 | 1.05 | 1.93 | 0.09 | 0.00 |
| L23 | −0.28 | −0.79* | 0.02 | 0.57* | −1.93 | −0.11 | 0.14 | −0.05 |
| L24 | −0.23 | 0.62 | 1.34*** | 0.72* | −7.1*** | −6.78* | 0.13 | −0.01 |
| 0.30* | 0.21 | −0.57 | −0.65* | −0.38 | 4.94* | −0.01 | 0.07* | |
| L26 | −0.26 | −0.55 | −0.92* | −0.34 | 3.24 | 3.27 | 0.12 | −0.06 |
| L27 | −0.19 | −0.03 | −0.23 | −0.18 | 2.89 | 3.77 | 0.08 | 0.00 |
| L28 | −0.05 | −0.23 | −0.07 | 0.13 | 3.27 | 0.99 | 0.01 | −0.03 |
| L29 | 0.01 | −0.12 | −0.06 | −0.03 | 4.16* | 6.88* | 0.09 | −0.01 |
| L30 | 0.00 | −0.16 | −0.77 | −0.48 | 2.98 | −1.10 | −0.01 | 0.05 |
| L31 | −0.41* | −0.08 | 0.80 | 0.80* | −7.66*** | −3.22 | 0.17 | −0.03 |
| L32 | −0.65*** | −0.30 | 1.50*** | 1.52*** | −10.70*** | −10.34*** | 0.26* | −0.10*** |
| Tester | ||||||||
| T1 | −0.02 | 0.17 | 0.19 | 0.04 | −1.46 | −1.03 | −0.03 | 0.01 |
| T2 | 0.04 | −0.68* | −0.57 | 0.06 | −1.94 | −0.31 | 0.03 | 0.01 |
| T3 | 0.09 | 0.17 | 0.98* | 0.63* | 1.15 | 0.79 | −0.02 | 0.03 |
| T4 | −0.01 | −0.28 | −0.86* | −0.41* | −5.02*** | −1.01 | 0.05 | 0.01 |
| T5 | 0.04 | −0.86*** | −1.3*** | −0.35 | −2.76* | −1.11 | −0.05 | 0.04 |
| T6 | 0.02 | −0.45* | −0.71* | −0.14 | 0.14 | 0.49 | −0.02 | 0.01 |
| T7 | 0.08 | 0.71* | 1.04* | 0.20 | 1.64 | −0.86 | −0.02 | 0.00 |
| T8 | −0.04 | 0.72* | 0.47 | −0.26 | 4.46* | 1.69 | −0.02 | −0.02 |
| T9 | −0.09 | 0.15 | 0.15 | 0.00 | 0.55 | 1.58 | 0.02 | −0.05* |
| T10 | −0.11 | 0.34 | 0.62* | 0.24 | 3.23* | −0.23 | 0.06 | −0.04 |
GY: Grain yield, DA: Days to anthesis, ASI: Interval between anthesis and silking, DS: Days to silking, PH: Plant height, EH: Ear height, EP: Ear per plant, EA: Ear aspect,
Significance at P<0.05; **Significance at P<0.01;
Significance at P<0.001. The underlines mean positive and significance GCA for Grain Yield
Under suboptimal soil nitrogen conditions, lines such as L1, L2, L6, L8, L9, L10, L12, L18, L20, L25, and L31, together with testers T5 and T2, showed positive GCA for GY [Table 6]. These lines and testers had tolerance to suboptimal soil nitrogen [25]. In addition, the positive GCA for PH in lines L2, L6, L18, L20, L22, L25, and L31 indicates the ability to maintain optimal PH under suboptimal soil nitrogen application. Suboptimal soil nitrogen has a direct effect on PH due to the essential role of nitrogen in growth [27]. Optimal PH under suboptimal soil nitrogen conditions indicates efficient nitrogen uptake and use, which is essential for maintaining productivity in nitrogen-limited environments. Similar results have been reported by many authors when assessing the combining ability of new maize lines under low soil nitrogen [25,28]. Conversely, lines (L13, L14, L15, L21, and L32) showed negative GCA for GY under low soil nitrogen, suggesting that they are not well adapted to nitrogen deficiency. On the other hand, the identification of specific inbred lines (L2, L6, L10, L18, L20, L25, and L31) and testers (T2, T5, T9, and T10) with consistently positive GCA under the three growing conditions has important implications for breeding programs [10,29]. These lines and testers may possess genetic traits associated with efficient photosynthesis, adaptive root systems, and nitrogen use efficiency, making them valuable germplasm for the development of resilient and high-performing maize varieties.
Table 6: General combining ability (GCA) of lines and testers under suboptimal soil nitrogen conditions.
| Line | GY | DA | DS | ASI | EH | PH | EA | EP |
|---|---|---|---|---|---|---|---|---|
| 0.36* | 1.06*** | 0.47 | −0.45 | −2.30 | 3.32 | −0.14* | 0.02 | |
| 0.42* | 0.15 | −0.66 | −0.77* | 8.29*** | 11.58*** | −0.02 | 0.05 | |
| L3 | −0.11 | 0.00 | 0.41 | 0.40 | −2.35 | −3.35 | 0.01 | 0.01 |
| L4 | 0.00 | −0.19 | 0.40 | 0.52 | −0.85 | 1.11 | 0.03 | −0.04 |
| L5 | −0.04 | 0.62* | 0.86* | 0.23 | −0.75 | −1.76 | 0.03 | −0.04 |
| L6 | 0.27 | 1.79*** | 1.07* | −0.54 | 1.12 | 6.64* | −0.08 | 0.02 |
| L7 | −0.01 | 0.33 | 0.18 | −0.06 | −7.51*** | −9*** | −0.01 | 0.01 |
| L8 | 0.16 | 0.10 | −0.70 | −0.65* | 0.86 | −4.34 | 0.07 | 0.01 |
| L9 | 0.16 | 0.71* | −0.59 | −1.18*** | 2.21 | 4.73 | 0.03 | 0.03 |
| L10 | −0.08 | 0.84*** | 0.88* | 0.09 | 8.95*** | 6.56* | 0.04 | −0.01 |
| L11 | 0.09 | 0.23 | 0.37 | 0.05 | −1.93 | 4.00 | −0.05 | 0.04 |
| L12 | 0.05 | 1.21*** | 1.27* | 0.17 | 5.44*** | 0.89 | −0.02 | 0.04 |
| L13 | −0.09 | −4.3*** | −3.76*** | 0.04 | −13.21*** | −9.62* | 0.03 | −0.02 |
| L14 | 0.05 | −0.51 | −1.44*** | −0.86*** | 5.42*** | 9.02*** | −0.14* | 0.04 |
| L15 | 0.05 | −1.67*** | −1.84*** | −0.09 | −2.75 | 5.40 | −0.01 | 0.05 |
| L16 | 0.05 | 0.75* | −0.92* | −0.26 | −0.56 | −2.35 | −0.11 | 0.02 |
| L17 | 0.07 | −0.70* | −0.83* | −0.16 | 2.77 | −0.03 | −0.11 | 0.03 |
| L18 | 0.02 | 0.02 | −0.18 | −0.21 | 4.08* | 5.71* | 0.03 | 0.04 |
| L19 | −0.07 | 1.37*** | 1.28* | −0.01 | 4.35* | 2.02 | −0.08 | −0.02 |
| 0.47*** | 0.74* | −1.44*** | −0.78* | 11.55*** | 3.45 | −0.14* | 0.01 | |
| L21 | −0.26 | −0.42 | 0.78 | 1.12*** | −6.5*** | −6.47* | 0.00 | 0.02 |
| L22 | −0.19 | −0.18 | 0.24 | 0.33 | 1.56 | 5.19* | 0.03 | 0.00 |
| L23 | −0.30 | −0.10 | 0.5 | 0.56* | 1.47 | 2.12 | 0.06 | 0.00 |
| L24 | −0.12 | 0.40 | 0.42 | −0.05 | −2.93 | −4.41 | 0.06 | −0.02 |
| L25 | 0.19 | 0.60* | −0.33 | −0.7* | 2.6 | 2.11 | 0.04 | 0.00 |
| L26 | −0.36* | 0.02 | 0.57 | 0.48 | −1.94 | −7.22* | 0.09 | −0.04 |
| L27 | −0.16 | 0.38 | 0.60 | 0.27 | −0.38 | −4.35 | 0.11 | −0.01 |
| L28 | 0.02 | −0.87* | −0.41 | 0.36 | 1.45 | 1.40 | 0.01 | −0.01 |
| L29 | 0.16 | −0.01 | 0.32 | 0.30 | 2.10 | 0.38 | 0.06 | −0.05 |
| L30 | 0.15 | −0.51 | −0.57 | −0.02 | −0.83 | −3.75 | 0.03 | 0.03 |
| L31 | −0.6*** | 0.60* | 1.86*** | 1.21*** | −9.3*** | 10.44*** | 0.15* | −0.14*** |
| L32 | −0.36* | 0.51 | 1.19* | 0.68* | −10.15*** | 8.54*** | 0.03 | 0.08* |
| Tester | ||||||||
| T1 | −0.02 | 0.41* | 0.22 | −0.17 | −1.12 | −0.56 | −0.02 | 0.04 |
| T2 | 0.11 | −0.7* | −1.10*** | −0.36* | −0.67 | 2.2 | −0.01 | 0.04 |
| T3 | −0.05 | 0.41 | 1.19*** | 0.72*** | 0.58 | −1.33 | 0.03 | −0.02 |
| T4 | −0.11 | 0.26 | 0.29 | 0.04 | −2.58* | −2.76 | 0.04 | −0.06* |
| T5 | 0.22* | −1.41*** | −2.03*** | 0.54* | −1.55 | −1.27 | −0.05 | 0.06* |
| T6 | 0.05 | −0.14* | −0.31 | −0.17 | 0.50 | 2.71 | 0.00 | −0.01 |
| T7 | 0.00 | −0.09 | 0.21 | 0.23 | −0.46 | −3.81 | −0.01 | 0.01 |
| T8 | −0.03 | 0.67* | 0.75* | 0.01 | 1.99* | 4.49* | 0.00 | −0.01 |
| T9 | −0.06 | 0.08 | 0.18 | 0.14 | 2.29* | 2.05 | 0.01 | −0.04* |
| T10 | −0.10 | 0.50* | 0.61* | 0.09 | 1.03 | −1.72 | 0.00 | 0.00 |
GY: Grain yield, DA: Days to anthesis, ASI: Interval between anthesis and silking, DS: Days to silking, PH: Plant height, EH: Ear height, EP: Ear per plant, EA: Ear aspect;
Significance at P<0.05; **Significance at P<0.01;
Significance at P<0.001. The underlines mean positive and significance GCA for Grain Yield
3.3. SCA and Variance Components
The heat map showed several combinations with high positive SCA effects for grain yield (GY) in each condition [Figure 1], indicating high yield potential [30]. These combinations include L1 × T2, L24 × T2, L5 × T3, L30 × T8, L22 × T10, and L10 × T10 under optimal conditions; L9 × T9, L5 × T7, L6 × T5, L32 × T6, L29 × T4, and L20 × T10 under suboptimal soil nitrogen conditions; and L2 × T5, L4 × T7, L5 × T8, and L1 × T2 under drought conditions. These crosses showed favorable alleles interacting synergistically to increase GY in some environments. Indeed, SCA measures the non-additive gene effects, such as dominance and epistasis, that result from the interaction between parental genes in test-crosses [10,15]. SCA is important for selecting hybrids that show hybrid vigor [31]. The SCA effects can vary depending on environmental conditions and the traits of interest [30,32]. However, SCA effects for grain yield were relatively low under drought compared to optimal and low soil nitrogen conditions, suggesting that additive gene action is more important for yield (GY) under DS [7,19].
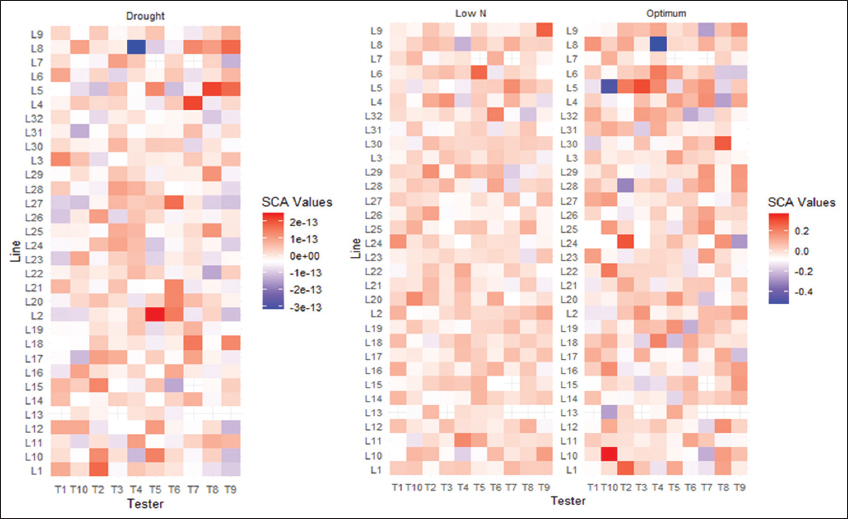 | Figure 1: Specific combining ability estimates of line-by-tester combinations for grain yield under optimal, drought, and low N management conditions. [Click here to view] |
The heat map reveals that, under drought and low soil nitrogen, most line-by-tester crosses had negative SCA effects for days to anthesis (DA) [Figure 2]. This result indicates that additive gene action is more significant than non-additive effects for flowering under drought and low soil nitrogen. In addition, the proportion of GCA and SCA variance [Figure 3] confirms high additive variance and low non-additive variance for DA and DS across all growing conditions, suggesting these traits are controlled by multiple genes. Similarly, PH showed the highest non-additive variance under drought, decreasing under optimal and suboptimal soil nitrogen conditions. EA and EH also exhibited high additive variance consistently, with increased non-additive variance under low soil nitrogen and optimal conditions. Ertiro et al. [7] reported similar results when evaluating the combining ability of drought-tolerant maize inbred lines under optimal, drought, and low soil nitrogen conditions in Kenya. These findings highlight that traits are controlled by complex genetic interactions, emphasizing the importance of breeding strategies that consider specific genetic architectures and their responses to different environmental conditions.
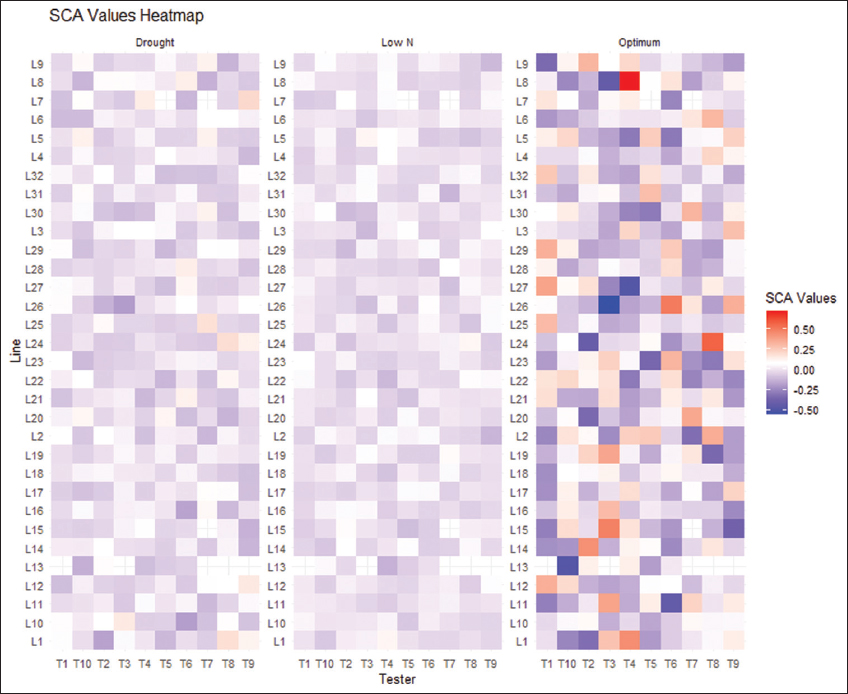 | Figure 2: Specific combining ability estimates of line-by-tester combinations for days to anthesis under optimal, drought, and suboptimal soil nitrogen conditions. [Click here to view] |
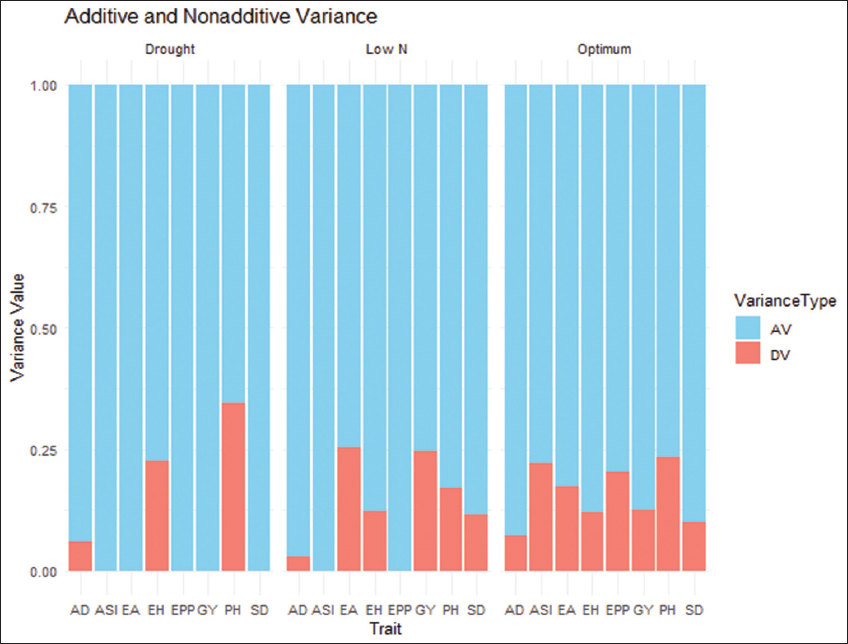 | Figure 3: Proportion of additive (lower bar) and non-additive (upper bar) genetic variance for study parameters. [Click here to view] |
4. CONCLUSION
The current study has been carried out to assess the combining ability of lines and testers developed at CIMMYT under optimal, drought, and low soil nitrogen conditions. The analysis of variance showed significant differences among lines, testers, and line-by-tester interactions for most measured parameters across all three environmental conditions. The best lines and testers with positive GCA effects across stressful and optimal growing conditions have the potential to develop productive hybrids. Furthermore, the SCA effects for grain yield were relatively low under drought conditions compared to optimal and low soil nitrogen conditions, suggesting that the general performance of the parents is more critical for grain yield under DS. However, strong and positive SCA effects for grain yield were observed in specific combinations, such as L1 × T2 and L5 × T3 under optimal conditions, and L9 × T9 and L32 × T6 under suboptimal soil nitrogen conditions. In addition, there is a variation in the GCA and SCA variance ratios for flowering and plant morphology parameters. This underscores the complexity of maize trait expression and the need for targeted breeding strategies to address environmental challenges. Lines and testers with consistently positive combining ability represent valuable genetic resources for developing maize varieties that are resilient to pedoclimatic stresses.
5. AUTHORS’ CONTRIBUTIONS
All authors made substantial contributions to conception and design, acquisition of data, or analysis and interpretation of data; took part in drafting the article or revising it critically for important intellectual content; agreed to submit to the current journal; gave final approval of the version to be published; and agreed to be accountable for all aspects of the work. All the authors are eligible to be authors as per the International Committee of Medical Journal Editors (ICMJE) requirements/guidelines.
6. ACKNOWLEDGMENTS
This research was conducted as part of the first author’s Ph.D. at the University Joseph Ki-Zerbo, with support from CIMMYT–Kenya and the Plant Biotechnology and Breeding network (Plant B+B) coordinated by VIB-International Plant Biotechnology Outreach at Ghent University. The authors gratefully acknowledge the institutional, technical, and training support provided by the University Joseph Ki-Zerbo, CIMMYT–Kenya and Plant B+B, which contributed significantly to the success of this work.
7. CONFLICTS OF INTEREST
The authors report no financial or any other conflicts of interest in this work.
8. ETHICAL APPROVALS
This study did not involve any human participants or animals; therefore, ethical approval was not required. Field experiments were conducted according to national guidelines and institutional regulations governing agricultural research and biosafety.
9. DATA AVAILABILITY
The datasets generated and/or analyzed during the current study are available from the corresponding author upon reasonable request.
10. Publisher’s Note
All claims expressed in this article are solely those of the authors and do not necessarily represent those of the publisher, the editors and the reviewers. This journal remains neutral with regard to jurisdictional claims in published institutional affiliation.
11. Use of artificial intelligence (AI)-assisted technology
The authors declare that they have not used artificial intelligence (AI)-tools for writing and editing of the manuscript, and no images were manipulated using AI.
REFERENCES
1. Badu-Apraku B, Fakorede MA. Advances in Genetic Enhancement of Early and Extra-Early Maize for Sub-Saharan Africa. Cham:Springer International Publishing;2017.[CrossRef]
2. Faostat;2023. Available: https://www.fao.org/faostat/en/#data/QCL
3. Kaminski J, Elbehri A, Zoma JB. Analyse De La Filière Du Maïs Et CompétitivitéAu Burkina Faso:Politiques Et Initiatives D'Intégration Des Petits Producteurs Au Marché?.Burkina Faso:Elbehri Ed Faofida;2013.
4. Meseka S, Menkir A, Bossey B, Mengesha W. Performance assessment of drought tolerant maize hybrids under combined drought and heat stress. Agronomy (Basel). 2018;8:274.[CrossRef]
5. Ramazan S, Nazir I, Yousuf W, John R. Environmental stress tolerance in maize (Zea mays):Role of polyamine metabolism. Funct Plant Biol. 2022;50(2):85-96.[CrossRef]
6. Kondwakwenda A, Sibiya J, Zengeni R, Musvosvi C. Aspects in breeding maize for drought tolerance:Progress and modern breeding approaches. Aust J Crop Sci. 2021;15(4):510-7. [CrossRef]
7. Ertiro BE, Beyene Y, Das B, Mugo S, Olsen M, Oikeh S, et al. Combining ability and testcross performance of drought-tolerant maize inbred lines under stress and non-stress environments in Kenya. Plant Breed. 2017;136(2):197-205. [CrossRef]
8. Amegbor IK, Abe A, Adjebeng DJ, Adu GB, Oteng FR. Agronomic performance and combining ability estimates of yellow maize inbred lines under adequate and deficit moisture conditions. J Crop Sci Biotechnol. 2022;25:183-97. [CrossRef]
9. Gallais A. Hétérosis Et Variétés Hybrides En Amélioration Des Plantes. France:Éditions Quæ;2009.
10. Hallauer JB, Carena MJ, Miranda FJ. Quantitative Genetics in Maize Breeding. Germany:Springer Science and Business Media;2010.[CrossRef]
11. Mosa HE, Hassan MA, Galal YA, Rizk MS, El-Mouslhy TT. Combining ability of elite maize inbred lines for grain yield, resistance to both late wilt and northern leaf blight diseases under different environments. Egypt J Plant Breed. 2023;27(2):269-87.
12. Sibiya J, Tongoona P, Derera J. Combining ability and GGE biplot analyses for resistance to northern leaf blight in tropical and subtropical elite maize inbred lines. Euphytica. 2013;191(2):245-57. [CrossRef]
13. Makumbi D, Assanga S, Diallo A, Magorokosho C, Asea G, Worku M, et al. Genetic analysis of tropical midaltitude-adapted maize populations under stress and nonstress conditions. Crop Sci. 2018;58(4):1492-507. [CrossRef]
14. Matongera N, Ndhlela T, Biljon AV, Kamutando CN, Labuschagne M. Combining ability and testcross performance of multi-nutrient maize under stress and non-stress environments. Front Plant Sci. 2023;14:1070302.[CrossRef]
15. Fasahat P, Rajabi A, Rad M, Derera J. Principles and utilization of combining ability in plant breeding. Biom Biostat Int J. 2016;4(1):1-22. [CrossRef]
16. Beyene Y, Mugo S, Semagn K, Asea G, Trevisan W, Tarekegne A, et al. Genetic distance among doubled haploid maize lines and their testcross performance under drought stress and non-stress conditions. Euphytica. 2013;192(3):379-92. [CrossRef]
17. Rodríguez FG, Alvarado RÁ, Pacheco G, Crossa J, Burgueño J. AGD-R (Analysis of Genetic Designs with R for Windows) Version 5.0.“CIMMYT Research Data and Software Repository Network;2015. Available from: https://data.cimmyt.org/dataset.xhtml?persistentid=hdl:11529/10202 [Last accessed on 2024 Sep 07].
18. Kempthorne O. An Introduction to Genetic Statistics. Oxford, England:Wiley;1957.
19. Rukundo P, Shimelis H, Laing M, Gahakwa D. Combining ability, maternal effects, and heritability of drought tolerance, yield and yield components in sweetpotato. Front Plant Sci. 2017;7:1981. [CrossRef]
20. Annor B, Badu-Apraku B, Nyadanu D, Akromah R, Fakorede MA. Testcross performance and combining ability of early maturing maize inbreeds under multiple-stress environments. Sci Rep. 2019;9(1):13809. [CrossRef]
21. Belay N. Combining ability studies from line x tester mating design for grain yield and its related traits of mid-altitude maize inbred lines. Int J Food Sci Agric. 2022;6(1):64-75.[CrossRef]
22. Chandel U, Mankotia BS, Thakur KS. Evaluation of CIMMYT maize (Zea mays L.) by tropical inbred testers. Bangladesh J Bot. 2015;43(2):131-9. [CrossRef]
23. Oluwaseun O, Badu-Apraku B, Adebayo M, Abubakar AM. Combining ability and performance of extra-early maturing provitamin a maize inbreds and derived hybrids in multiple environments. Plants (Basel). 2022;11(7):964. [CrossRef]
24. El-Mouhamady AB, Gad AA, Karim GS. Improvement of drought tolerance in rice using line x tester mating design and biochemical molecular markers. Bull Natl Res Cent. 2022;46(1):1. [CrossRef]
25. Ribeiro PF, Badu-Apraku B, Gracen V, Danquah EY, Afriyie-Debrah C, Obeng-Dankwa K, et al. Combining ability and testcross performance of low N tolerant intermediate maize inbred lines under low soil nitrogen and optimal environments. J Agric Sci. 2020;158(5):351-70. [CrossRef]
26. Bänziger M, Edmeades GO, Beck D, Bellon M. From Theory to Practice:Breeding for Drought and Nitrogen Stress Tolerance in Maize. Mexico:CIMMYT;2000.
27. Tollenaar M, Dwyer LM. Physiology of maize. In:Smith DL, Hamel C, editors. Crop Yield. Berlin, Heidelberg:Springer;1999. 169-204.[CrossRef]
28. Makumbi D, Betrán JF, Bänziger M, Ribaut JM. Combining ability, heterosis and genetic diversity in tropical maize (Zea mays L.) stress and non-stress conditions. Euphytica. 2011;180(2):143-62. [CrossRef]
29. Dar ZA, Lone AA, Khuroo NS, Ali G, Abidi I, Ahangar MA, et al. Line x tester analysis in maize (Zea mays L.) various morpho-agronomic traits under temperate conditions. Int J Curr Microbiol Appl Sci. 2017;6(7):1430-7. [CrossRef]
30. Akaogu IC, Badu-Apraku B, Adetimirin VO. Combining ability and performance of extra-early maturing yellow maize inbreds in hybrid combinations under drought and rain-fed conditions. J Agric Sci. 2017;155(10):1520-40. [CrossRef]
31. Zhang X, Lv L, Lv C, Guo B, Xu R. Combining ability of different agronomic traits and yield components in hybrid barley. PLoS One. 2015;10(6):0126828. [CrossRef]
32. Badu-Apraku B, Oyekunle M, Akinwale RO, Aderounmu M. Combining ability and genetic diversity of extra-early white maize inbreds under stress and nonstress environments. Crop Sci. 2013;53(1):9-26.[CrossRef]