1. INTRODUCTION
Okra (Abelmoschus esculentus L.) is one of approximately 200 species of the Malvaceae family, which are derived from the tropical and subtropical regions in the world [1]. The okra fruit is a greenish, fibrous-textured, six-chambered capsule that is 10–30 cm in length and 1–4 cm in diameter [2]. The nutritional content of okra is mostly found in its seeds [3]. With a high dietary fiber content and other bioactive elements, the round white seeds of immature okra fruits are best consumed fresh or quickly frozen [4]. The mature okra seeds (OS) can be ground into a fine powder after roasting for use as additives or components in coffee [5]. High-quality proteins and oils can be found in abundance in OS [6]. According to Benchasr [7], these seeds have an oil content of between 20% and 40% and are primarily made up of unsaturated fatty acids, particularly linoleic acids, which are vital for human nutrition. In addition, the major minerals (K, Na, Mg, and Ca) and essential trace elements (Fe, Zn, Mn, and Ni), which play very important roles in human metabolism, are also present in okra [8].
In addition to nutritional components, fruits and vegetables also contain an essential class of substances known as antioxidants or bioactive compounds that eliminate dangerous free radical intermediates produced during oxidation reactions [9]. DNA, lipids, and proteins are examples of macromolecules oxidized by free radicals, resulting in cell damage and death [10]. Dietary natural antioxidants can counteract their harmful effects. As a result, there is a growing need to find safe and alternative sources of food bioactive compounds, particularly those derived from plants [11]. Arapitsas [12] discovered that the seeds, which made up 17% of the fruit and had a higher concentration of phenolic compounds than the skin, were primarily made up of flavonol derivatives (3.4 mg/g of seeds) and oligomeric catechins (2.5 mg/g of seeds). OS were discovered to have the highest antidiabetic benefits and antioxidant ability when compared to other okra parts because of their higher concentration of phenolics [13].
In particular, 2,2-diphenyl-1-picrylhydrazyl (DPPH) was used to assess the antioxidant activity of OS extracts, and it rose in direct proportion to the extract’s content [14]. Apart from phenolics, okra is abundant in other antioxidants, including β-carotene and Vitamin C [15]. Moreover, since OS have significant physiological benefits in preventing cancer, heart disease, and aging, their antioxidant properties have also steadily gained attention in studies [3].
One of the most significant and traditional methods of food preservation is drying [16]. By removing moisture from raw materials, spoilage microorganisms cannot grow and reproduce, enzyme activity is slowed down, and numerous negative reactions linked to moisture are reduced [17]. Even though drying can successfully increase the shelf life of agricultural products, conventional drying methods inevitably result in a loss of nutritional quality, especially for heat-sensitive bioactive substances [18]. Kinetic studies are often used to describe the mechanism of mass transfer during drying. They are significantly influenced by the drying conditions, where temperature is one of the most crucial variables [19].
Therefore, the objective of this study is to gain a basic understanding of the kinetics of moisture content changes of OS during convection drying at different temperatures and to select the appropriate drying model from among the models implemented. The research also looked into how the drying temperature affected the amount of bioactive compounds and antioxidant potential in OS.
2. MATERIALS AND METHODS
2.1. Preparation of OS
The okra variety “Mai Vang” was grown in a farmer’s garden in Vinh Trung Hamlet, Vinh Trach Commune, Phu Hoa Town, Thoai Son District, and An Giang Province. Okra fruits were harvested at the age of 15 days after fruit formation. In the laboratory, the fruits were washed with tap water, and damaged or defective fruits were removed. Then, the fruits were blanched in hot water at 95°C for 2 min. Thermal blanching is widely used before drying of agro-products. Its main objective is to maintain the color and flavor of products by deactivating the enzymes that cause undesirable darkening and off-flavors. Not only does it soften tissues to facilitate drying and eliminate intracellular air to prevent oxidation, but it also reduces the microbial burden of objects to extend their preservation [20]. Due to the improvement in color and appearance, Sharma et al. found that pre-treatments had an impact on the sensory quality evaluation findings of solar dehydrated okra. The dehydrated raw and blanched samples received mean ratings for overall acceptability of 6.0 and 7.0, respectively. Furthermore, the ascorbic acid level of the dried control and the blanched okra was determined to be 10.0 and 12.5 mg/100 g, respectively [21]. Deng et al. have demonstrated that blanching pre-treatments can effectively improve drying kinetics [20]. Each sample of 500 g okra was placed in a rectangular stainless steel mesh basket (25.5 cm × 10 cm × 6.5 cm) with 0.5 cm square mesh holes and immersed in a thermostatic bath with a material-to-water ratio of 1:4. The blanched fruits were rapidly cooled by immersing them in cold water (10°C) for 60 s to prevent further thermal damage. Okra fruits were then drained and cut in half lengthwise to separate the pod and seeds.
2.2. Experimental Design
The fruit seeds were spread on a stainless steel tray in a single layer and dried at four different temperatures (50°C, 60°C, 70°C, and 80°C) and an air velocity range of 1.0–1.2 m/s by a forced-convection dryer (DKN812, Yamato, Japan). The relative humidity values achieved were 24.2%, 16.3%, 10.6%, and 5.8%, respectively. The wet bulb and dry bulb thermometers were used to measure the temperature and relative humidity at 4-h intervals. The initial moisture content of the seeds was determined to be 74.91 ± 1.12% (on a wet basis) by drying at 105°C to constant weight. The sample weight was determined every 30 min using an analytical balance (JJ200, G&G, China, with an accuracy of 0.01 g) continuously throughout the drying process until a constant weight (equilibrium) was achieved. The seeds were then ground into a fine powder through a 100 μm sieve, contained in vacuum-sealed PA packaging, and stored at −18°C until analysis.
2.3. Modeling
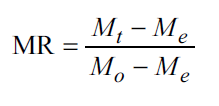
The moisture ratio (MR) of OS during forced-convection drying was calculated using equation 1 [22]. Where Mo, Mt, and Me are the initial moisture content, the moisture content at drying time of t, and the equilibrium moisture content, respectively. The equilibrium moisture content is the final moisture content for each drying temperature, and all values are in kg water/kg dry matter. The equilibrium moisture content of seeds was obtained experimentally. The seeds were exposed to the investigated drying temperatures until their mass was considered constant over three consecutive measurements taken at 30-min intervals.
Eight common drying models [Table 1] were fitted to select the best model describing the OS drying curve.
Table 1: Typical drying curve models provided by several authors.
| No. | Model | Equation | References |
|---|---|---|---|
| 1 | Lewis | MR=exp(−kt) | [23] |
| 2 | Page | MR=exp(−ktn) | [24] |
| 3 | Modified Page | MR=exp[(−kt) n] | [25] |
| 4 | Henderson and Pabis | MR=a exp(−kt) | [26] |
| 5 | Logarit | MR=a exp(−kt) + c | [27] |
| 6 | Two-term | MR=a exp(−kot) + b exp(−k1t) | [28] |
| 7 | Two-term exponential | MR=a exp(−kt) + (1−a) exp(−kat) | [29] |
| 8 | Modified Henderson and Pabis | MR=a exp(−kt) + (1−a) exp(−kbt) | [30] |
k, ko, k1 are the drying rate constants; n, a, b are the model coefficients.
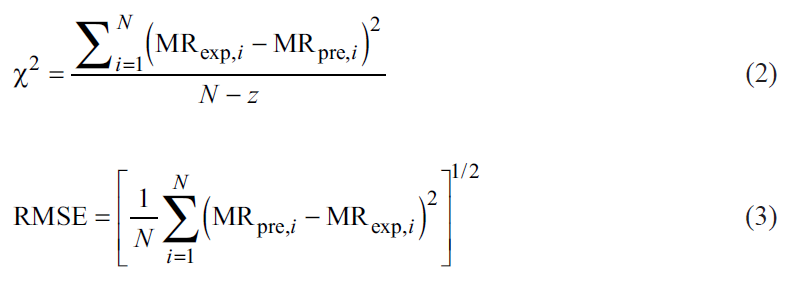
The drying rate constants and the model coefficients were determined by non-linear regression analysis using Statgraphics Centurion XV software (U.S.A., Version XV.I) [31]. The coefficient of determination (R2) is an important criterion for selecting the best model to describe the drying curve. In addition, the value of χ2, which is the mean square of the deviation between the experimental value and the calculated value, and the value of the root mean square error (RMSE) were also used to determine the goodness of fit of the model. The higher the value of R2 and the lower the value of χ2 and RMSE, the better the goodness of fit [32].
The values of χ2 and RMSE were calculated according to equations 3 and 4 [32]. Where N is the number of experimental points, z is the number of model parameters, MRexp and MRpre are the experimental and predicted MR ratios, respectively.
2.4. Calculation of Effective Moisture Diffusion and Activation Energy
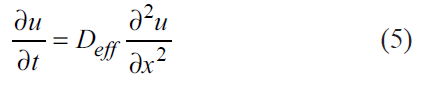
The effective moisture diffusion of OS was estimated using the Fick diffusion model (equation 5) while accounting for shrinkage [33]. Where Deff is the diffusion coefficient (m2/s), u is the concentration (mol/m3), t is the drying time (s), and x is the diffusion length (m).
In the case of drying a spherical product, assuming unidirectional moisture migration with constant diffusion throughout the fruit, uniform initial moisture distribution, constant fruit surface concentration, and centre-directed shrinkage of the OS during drying, this law can be developed in the form of equation 6 proposed by Crank [34].
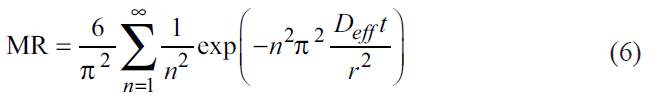
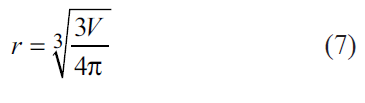
Where n is a positive integer, r is the seed radius, which can be expressed by formula 7 [35]. During drying, the average radius of the OS at each time interval (0.5 h) was determined to account for shrinking.
When the drying time is long (n = 1), equation 6 can be simplified by taking the logarithm of both sides to form a straight line equation (8) [36].
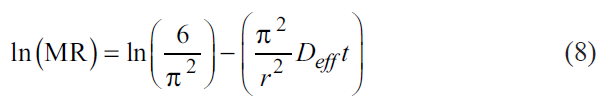
The effective moisture diffusion was determined by plotting the experimental ln(MR) against (t/R2) because the graph gives a straight line with a slope according to equation 9 [37].

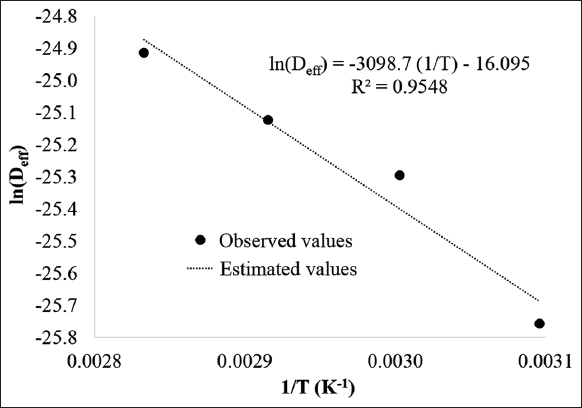
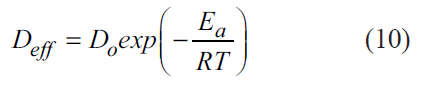
The activation energy was computed based on the Arrhenius equation (10), which represents how temperature affects effective moisture diffusivity [20]. Where Ea is the activation energy (kJ/mol), Do is the Arrhenius factor (pre-exponential factor, Do is equivalent to the diffusion at infinitely high temperature) (m2/s), R is the ideal gas constant (R = 8.314 J/mol.K), and T is the absolute temperature (K).
2.5. Determination of Bioactive Compounds Content and Antioxidant Activity
The bioactive compounds content and antioxidant activity of the OS powder were analyzed according to the previous references. Chlorophyll content was calculated using the equation of Trang et al. [38] after the powder was extracted in a solvent mixture of acetone: NH4OH (9/1, v/v) at 25–30°C for 24 h and then measured on a Ultraviolet-Vis colorimeter (SPUVS, SP-1920, Japan) at wavelengths of 663 nm and 645 nm. The amount of β-carotene was determined by measuring the absorbance at 449 nm after extraction in an acetone solvent for 15 min at 4 ± 1°C [39]. The 2,4-dinitrophenylhydrazine method was chosen to measure the content of Vitamin C [40]. The total phenolic content of the methanol extracts was determined using the Folin–Ciocalteu reagent [41]. The antioxidant activity of OS powder, presented through the free radical scavenging activity of methanol extracts, was determined by the DPPH method [3].
2.6. Data Analysis
The experiment was performed with three replicates, and the data were presented as the mean value and standard deviation. Microsoft Excel software was used to graph the data. Portable Statgraphics Centurion XV software (U.S.A., Version XV.I) was used for statistical analysis using one-way analysis of variance (ANOVA) and the least significant difference (LSD) test to determine whether the treatment means differed significantly at 95% confidence (P = 0.05).
3. RESULTS AND DISCUSSION
3.1. Effect of Temperature on Moisture Change over Drying Time
The convection drying process altered the moisture content of the OS [Figure 1]. Although it was demonstrated that the moisture content decreased steadily over the drying process, the high free moisture content in the raw material [42] causes the rate of moisture loss to occur quickly in the early stages of the drying process, after which the drying rate progressively drops. Because heat and mass transfer processes are faster when the drying temperature is gradually raised [43], the time needed to dry OS samples from the initial moisture content to the equilibrium value was reduced. In particular, the OS had an initial wet basis moisture content of 74.91 ± 1.06%; this number steadily drops throughout the drying process, reaching equilibrium at 6.30% moisture after 11 h of drying at 50°C. Meanwhile, at higher temperatures (60°C, 70°C, and 80°C), the drying time was reduced to 8 h, 6.5 h, and 5.5 h, respectively, to achieve equilibrium moisture. It was clear that the drying temperature affected the drying time.
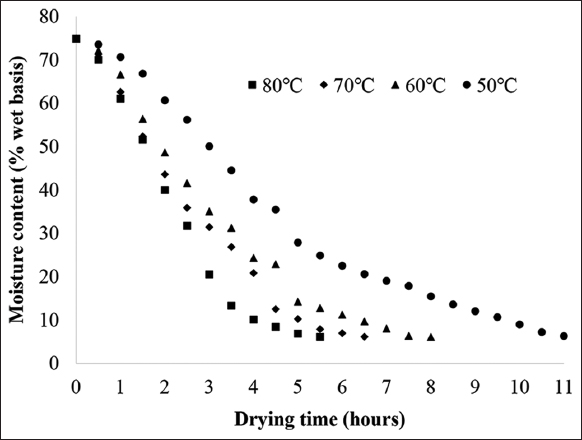 | Figure 1: Changes in moisture content over drying time. [Click here to view] |
Temperature plays a vital role in the drying process by providing the energy needed to evaporate water from the food. Therefore, higher temperatures increase the rate of heat transfer to the food, causing moisture to evaporate more quickly and leading to a shorter drying time. Furthermore, the quantity of water vapor in the air relative to the greatest amount the air can contain at a specific temperature is known as relative humidity. It is a critical factor in determining the driving force for moisture removal. The higher the drying temperature, the lower the relative humidity achieved. The drying process relies on a vapor pressure difference between the moisture inside the food and the surrounding air. When the relative humidity of the air is low, the air is “drier” and has a greater capacity to absorb moisture, which creates a larger vapor pressure gradient, accelerating the rate at which water evaporates from the surface of food into the air.
This trend also occurred similarly when drying horizontal cut or vertical cut okra using hot air and heat pump drying methods [22]. The drying time for OS was longer than that of other seeds, including pumpkin seeds (4.0 h), noni seeds (2.3 h), and niger seeds (0.9 h), but shorter than that of pomegranate seeds (10.8 h) at the same drying temperature of 60°C [44-47]. These results are from variations in initial moisture content, dimensions, structure, raw material pre-treatment methods, and drying conditions.
3.2. Drying Modeling
The appropriateness of the moisture content data over the drying time to eight popular drying models [Table 1] was then evaluated. The findings of the statistical analysis were displayed in Table 2. All of the R2 values were higher than 0.98, suggesting that all of the models fit well. The suitability of the model was also assessed based on the χ2 and RMSE values. In general, the R2, χ2, and RMSE values ranged from 0.9806 to 0.9995, 0.0000567 to 0.0019202, and 0.0075356 to 0.0459555, respectively. The calculation results indicated that the Page model provided a better fit than other models at all drying temperatures, with R2 > 0.995, χ2 < 0.0006, and RMSE < 0.03. The graph in Figure 2 demonstrates the fit between the Page model and the experimental results at temperatures of 50°C, 60°C, 70°C, and 80°C. The reliability of the Page model was also assessed by comparing the calculated MR at different drying temperatures with the values obtained from the experimental data. The data values fluctuated close to a straight line with a 45°C slope, according to the results of the linear regression analysis. These findings indicated that the Page model was appropriate for explaining the convection drying process of OS, as evidenced by the data obtained at 80°C, which had an R2 value of 0.9996. Similarly, the R2 values at the remaining temperatures (50°C, 60°C, and 70°C) were 0.9976, 0.9955, and 0.9957, respectively [Figure 3]. Silva et al. [46] used forced air flow to dry niger seeds at 40–80°C. They then compared mathematical models to the experimental data and found that the Page model best described the data, with an R2 value fluctuating between 0.98 and 0.99. When evaluating the drying kinetics of pumpkin seeds at 40–70°C in an oven with forced air circulation, de Oliveira et al. [44] also found that the same model worked well with R2 values ranging from 0.9942 to 0.9969. In comparison to the drying of niger seeds and pumpkin seeds, the R2 values derived from the Page model for OS were greater, further confirming that this model works particularly well for OS compared to some other seeds. The Page model is almost the empirical model equation that has been used most frequently in the investigation of water migration during drying. Page has been known to be successful at fitting the diffusion phenomena, which could be one explanation. In addition, by including the variable “n” in the empirical equation, the Page model makes up for the deficiency of the exponential model [48].
Table 2: Results of statistical analysis for the fitness of models to the drying data.
| Model | Drying temperature (°C) | Model coefficients | Model constants | R2 | χ2 | RMSE | ||
|---|---|---|---|---|---|---|---|---|
| Lewis | 50 | k=0.3687 | 0.9806 | 0.0019202 | 0.0438162 | |||
| 60 | k=0.5577 | 0.9850 | 0.0015033 | 0.0387787 | ||||
| 70 | k=0.6568 | 0.9882 | 0.0012269 | 0.0350317 | ||||
| 80 | k=0.7434 | 0.9868 | 0.0015020 | 0.0387451 | ||||
| Page | 50 | n=1.3253 | k=0.2536 | 0.9972 | 0.0002863 | 0.0169243 | ||
| 60 | n=1.2565 | k=0.4603 | 0.9952 | 0.0005084 | 0.0225596 | |||
| 70 | n=1.2105 | k=0.5792 | 0.9956 | 0.0004998 | 0.0223700 | |||
| 80 | n=1.2970 | k=0.6404 | 0.9995 | 0.0000567 | 0.0075356 | |||
| ModifiedPage | 50 | n=1.2055 | k=0.2898 | 0.9885 | 0.0012091 | 0.0344350 | ||
| 60 | n=1.2139 | k=0.5430 | 0.9849 | 0.0015037 | 0.0390121 | |||
| 70 | n=1.1493 | k=0.5879 | 0.9861 | 0.0013872 | 0.0361892 | |||
| 80 | n=1.3183 | k=0.7078 | 0.9828 | 0.0017576 | 0.0421383 | |||
| Henderson and Pabis | 50 | a=1.0937 | k=0.4004 | 0.9884 | 0.0012035 | 0.0346882 | ||
| 60 | a=1.0658 | k=0.5911 | 0.9891 | 0.0011675 | 0.0341766 | |||
| 70 | a=1.0505 | k=0.6870 | 0.9908 | 0.0010345 | 0.0321703 | |||
| 80 | a=1.0492 | k=0.7750 | 0.9894 | 0.0013308 | 0.0364700 | |||
| Logarithmic | 50 | a=1.1093 | c=−0.0282 | k=0.3702 | 0.9902 | 0.0010672 | 0.0326653 | |
| 60 | a=1.0790 | c=−0.0219 | k=0.5550 | 0.9904 | 0.0011020 | 0.0332039 | ||
| 70 | a=1.0664 | c=−0.0249 | k=0.6398 | 0.9923 | 0.0009492 | 0.0308181 | ||
| 80 | a=1.0853 | c=−0.0507 | k=0.6775 | 0.9943 | 0.0007912 | 0.0281211 | ||
| Two-term | 50 | a=0.5469 | b=0.5469 | ko=0.4004 | k1=0.4004 | 0.9884 | 0.0013302 | 0.0364682 |
| 60 | a=0.5330 | b=0.5330 | ko=0.5908 | k1=0.5915 | 0.9891 | 0.0013471 | 0.0367116 | |
| 70 | a=0.5328 | b=0.5328 | ko=0.6208 | k1=0.6208 | 0.9844 | 0.0019503 | 0.0401078 | |
| 80 | a=0.5051 | b=0.5051 | ko=0.7303 | k1=0.7303 | 0.9902 | 0.0014027 | 0.0328083 | |
| Two-term exponential | 50 | a=0.9926 | k=0.3689 | 0.9806 | 0.0020116 | 0.0448474 | ||
| 60 | a=0.9872 | k=0.5581 | 0.9850 | 0.0016036 | 0.0400508 | |||
| 70 | a=0.9881 | k=0.6571 | 0.9882 | 0.0013291 | 0.0364623 | |||
| 80 | a=0.9943 | k=0.7438 | 0.9868 | 0.0016522 | 0.0406363 | |||
| Modified Henderson and Pabis | 50 | a=0.8427 | b=1.0069 | k=0.3682 | 0.9806 | 0.0021122 | 0.0459555 | |
| 60 | a=−6.0315 | b=1.0639 | k=0.3544 | 0.9987 | 0.0012946 | 0.0359872 | ||
| 70 | a=2.0711 | b=0.7649 | k=0.4844 | 0.9914 | 0.0010629 | 0.0326126 | ||
| 80 | a=2.5493 | b=0.7691 | k=0.4861 | 0.9947 | 0.0008905 | 0.0270806 | ||
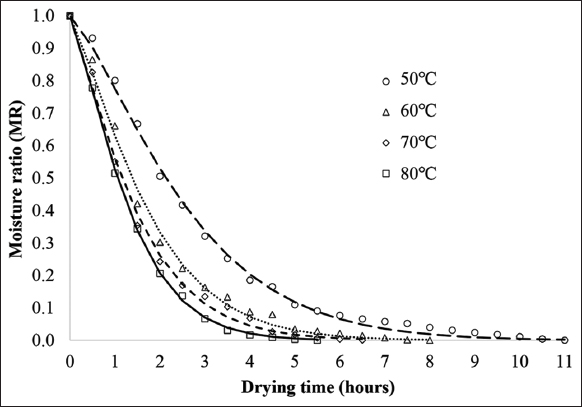 | Figure 2: Variation in moisture ratio as a function of drying time at different temperatures. [Click here to view] |
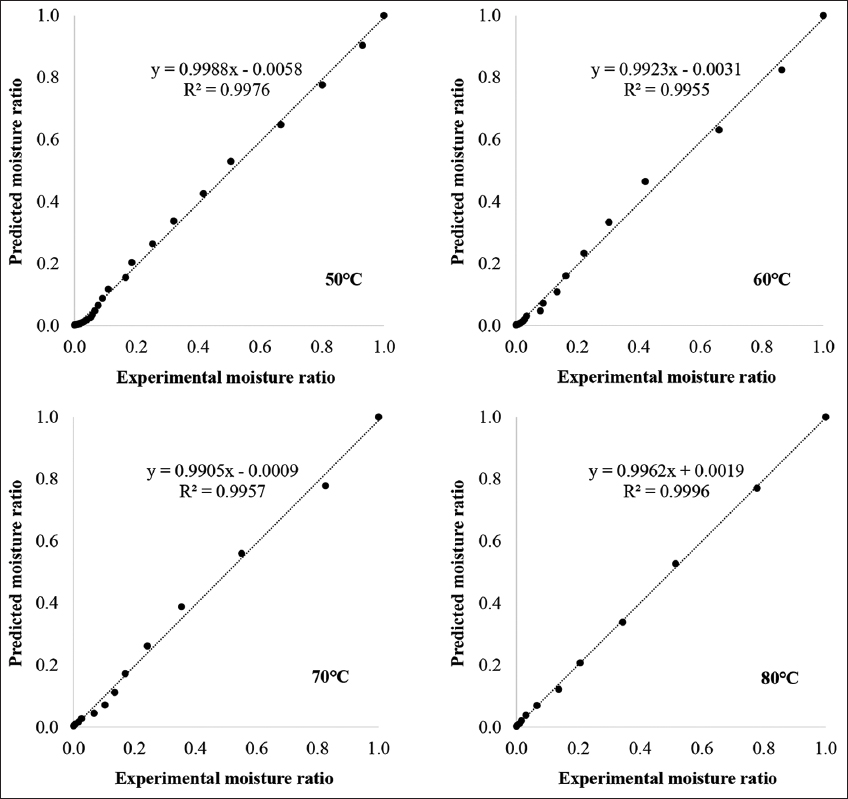 | Figure 3: The fitness between experimental moisture ratio and predicted moisture ratio by the Page model at different temperatures. [Click here to view] |