
1. INTRODUCTION
Banana is a widely consumed fruit, cultivated predominantly in tropical and subtropical regions [1,2]. Banana belongs to the genus Musa and the family Musaceae [3]. Most of the cultivars are derived from two diploid species Musa acuminata and Musa balbisiana [4,5]. The widely grown diverse varieties of genus Musa are Musa Cavendish, Musa paradisiaca, and Musa sapientum. Cavendish bananas are sweet in taste, also known as dessert bananas and are used mainly in a ripe state for table purpose [6], while plantain is starchier and mainly used for cooking purposes in unripe conditions. India is the largest producer of bananas followed by China and Indonesia. In compliance with FAO, worldwide production of banana tends to upsurge and is reported as 116.78 million tons and India’s share was 30.46 million tons which is about 26.08% of the total world production [7]. It is claimed that banana has several health benefits mainly blood pressure control, reducing inflammation, beneficial for cardiovascular problems, and digestive health [8,9]. Banana is embedded with several micronutrients mainly minerals such as phosphorous, magnesium, sodium, potassium, copper, and zinc as well as vitamin A and C [10,11]. Banana is also known as “Happy fruit,” this is due to the presence of serotonin that helps to prevent depression and relaxes the body. It has hypocholesterolemia activity due to the presence of resistant starch that has lower digestibility and thus resulting in a low glycemic index.
Post-harvest handling of bananas generally results in huge losses due to the damage caused during harvesting and transportation. Furthermore, the small sized bananas are not suitable for marketing and not finding any commercial use. One-fifth of the harvested bananas is rejected and is generally used as animal feed or disposed of. Since, banana is a rich source of starch and other nutrients; thus, it offers a potential source for utilization in different food products [12]. Banana pulp of these untapped bananas can be utilized to prepare banana flour that can be incorporated into different food products. During drying apart from the removal of moisture, the process must not affect flavor, color, texture, and other quality attributes too during dehydration [13,14]. Drying tropical fruits may also confront common difficulties such as browning, wettability, shrinkage of cells, and case hardening which ultimately lessens its market value and suitability by the consumers [15-17].
Pre-treatments of the banana pulp slices may be carried out to prevent the color changes during drying. Blanching and application of citric acid, ascorbic acid, common salt, sugar, sulfiting, sulfuring, or its combination are commonly used to prevent browning [18]. Citric acid pre-treatment is found to be associated with increased thermal tolerance and water stability of polysaccharides and inhibits the starch retrogradation due to formation of hydrogen and ester bonds with starch molecules. The chelating properties of acid help in the preservation of color of the product [19].
Since, limited information is available on the effect of citric acid pre-treatment on the drying kinetics behavior of banana slices and its characteristics, therefore, the main purpose of this present research was to study the influence of pre-treatment and temperature on the drying kinetics and quality attributes including, color, total phenolic content (TPC), % DPPH free radical scavenging activity, and sensory parameters of green banana slices and to select an appropriate drying model for describing the dehydration kinetics. Thus, the present approach may likely cost effective with preserving the quality attributes to reduce the existing post-harvest losses in the global perspective.
2. MATERIALS AND METHODS
2.1. Sample Preparation and Experimental Setup
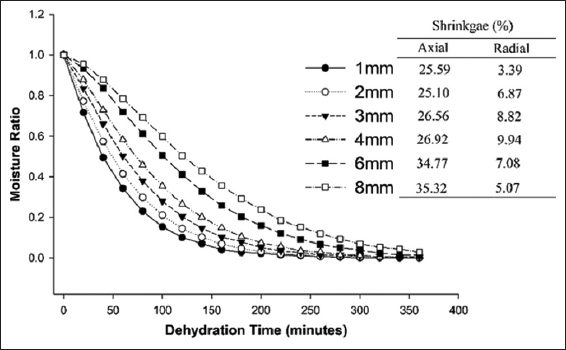
Unripe banana of Grand Naine variety was procured from the local banana merchant of Sangrur, Punjab. The procured banana was washed with running tap water to eliminate foreign particles adhering to the surface of the banana fruit. The washed banana was peeled to get the slices of various thicknesses (1–8 mm). As per the preliminary dehydration, trials for the axial and radial shrinkage of the slices of varied thickness were assessed [Figure 1]. The slices of 2 mm thickness took 60% less time to achieve the same level of final moisture content in comparison to 8 mm thick slices. Thus, banana slices of 2 mm thickness were pretreated by exposing the slices in 0.4% citric acid solution for 10 min. The dehydration study was conducted at five different temperatures, that is, 50–70°C with an interval of 5°C in a cabinet drier for at least 8 h. The experiments were carried out in triplicates and dried samples were stored in airtight containers under refrigeration conditions until further analyzed.
 | Figure 1: Comparative characteristics of dehydrated banana slices after treatment [Click here to view] |
2.2. Mathematical Modeling
The data obtained from drying of banana slices were fitted into various available drying models, as shown in Table 1. The moisture ratio was obtained using the following equation:
Table 1: Mathematical models used in the present study.
| Serial number | Model | Model equation |
|---|---|---|
| 1. | Newton model | MR = exp(-k *t) |
| 2. | Page model | MR = exp(-k *tn ) |
| 3. | Modified page model -I | MR = exp(-(k *t)n ) |
| 4. | Modified page model-II | MR = k *exp(-t / d2 )n |
| 5. | Henderson and Pabis | MR = a * exp(-k *tn ) |
| 6. | Wang and Singh model | MR = 1+ at + bt2 |
| 7. | Modified Henderson and Pabis | MR = a * exp(-k *t) + b * exp(-g *t) + c * exp(-h *t) |
| 8. | Two term exponential model | MR = a*exp(-k *t) + (1- a)*exp(k * a *t) |
| 9. | Balbay and Sahin model | MR = (1- a)*exp(-k *tn )+ b |
| 10. | Two term model | MR = a * exp(-k *t) + b * exp(k *t) |
| 11. | Verma model | MR = a * exp(-k *t) + (1- a)* exp(-g *t) |
| 12. | Logarithmic model | MR = a * exp(-k *t) + c |
| 13. | Simplified ficks diffusion model | MR = a * exp(-c *?t/L2?) |
| 14. | Midilli model | MR = a * exp(-k *tn )+ b *t |
 |
Where MR refers to the moisture ratio, Mt is the moisture content at time t on a dry basis, Me is equilibrium constant of moisture on dry basis and M0 is initial moisture content on dry basis.
2.3. Non-Linear Regression Analysis
The selection of the suitable drying model is reliant on relevant statistical parameters. These models express the curve of drying to decide the level of fitness. Non-linear regression analysis of moisture ratio was conducted in Statistica 10.1 computer software using the Levenberg–Marquardt algorithm [20].The extent of fitness was evaluated by use of three attributes: Coefficient of multiple determinations (R2), Chi-square (χ2), and root mean square error (RMSE) using the equations (2-4), respectively [21].
Higher value of R2 and the lower value of χ2 and RMSE are the indicators of the goodness of fit of the model.
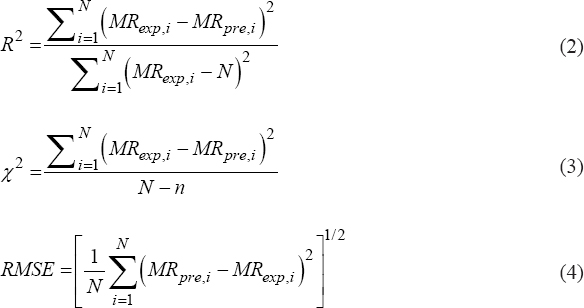 |
Where MRexp,i and MRpre,i are the ith experimental and predicted moisture ratio, respectively, N refers to the number of experimental data points, and n is the model constants number.
2.4. Calculations of Effective Moisture Diffusivity (Deff) and Activation Energy (Ea)
The effective diffusivity (Deff) was calculated using Fick’s second law of diffusion with the hypothesis that there is a constant commencing distribution of moisture; moisture migration is by diffusion, minor shrinkage, minor external resistance, constant diffusion coefficients, and temperature [22].
2.5. Color Analysis
Color parameters such as lightness (L*), redness (a*), yellowness (b*), and total color difference (ΔE) of untreated and treated green banana samples were analyzed using a Hunter laboratory colorimeter, which was fitted with an optical sensor (Hunter Associates Laboratory Inc., Reston, VA, and USA). The parameters a* lie in the ranging from -a (green) to +a (red). However, the b* value indicates the region ranging from -b (blue) to +b (yellow). Before sample measurements, the instrument was first calibrated using reference white and black tiles. The total color differences (ΔE) between the fresh and dried samples were determined using equation 5:
 |
Where, L*0, a*0, and b*0 are the color parameters of fresh samples; L*, a*, and b* are the color parameters of dried samples.
In addition, chroma (C*), hue angle (h°), and browning index (BI) of fresh and dried samples were calculated using the Equations (6–8), respectively.
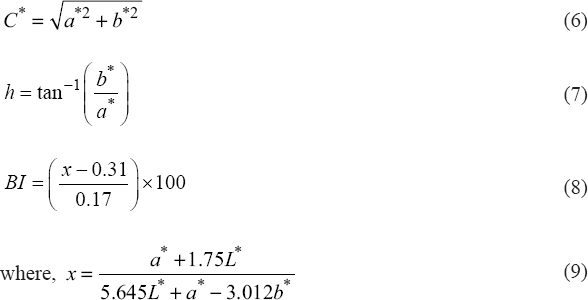 |
Where, C* signifies color saturation while h° value varies 0° (pure red), 90 (pure yellow), 180 (pure green), and 270° (pure blue) [23].
2.6. Determination of Antioxidant Properties
TPC and total antioxidant activity (% DPPH) were investigated using the standard method as described [24]. The TPC value was calculated and represented as the Gallic acid equivalent/100 g. The antioxidant activity was represented as the % DPPH free radical scavenging activity.
2.7. Morphological Characteristics
The morphological features of untreated and treated banana flour were studied using scanning electron microscopy (SEM) (JSM 6300 SEM, JEOL, and Tokyo, Japan). The samples were uniformly dispersed on an aluminum stub in argon air circumstances before being coated with gold using ion sputter. The microstructural features of each sample at × 350 magnification were recorded with the voltage of 2 kV.
2.8. Sensory Evaluations
Sensory attributes of untreated and treated dehydrated banana slice samples were performed using 9-point hedonic scales (9 = like extremely and 1 = dislike extremely). The samples were then presented before the panelists and they were asked to evaluate the samples in terms of their color, appearance, texture, and overall acceptability.
2.9. Statistical Analysis
All the analysis was carried out in triplicate and displayed as mean ± standard deviation (SD). Duncan’s test was used in one-way ANOVA with the help of SPSS software for analyzing the data at a confidence interval of 95% (P < 0.05).
3. RESULTS AND DISCUSSION
3.1. Effect of Thickness on Drying Characteristics
A typical drying curve of various slice thickness is presented in Figure 2. The thickness of slice is a key factor, affecting the drying properties (moisture ratio and drying time) and shrinkage. It was evident that higher slice thickness took greater time to attain final moisture content due to higher diffusion path length and also found higher percentage of shrinkage in axial and radial directions. Thus, the overall product quality may decrease and not further used for processing or other applications. Although, the thickness of 1 mm and 2 mm was found compatible for the drying experiment because it took almost same time to reach the final moisture content. However, in case of 1mm thickness, the surface area of slices required for dehydration was almost double required space in the drier, which further enhances the processing cost. Considering the resulted dehydrated slice quality, the thickness of 2 mm was selected in this study, as reduced hardness value improves the grinding characteristics and products quality.
 | Figure 2: Effect of thickness on moisture ratio, time, and shrinkage properties of banana slices at constant air temperature [Click here to view] |
3.2. Effect of Pre-treatment on Drying Time
Hot water, steam, and microwave blanching as pre-treatment were tried; the treatments have resulted in sticky blanched slices due to gelatinization of banana starch [3]. Various combinations of commonly used pre-treatment to prevent browning were tried and found better result with the citric acid pre-treatment to prevent both enzymatic and non-enzymatic browning. The effect of the citric acid pre-treatment on the moisture ratio of the banana during the drying process is shown in Figure 3. Pre-treatment of banana slices before drying prevents the browning of fruits during drying and storage and also increases the drying rate of fruits and the effect of drying operation on quality parameters of fruits is also minimized [15,25]. The final drying time for control (untreated) and pre-treated banana slices at 50, 55, 60, 65, and 70°C was 480, 440, 420, 360, 340 min, and 440, 380, 340, 300, and 280 min, respectively. It was observed that the citric acid pre-treatment significantly reduced the drying time. The drying time was reduced by 8.33%, 13.63%, 19.04%, 16.66%, and 17.64% in pre-treated banana slices at 50, 55, 60, 65, and 70°C, respectively. Similar results were found [26,27] and revealed the air-drying behavior of untreated, and sodium bisulfite and ascorbic/citric acid treated Dwarf Cavendish and Gros Michel banana slices between 40 and 70°C. It was reported that browning of banana slices decreased with pre-treatment and increase in drying temperature, whereas pre-treatment and temperature did not affect the shrinkage. The decrease in drying time with citric acid pre-treatment enables lesser thermal degradation of banana slices as compared to untreated slices where prolonged heating increased the thermal degradation of final product.
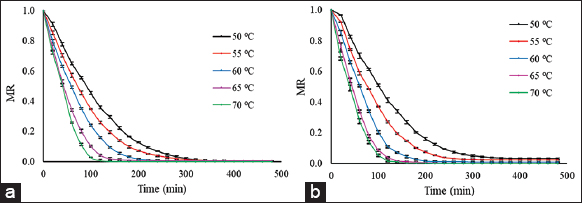 | Figure 3: Moisture ratio curves of (a) treated and (b) untreated banana slices (2 mm) at different drying temperatures. [Click here to view] |
3.3. Effect of Pre-treatment on Drying Rate
The amount of water removed per unit time versus drying time is known as drying rate. Figure 4 depicts the drying rate of untreated and treated banana slices where drying rate decreased continuously with increased drying time. The rate of removal of moisture was higher for treated sample than untreated samples. Drying of treated and untreated banana slices falls under a falling rate period due to internal mass transfer during diffusion. Similar results were reported [28,29]. In both cases, there is absence of constant rate period, which might be due to unavailability of constant water supply required for rapid drying of products for a considerable period at the initial stages of drying [30]. It is indicated that the diffusion is the major phenomenon governing the movement of moisture from banana slices. On the contrary, during the later stage of drying, more energy is required to remove the moisture from internal tissues and drying rate was found to decrease. Similar results have been reported on drying kinetics of banana by various researchers [26,31,32]. It revealed that drying of banana usually takes place under the falling period and that diffusion mechanism (movement of moisture from a region of higher concentration to a region of lower concentration) is the dominant physical mechanism prevailing during moisture removal process in bananas.
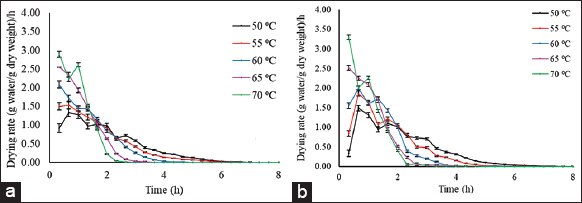 | Figure 4: Drying rate curve of (a) treated and (b) untreated banana slices (2 mm) at different drying temperatures. [Click here to view] |
3.4. Kinetic Modeling
The drying data obtained were fitted into different models using non-linear regression analysis [Table 1]. The models were evaluated based on the coefficient of determination (R2), RMSE and the reduced Chi-square (χ2). The results of statistical analysis are shown in Tables 2 and 3. Henderson and Pabis model was found to be best fitted at all the drying temperature for untreated and treated banana slices. It was also seen that the page model was also in close agreement to Henderson and Pabis regarding the parameters of fitness criteria. The value of drying rate constant “k” was found to increase with increase in temperature. It increased from 0.0089 at 50°C to 0.02 at 70°C. Similar results have been reported in the literature for various vegetables [33,34].
Table 2: Statistical analysis and model parameters for untreated banana slices at different drying air temperatures.
| Model | Parameters | Temperature (°C) | ||||
|---|---|---|---|---|---|---|
| 50 | 55 | 60 | 65 | 70 | ||
| Newton model | k | 0.0089 | 0.0111 | 0.0141 | 0.0191 | 0.0223 |
| R2 | 0.9922 | 0.9946 | 0.9916 | 0.9896 | 0.9827 | |
| RMSE | 0.0424 | 0.0297 | 0.0304 | 0.0287 | 0.0362 | |
| χ2 | 0.0019 | 0.001 | 0.0020 | 0.0009 | 0.0014 | |
| Page model | k | 0.0016 | 0.0033 | 0.0039 | 0.0046 | 0.0052 |
| n | 1.3409 | 1.2591 | 1.2877 | 1.3394 | 1.4824 | |
| R2 | 0.9996 | 0.9998 | 0.9985 | 0.9991 | 0.9975 | |
| RMSE | 0.0067 | 0.0046 | 0.0109 | 0.0081 | 0.0128 | |
| χ2 | 4.5E-05 | 2.3E-05 | 1.0E-04 | 6.9E-05 | 2.0E-04 | |
| Modified page I model | k | 0.0085 | 0.0106 | 0.0134 | 0.0181 | 0.0207 |
| n | 1.3450 | 1.2591 | 1.2877 | 1.3394 | 1.4824 | |
| R2 | 0.9996 | 0.9998 | 0.9985 | 0.9991 | 0.9975 | |
| RMSE | 0.0066 | 0.0046 | 0.0109 | 0.0081 | 0.0128 | |
| χ2 | 4.5E-05 | 2.3E-05 | 1.0E-04 | 6.9E-05 | 2.0E-04 | |
| Modified page II model | k | 1.0856 | 1.0590 | 1.0506 | 1.0484 | 1.0527 |
| d | 3.5281 | 2.4332 | 1.9706 | 1.6045 | 0.7930 | |
| n | 0.1205 | 0.0690 | 0.0572 | 0.0512 | 0.0146 | |
| R2 | 0.9898 | 0.9936 | 0.9910 | 0.9896 | 0.9825 | |
| RMSE | 0.0348 | 0.0253 | 0.0277 | 0.0265 | 0.0342 | |
| χ2 | 0.0013 | 0.0007 | 0.0008 | 0.0007 | 0.0012 | |
| Henderson and Pabis | k | 0.0015 | 0.0030 | 0.0033 | 0.0043 | 0.0048 |
| a | 0.9929 | 0.9919 | 0.9827 | 0.9925 | 0.9861 | |
| n | 1.3592 | 1.2735 | 1.3204 | 1.3530 | 1.5129 | |
| R2 | 0.9996 | 0.9998 | 0.9986 | 0.9991 | 0.9975 | |
| RMSE | 0.0064 | 0.0043 | 0.0103 | 0.0080 | 0.0125 | |
| χ2 | 4.2E-05 | 1.9E-05 | 1.1E-04 | 6.7E-05 | 2.0E-04 | |
| Wang and Singh model | a | 0.0059 | 0.0065 | 0.0070 | 0.0075 | 0.0077 |
| b | 0.0000 | 0.0000 | 0.0000 | 0.0000 | 0.0000 | |
| R2 | 0.9864 | 0.9602 | 0.9134 | 0.8130 | 0.7520 | |
| RMSE | 0.0377 | 0.0687 | 0.1030 | 0.1505 | 0.1731 | |
| χ2 | 0.0015 | 0.0049 | 0.0111 | 0.0236 | 0.0312 | |
| Modified Henderson and Pabis | a | 0.3619 | 0.3521 | 0.3542 | 0.3488 | 0.3509 |
| k | 0.0097 | 0.0117 | 0.0147 | 0.0199 | 0.0232 | |
| b | 0.3619 | 0.3497 | 0.3477 | 0.3467 | 0.3509 | |
| g | 0.0097 | 0.0117 | 0.0147 | 0.0199 | 0.0232 | |
| c | 0.3619 | 0.3572 | 0.3486 | 0.3530 | 0.3509 | |
| h | 0.0097 | 0.0117 | 0.0147 | 0.0199 | 0.0232 | |
| R2 | 0.9897 | 0.9936 | 0.9910 | 0.9896 | 0.9825 | |
| RMSE | 0.0348 | 0.0253 | 0.0277 | 0.0265 | 0.0342 | |
| χ2 | 0.0013 | 0.0007 | 0.0008 | 0.0007 | 0.0012 | |
| Two term exponential model | a | 1.0007 | 1.0001 | 1.0000 | 1.0000 | 1.0000 |
| k | 0.0088 | 0.0110 | 0.0141 | 0.0191 | 0.0223 | |
| R2 | 0.9892 | 0.9934 | 0.9913 | 0.9900 | 0.9827 | |
| RMSE | 0.0391 | 0.0291 | 0.0304 | 0.0286 | 0.0362 | |
| χ2 | 0.0016 | 0.0009 | 0.0010 | 0.0009 | 0.0014 | |
| Balbay and Sahin model | a | 0.0021 | 0.0064 | 0.0150 | 0.0115 | 0.0124 |
| k | 0.0017 | 0.0031 | 0.0034 | 0.0042 | 0.0028 | |
| n | 1.3332 | 1.2687 | 1.3136 | 1.3651 | 1.5084 | |
| b | 0.0065 | 0.0012 | 0.0017 | 0.0033 | 0.0013 | |
| R2 | 0.9997 | 0.9998 | 0.9986 | 0.9991 | 0.9975 | |
| RMSE | 0.0054 | 0.0042 | 0.0102 | 0.0075 | 0.0125 | |
| χ2 | 0.0000 | 0.0000 | 0.0001 | 0.0001 | 0.0002 | |
| Two term model | a | 1.0790 | 1.0575 | 1.0505 | 1.0484 | 1.0527 |
| k | 0.0095 | 0.0116 | 0.0147 | 0.0199 | 0.0232 | |
| b | 0.0004 | 0.0001 | 0.0000 | 0.0000 | 0.0000 | |
| R2 | 0.9895 | 0.9932 | 0.9909 | 0.9899 | 0.9825 | |
| RMSE | 0.0324 | 0.0248 | 0.0277 | 0.0264 | 0.0342 | |
| χ2 | 0.0011 | 0.0006 | 0.0008 | 0.0007 | 0.0012 | |
| Verma model | a | 1.1816 | 1.1471 | 1.1588 | 1.2375 | 1.3364 |
| k | 0.0105 | 0.0126 | 0.0161 | 0.0230 | 0.0283 | |
| g | 1.3315 | 1.5413 | 1.7512 | 2.0283 | 2.1149 | |
| R2 | 0.9950 | 0.9970 | 0.9945 | 0.9960 | 0.9921 | |
| RMSE | 0.0244 | 0.0172 | 0.0213 | 0.0163 | 0.0228 | |
| χ2 | 0.0006 | 0.0003 | 0.0005 | 0.0003 | 0.0005 | |
| Logarithmic model | a | 1.1131 | 1.0718 | 1.0606 | 1.0529 | 1.0610 |
| k | 0.0085 | 0.0109 | 0.0140 | 0.0195 | 0.0226 | |
| c | 0.0487 | 0.0239 | 0.0168 | 0.0065 | 0.0107 | |
| R2 | 0.9929 | 0.9946 | 0.9916 | 0.9897 | 0.9827 | |
| RMSE | 0.0258 | 0.0211 | 0.0252 | 0.0259 | 0.0330 | |
| χ2 | 0.0007 | 0.0005 | 0.0007 | 0.0007 | 0.0011 | |
| Simplified Fick’s diffusion model | a | 1.0856 | 1.0590 | 1.0506 | 1.0484 | 1.0527 |
| c | 0.0000 | 0.0001 | 0.0002 | 0.0001 | 0.0000 | |
| L | 0.0689 | 0.0681 | 0.1223 | 0.0725 | 0.0393 | |
| R2 | 0.9897 | 0.9936 | 0.9910 | 0.9896 | 0.9825 | |
| RMSE | 0.0348 | 0.0253 | 0.0277 | 0.0265 | 0.0342 | |
| χ2 | 0.0017 | 0.0007 | 0.0008 | 0.0007 | 0.0012 | |
| Midilli model | a | 0.9949 | 0.9922 | 0.9828 | 0.9920 | 0.9861 |
| k | 0.0017 | 0.0031 | 0.0033 | 0.0042 | 0.0028 | |
| n | 1.3415 | 1.2713 | 1.3193 | 1.3602 | 1.5127 | |
| b | 0.0000 | 0.0000 | 0.0000 | 0.0000 | 0.0000 | |
| R2 | 0.9997 | 0.9998 | 0.9986 | 0.9992 | 0.9975 | |
| RMSE | 0.0057 | 0.0043 | 0.0103 | 0.0073 | 0.0125 | |
| χ2 | 0.0000 | 0.0000 | 0.0001 | 0.0001 | 0.0002 | |
RMSE: Root mean square error.
Table 3: Statistical analysis and model parameters for treated banana slices at different drying air temperatures.
| Model | Parameters | Temperature (°C) | ||||
|---|---|---|---|---|---|---|
| 50 | 55 | 60 | 65 | 70 | ||
| Newton model | k | 0.0079 | 0.0105 | 0.0142 | 0.0194 | 0.0221 |
| R2 | 0.9876 | 0.9872 | 0.9820 | 0.9878 | 0.9904 | |
| RMSE | 0.0484 | 0.0403 | 0.0429 | 0.0320 | 0.0262 | |
| χ2 | 0.0024 | 0.0017 | 0.0019 | 0.0011 | 0.0007 | |
| Page model | k | 0.0012 | 0.0017 | 0.0020 | 0.0032 | 0.0037 |
| n | 1.3772 | 1.3512 | 1.4848 | 1.3976 | 1.4824 | |
| R2 | 0.9980 | 0.9984 | 0.9989 | 0.9990 | 0.9975 | |
| RMSE | 0.0162 | 0.0154 | 0.0110 | 0.0001 | 0.0002 | |
| χ2 | 0.0003 | 0.0002 | 0.0001 | 0.0081 | 0.0128 | |
| Modified page I model | k | 0.0076 | 0.0117 | 0.0134 | 0.0181 | 0.0207 |
| n | 1.3772 | 1.5154 | 1.2877 | 1.3394 | 1.4824 | |
| R2 | 0.9980 | 0.9966 | 0.9985 | 0.9991 | 0.9975 | |
| RMSE | 0.0162 | 0.0175 | 0.0109 | 0.0081 | 0.0128 | |
| χ2 | 0.0003 | 0.0003 | 0.0001 | 0.0001 | 0.0002 | |
| Modified page II Model | k | 1.1029 | 1.0997 | 1.0506 | 1.0484 | 1.0527 |
| d | 0.6249 | 5.6063 | 5.4265 | 5.5105 | 4.4667 | |
| n | 0.0033 | 0.4216 | 0.4335 | 0.6040 | 0.4635 | |
| R2 | 0.9832 | 0.9791 | 0.9910 | 0.9896 | 0.9825 | |
| RMSE | 0.0422 | 0.0444 | 0.0277 | 0.0265 | 0.0342 | |
| χ2 | 0.0019 | 0.0021 | 0.0008 | 0.0007 | 0.0012 | |
| Henderson and Pabis | k | 0.0012 | 0.0015 | 0.0033 | 0.0043 | 0.0048 |
| a | 1.0202 | 0.9999 | 0.9827 | 0.9925 | 0.9861 | |
| n | 1.3366 | 1.5157 | 1.3204 | 1.3530 | 1.5129 | |
| R2 | 0.9981 | 0.9966 | 0.9986 | 0.9991 | 0.9975 | |
| RMSE | 0.0154 | 0.0080 | 0.0103 | 0.0080 | 0.0125 | |
| χ2 | 0.0002 | 0.0003 | 0.0001 | 0.0001 | 0.0002 | |
| Wang and Singh model | a | −0.0055 | −0.0068 | −0.0070 | −0.0075 | −0.0077 |
| b | 0.0000 | 0.0000 | 0.0000 | 0.0000 | 0.0000 | |
| R2 | 0.9882 | 0.9281 | 0.9134 | 0.8130 | 0.7520 | |
| RMSE | 0.0339 | 0.0879 | 0.1030 | 0.1505 | 0.1731 | |
| χ2 | 0.0012 | 0.0080 | 0.0111 | 0.0236 | 0.0312 | |
| Modified Henderson and Pabis | a | 0.4409 | 0.4726 | 0.3542 | 0.3488 | 0.3509 |
| k | 0.0087 | 0.0134 | 0.0147 | 0.0199 | 0.0232 | |
| b | 0.4033 | 0.4585 | 0.3477 | 0.3467 | 0.3509 | |
| g | 0.0087 | 0.0134 | 0.0147 | 0.0199 | 0.0232 | |
| c | 0.2632 | 0.1685 | 0.3486 | 0.3530 | 0.3509 | |
| h | 0.0087 | 0.0134 | 0.0147 | 0.0199 | 0.0232 | |
| R2 | 0.9866 | 0.9791 | 0.9910 | 0.9896 | 0.9825 | |
| RMSE | 0.0368 | 0.0444 | 0.0277 | 0.0265 | 0.0342 | |
| χ2 | 0.0014 | 0.0021 | 0.0008 | 0.0007 | 0.0012 | |
| Two term exponential model | a | 1.0006 | 1.0000 | 1.0000 | 1.0000 | 1.0000 |
| k | 0.0077 | 0.0123 | 0.0141 | 0.0191 | 0.0223 | |
| R2 | 0.9851 | 0.9791 | 0.9913 | 0.9900 | 0.9827 | |
| RMSE | 0.0476 | 0.0512 | 0.0304 | 0.0286 | 0.0362 | |
| χ2 | 0.0024 | 0.0027 | 0.0010 | 0.0009 | 0.0014 | |
| Balbay and Sahin model | a | 0.0188 | 0.0045 | 0.0150 | 0.0115 | 0.0124 |
| k | 0.0009 | 0.0011 | 0.0034 | 0.0042 | 0.0028 | |
| n | 1.4566 | 1.5306 | 1.3136 | 1.3651 | 1.5084 | |
| b | 0.0265 | 0.0033 | 0.0017 | 0.0033 | 0.0013 | |
| R2 | 0.9993 | 0.9966 | 0.9986 | 0.9991 | 0.9975 | |
| RMSE | 0.0082 | 0.0173 | 0.0102 | 0.0075 | 0.0125 | |
| χ2 | 0.0001 | 0.0003 | 0.0001 | 0.0001 | 0.0002 | |
| Two term model | a | 1.1059 | 1.0994 | 1.0505 | 1.0484 | 1.0527 |
| k | 0.0086 | 0.0134 | 0.0147 | 0.0199 | 0.0232 | |
| b | 0.0001 | 0.0000 | 0.0000 | 0.0000 | 0.0000 | |
| R2 | 0.9865 | 0.9789 | 0.9909 | 0.9899 | 0.9825 | |
| RMSE | 0.0368 | 0.0444 | 0.0277 | 0.0264 | 0.0342 | |
| χ2 | 0.0014 | 0.0021 | 0.0008 | 0.0007 | 0.0012 | |
| Verma model | a | 1.6754 | 1.2878 | 1.1587 | 1.2375 | 1.3364 |
| k | 0.0113 | 0.0154 | 0.0161 | 0.0230 | 0.0283 | |
| g | 0.0279 | 2.0000 | 2.0000 | 2.0000 | 2.0000 | |
| R2 | 0.9983 | 0.9906 | 0.9945 | 0.9960 | 0.9921 | |
| RMSE | 0.0244 | 0.0172 | 0.0213 | 0.0163 | 0.0228 | |
| χ2 | 0.0002 | 0.0009 | 0.0005 | 0.0003 | 0.0005 | |
| Logarithmic model | a | 1.1240 | 1.1140 | 1.0606 | 1.0529 | 1.0610 |
| k | 0.0080 | 0.0126 | 0.0140 | 0.0195 | 0.0226 | |
| c | −0.0294 | −0.0233 | −0.0168 | −0.0065 | −0.0107 | |
| R2 | 0.9877 | 0.9801 | 0.9916 | 0.9897 | 0.9827 | |
| RMSE | 0.0345 | 0.0417 | 0.0252 | 0.0259 | 0.0330 | |
| χ2 | 0.0012 | 0.0018 | 0.0007 | 0.0007 | 0.0011 | |
| Simplified Fick’s diffusion model | a | 1.1074 | 1.0997 | 1.0506 | 1.0484 | 1.0527 |
| c | 0.0002 | 0.0108 | 0.0108 | 0.0105 | 0.0196 | |
| L | 0.1473 | 0.8977 | 0.8579 | 0.7262 | 0.9175 | |
| R2 | 0.9866 | 0.9791 | 0.9910 | 0.9896 | 0.9825 | |
| RMSE | 0.0368 | 0.0444 | 0.0277 | 0.0265 | 0.0342 | |
| χ2 | 0.0014 | 0.0021 | 0.0008 | 0.0007 | 0.0012 | |
| Midilli model | a | 1.0091 | 0.9992 | 0.9828 | 0.9920 | 0.9861 |
| k | 0.0010 | 0.0011 | 0.0033 | 0.0042 | 0.0028 | |
| n | 1.4328 | 1.5240 | 1.3193 | 1.3602 | 1.5127 | |
| b | 0.0001 | 0.0000 | 0.0000 | 0.0000 | 0.0000 | |
| R2 | 0.9994 | 0.9966 | 0.9986 | 0.9992 | 0.9975 | |
| RMSE | 0.0078 | 0.0173 | 0.0103 | 0.0073 | 0.0125 | |
| χ2 | 0.0001 | 0.0003 | 0.0001 | 0.0001 | 0.0002 | |
RMSE: Root mean square error.
3.5. Effective Diffusivity (Deff) and Activation Energy (Ea)
Effective diffusivity was calculated using Fick’s second law equation of diffusion, considering infinite slab geometry, a constant moisture diffusivity, and uniform initial moisture distribution [35]. The effective moisture diffusivities of untreated and treated samples at a different drying temperatures of 50–70°C vary from 0.41×10⁻¹⁰ to 1.43×10⁻¹⁰m2/s for untreated samples and 0.63×10⁻¹⁰–1.57×10⁻¹⁰ m2/s for treated sample and found that there is increased in moisture diffusivity with the increase in drying temperature and ensured that diffusion is most likely to be a physical phenomenon which governs the moisture movement. Similar results were reported [26] in untreated and pre-treated Dwarf Cavendish and Gross Michel banana slices, whereas moisture diffusivity was decreased at 70°C in the pre-treated samples probably due to case hardening and starch gelatinization above 60°C. It has been reported that during the drying of banana slices at high temperatures with a decrease in moisture content, there is an increase in the effective diffusion coefficient which was found to decrease after a certain moisture content was reached [36].
A straight line was obtained with a slope (-Ea/R) when ln(Deff) was plotted against 1/T from which activation energy was easily calculated, as shown in Figure 5. The activation energy of treated and untreated samples found to be 40.82 and 60.62 kJ/mol, respectively. The obtained values are in the suitable range (12.7–110 kJ/mol) for similar products reported. Our results were in reasonable agreement with the activation energy as reported in the literature: 27–33 kJ/mol and 32.65 kJ/mol whereas in close agreement and activation energy for banana slices was 51.45 kJ/mol [26].
 | Figure 5: Arrhenius plot for drying of (a) untreated and (b) treated banana slices. [Click here to view] |
3.6. Effect of Temperature and Pre-treatment on Proximate Composition and Color Properties
Nutrient composition and color are important food quality characteristics that affect the nutritional characteristics and the acceptance of the product by the consumers. The proximate composition and color parameters of untreated and treated samples were varied significantly (P < 0.05) by the drying air temperature, which is presented in Tables 4 and 5. It is seen that the treated sample was found to have a higher L* than the untreated sample for all the temperature conditions. It is mainly due to polyphenol oxidase (PPO), which leads to enzymatic browning. However, the activity of PPO was increased on exposure of drying temperature, slice thickness, and time. As thickness of the slices and the exposed temperature affect, the duration of the slices remained at wet bulb temperature during the falling rate period of dehydrating banana slices and thus the extent of browning in dried banana slices. Furthermore, L* value was observed higher in the fresh sample, followed by gradual decrease in L* with increasing drying temperature. Non-enzymatic Maillard reaction at higher temperature leads to the formation of dark pigments, further reducing the L* values [37]. Thus, the BI was higher at higher temperature and lower for treated samples compared to untreated sample. The parameters a*, b*, C*, and h° were similarly influenced by the drying air temperature and treatment. Total color difference (ΔE) was increased with temperature and found more in case of untreated sample. As a result, the treated sample dried at exactly or below 60°C had a lower tendency toward yellow, lower color saturation, lower BI, and a low yellowish hue compared to sample dried at higher temperature. Similar kind of findings was observed [38]. Therefore, above all the mentioned considerations, the sample dried at 60°C or below will almost keep their natural color, which further prefer for consumer acceptance and suitable for other processing applications.
Table 4: Proximate composition of Grand Naine flour dehydrated at 60°C.
| Composition (%) | Fresh | Untreated flour | Treated flour |
|---|---|---|---|
| Moisture | 75.48±0.15 | 6.05±0.13 | 5.73±0.09 |
| Crude protein | 1.85±0.13 | 5.01±0.19 | 5.22±0.05 |
| Crude fat | 0.16±0.02 | 0.52±0.03 | 0.47±0.02 |
| Ash | 0.36±0.05 | 2.52±0.13 | 2.45±0.17 |
| Carbohydrate | 20.14±0.98 | 78.98±1.43 | 79.53±0.38 |
| Starch | - | 69.943±1.24 | 71.43±1.12 |
| Amylose | - | 15.443±0.08 | 17.65±0.28 |
| Resistant starch | - | 28.797±0.73 | 30.06±0.23 |
Table 5: Color parameters of untreated and treated samples at various drying temperatures.
| Parameters | Fresh | 50°C | 55°C | 60°C | 65°C | 70°C |
|---|---|---|---|---|---|---|
| Untreated | ||||||
| L* | 96.14±0.30a | 81.56±0.4b | 77.49±0.1c | 76.22±0.1d | 72.68±0.16e | 70.8±0.16f |
| a* | 1.42±0.03e | 2.56±0.03a | 2.49±0.03b | 2.49±0.04b | 2.19±0.03c | 2.07±0.05d |
| b* | 2.56±0.07e | 9.92±0.05c | 9.46±0.04d | 9.42±0.04d | 10.15±0.04b | 10.91±0.04a |
| ΔE | - | 16.37±0.61e | 19.91±0.36d | 21.09±0.36c | 24.67±0.42b | 26.69±0.42a |
| C | 2.92±0.07e | 10.25±0.05c | 9.78±0.05d | 9.74±0.04d | 10.38±0.04b | 11.1±0.04a |
| h° | 60.97±0.72d | 75.53±0.14c | 75.27±0.15c | 75.19±0.19c | 77.84±0.15b | 79.26±0.22a |
| BI | 3.70±0.09e | 14.99±0.07d | 15.08±0.06d | 15.3±0.07c | 16.93±0.04b | 18.53±0.11a |
| Treated | ||||||
| L* | 96.14±0.30a | 85.3±0.1b | 83.46±0.06c | 82.79±0.05d | 78.64±0.04e | 72.46±0.03f |
| a* | 1.42±0.03f | 2.88±0.04a | 2.76±0.05b | 2.68±0.03c | 2.51±0.03d | 2.29±0.04e |
| b* | 2.56±0.07e | 9.87±0.02c | 9.75±0.04d | 9.83±0.03cd | 10.07±0.05b | 10.29±0.06a |
| ΔE | - | 13.15±0.31e | 14.63±0.29d | 15.25±0.22c | 19.07±0.28b | 24.93±0.29a |
| C | 2.92±0.07e | 10.28±0.03c | 10.13±0.04cd | 10.19±0.03cd | 10.38±0.05b | 10.54±0.06a |
| h° | 60.97±0.72e | 73.73±0.17d | 74.17±0.22cd | 74.75±0.13c | 76±0.09b | 77.47±0.16a |
| BI | 3.70±0.09e | 14.5±0.03d | 14.57±0.07d | 14.73±0.07c | 15.75±0.08b | 17.31±0.11a |
Results are represented as mean±SD; different letters (a, b, c, d, e, and e ) in the same raw are varied significantly at 95% (P<0.05) confidence level.
3.7. Antioxidant Properties
The effect of different drying temperatures on antioxidant properties (TPC and %DPPH scavenging activity) of untreated and treated banana flour is presented in Table 6. It can be seen that a significant increase in TPC (untreated: 81.45–94.68 mg of GAE/100 g; treated: 87.65–102.54 mg of GAE/100 g) and antioxidant activity (AA; untreated: 7.41–9.78%; treated: 7.65–10.92%) values for both treated and untreated sample was observed with increasing drying temperatures from 50 to 60°C. Further, they were decreased due to the degradation of heat sensitive bioactive compounds from 94.68 to 72.26 mg of GAE/100 g (untreated) and 102.54–80.17 mg of GAE/100 g (treated) as the temperature increased from 60 to 70°C. These results correlate with the previously reported [39]. However, the treated sample dried at 60°C showed the retention of maximum antioxidant properties. It may be due to the less time drying required compared to 50°C and 55°C drying temperatures, which preserved the higher percentage of antioxidant properties. While at lower temperatures, prolonged exposure drying time may cause oxidative reaction [40]. Moreover, higher temperature (>60°C) occurs the degradation of antioxidant properties due to loss of heat sensitive elements.
Table 6: Effect of various drying temperatures on total phenolic content and antioxidant activity of untreated and treated samples.
| T (°C) | TPC (mg of GAE/100 g of dm) | AA (% DPPH scavenging activity) | ||
|---|---|---|---|---|
| Untreated | Treated | Untreated | Treated | |
| 50 | 81.45±1.06c | 87.65±0.13d | 7.41±1.25c | 7.65±0.67c |
| 55 | 86.02±0.41b | 94.96±0.73b | 8.08±2.33b | 8.67±0.43b |
| 60 | 94.68±2.33a | 102.54±1.22a | 9.78±1.03a | 10.92±1.36a |
| 65 | 83.45±1.56c | 91.76±1.08c | 7.35±1.06c | 7.58±1.13c |
| 70 | 72.26±2.25d | 80.17±0.79e | 7.06±0.25d | 7.17±0.79d |
The superscripts a, b, c, d, and e in the same column represents significant effect of drying temperatures (P<0.05). TPC: Total phenolic content, AA: Antioxidant activity, GAE: Gallic acid equivalent, DPPH: 2,2 Diphenyl 1 picrylhydrazyl.
3.8. SEM
SEM images are used to analyzed the information about the characterization of starch granules including size and shape, presence of other compounds, structural integrity, and surface morphology. Figure 6 showed the surface morphology of native and treated green banana flour mainly comprised starch and cell wall. Large granules of starch appeared irregular, flattened, and elongated whereas small granules were round and compact with elongated spheroids forms. Smaller granules are probably those in the training process since the fruits are harvested at the green stage before the starch degradation, which occurs during fruit ripening. Similar results were reported [41,42]. With the addition of acid, the smooth surface of starch granules was lost, and cracks were seen on the surface as the acid attacked the surface of granules to diffuse into internal part of granules through amorphous and crystalline regions. The acid penetration mainly occurred through the amorphous region due to their looser structure which was easier to attack by hydrogen ions. Thus, this hydrogen causes surface alterations and damages external structure through exo-erosion [43]. The material that appears on the surface of the granules is most likely to be amyloplast membranes, which enclose starch granules in the banana fruit cell.
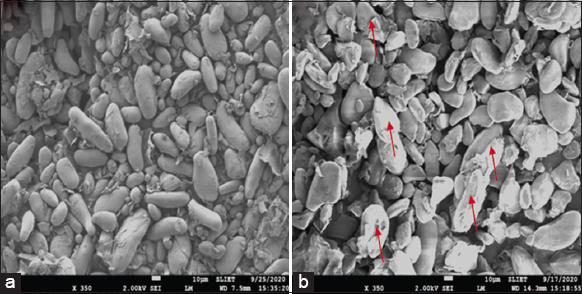 | Figure 6: Morphological features of untreated (a) and treated (b) at 60°C dried Grand naine flour. [Click here to view] |
3.9. Sensory Evaluation
Sensory attributes play an important role in determining the acceptability of dehydrated food slice. Sensory evaluation of untreated and treated banana slices at various drying temperatures is presented in Table 7. Results revealed that treated banana slices showed better sensory attributes (color, appearance, texture, and overall acceptability) than untreated slices. Although, the values of sensory attributes for all the untreated and treated samples were found to be within the permissible range, with the highest value being noticed for the treated sample dried at 60°C. It may be due to the effect of the citric acid pre-treatment process, which reduced the drying time and improvement of the sensory parameters. However, a significant difference (P < 0.05) in sensory parameters was observed at 70°C for both the untreated and treated sample. Furthermore, higher temperatures resulted in degrading quality parameters of dehydrated banana slices, which may not be accepted for consumer preferences.
Table 7: Sensory attributes of untreated and treated samples at various drying temperatures.
| Untreated slices | ||||
|---|---|---|---|---|
| T (°C) | Color | Appearance | Texture | Overall acceptability |
| 50 | 7.75±0.05a | 7.53±0.15a | 7.35±0.16a | 7.54±0.09a |
| 55 | 7.67±0.15a | 7.47±0.12a | 7.31±0.08a | 7.48±0.05ab |
| 60 | 7.73±0.12a | 7.57±0.21a | 7.38±0.24a | 7.56±0.18a |
| 65 | 7.5±0.1ab | 7.33±0.23ab | 7.12±0.11ab | 7.32±0.11bc |
| 70 | 7.37±0.21b | 7.12±0.11b | 7.03±0.06b | 7.17±0.08c |
| Treated slices | ||||
| 50 | 7.97±0.06a | 7.87±0.12a | 7.43±0.15ab | 7.76±0.05a |
| 55 | 7.85±0.09a | 7.81±0.1a | 7.47±0.23a | 7.71±0.11a |
| 60 | 7.97±0.21a | 7.9±0.3a | 7.53±0.31a | 7.8±0.15a |
| 65 | 7.73±0.12ab | 7.6±0.1ab | 7.2±0.17ab | 7.51±0.07b |
| 70 | 7.5±0.17b | 7.4±0.1b | 7.03±0.15b | 7.31±0.04c |
Note: The superscripts a, b, and c in the same column represents significant effect of drying temperatures (p≤ 0.05).
4. CONCLUSION
The effect of citric acid pre-treatment and temperature on banana drying kinetics and the quality attributes was investigated. Citric acid affected the drying characteristics of the banana slices. Pre-treated bananas with 0.4% citric acid solution dried faster than untreated samples. The entire drying process did not show a constant rate-drying period under the process and showed only a falling rate drying period. The Henderson and Pabis model was best fitted to the experimental drying data with higher coefficient of determination (R2), reduced RMSE and chi-square (χ2). Effective diffusivity increased with increase in drying temperature. Arrhenius type relationship was used to describe the dependence of effective diffusivity on temperature. The activation energy (Ea) for moisture diffusion of pre-treated and untreated samples was found to 40.82 and 60.62 kJ/mol, respectively. A significant color change resulted from decreased L* and a* values and increased b* value with an increase in temperature. In this study, the treated sample dried at exactly or below 60°C will retain its natural color, which could be preferred for acceptance of the consumer and suitable for other processing applications. Accordingly, the treated sample dried at 60°C showed greater antioxidant properties (TPC and AA), and better sensory attributes in terms of color, appearance, texture, and acceptability.
5. AUTHORS’ CONTRIBUTIONS
All the authors have made significant contributions in various areas of the manuscript including design and conceptualization of work, data acquisition, analysis, and interpretation. Followed by drafting of manuscript, revision of manuscript, statistical analysis, supervision, and final approval. All the authors gave final approval to this version of manuscript to be submitted.
6. FUNDING
There is no funding to the report.
7. CONFLICTS OF INTEREST
This research has no conflicts of interest.
8. ETHICAL APPROVALS
This study does not involve experiments on animals or human subjects.
9. DATA AVAILABILITY
All data generated during the study is available in the article.
10. PUBLISHER’S NOTE
This journal remains neutral with regard to jurisdictional claims in published institutional affiliation.
REFERENCES
1. Thuwapanichayanan R, Prachayawarakorn S, Kunwisawa J, Soponronnarit S. Determination of effective moisture diffusivity and assessment of quality attributes of banana slices during drying. LWT 2011;44:1502-10. [CrossRef]
2. Tapre AR, Jain RK. Study of advanced maturity stages of banana. Int J Adv Eng Res Stud 2012;1:272-4.
3. Rani R, Prasad K. Banana Starch:Isolation, Modification and Characterization. Germany:Scholars Press;2021.
4. Robinson JC. Banana and Plantain, Crop Production Sciences in Horticulture Series. Barbados:University of the West Indies;1996.
5. Stover RH, Simmonds NW. Bananas. Harlow:Longman Scientific and Technical;1987.
6. Prasad K, Gadhave RK, Kaur R, Divyanshi, Das R, Shekhar S. Technological, processing and nutritional aspects of banana and plantain:A review. Food Sci Nutr Technol 2022;7:1-18.
7. FAOSTAT. FAOSTAT Statistics Database. Italy:FAO;2022.
8. Singh B, Singh JP, Kaur A, Singh N. Bioactive compounds in banana and their associated health benefits--A review. Food Chem 2016;206:1-11. [CrossRef]
9. Udachan I, Gatade A, Ranveer R, Lokhande S, Mote G, Sahoo AK. Quality evaluation of gluten-free brown rice pasta formulated with green matured banana flour and defatted soy flour. J Food Process Preserv 2022;46:e16448. [CrossRef]
10. Forster M, Rodríguez ER, Martín JD, Romero CD. Distribution of nutrients in edible banana pulp. Food Technol Biotechnol 2003;41:167-71.
11. Tunckal C, Doymaz ?. Performance analysis and mathematical modelling of banana slices in a heat pump drying system. Renew Energy 2020;150:918-23. [CrossRef]
12. Keran DA, Kumar PS, Subramaniyan P, Subbaraya U. In-vitro digestibility, textural and quality characteristics of ditalini pasta fortified with green banana flour and its Type-IV modified starch. Int J Food Sci Technol 2022;57:4656-72. [CrossRef]
13. Prasad K. Protein fortification of mango and banana bar using roasted Bengal gram flour and skim milk powder. Agric Eng Int CIGR J 2009;11:1390.
14. Prasad K. Dehydration behaviour of plain and fortified banana pulps in the preparation of bars. J Dairy Foods Home Sci 2010;29:37-41.
15. Abano EE, Sam-Amoah LK. Effects of different pretreatments on drying characteristics of banana slices. APRN J Eng Appl Sci 2011;6:121-9.
16. McMinn WA, Magee TR. Physical characteristics of dehydrated potatoes--Part I. J Food Eng 1997;33:37-48. [CrossRef]
17. Singh U, Jain SK, Doshi A, Jain HK, Chahar VK. Effects of pretreatments on drying characteristics of button mushroom. Int J Food Eng 2008;4:1-21. [CrossRef]
18. Karim MA, Hawlader MN. Mathematical modelling and experimental investigation of tropical fruits drying. Int J Heat Mass Transfer 2005;48:4914-25. [CrossRef]
19. Hiranvarachat B, Devahastin S, Chiewchan N. Effects of acid pretreatments on some physicochemical properties of carrot undergoing hot air drying. Food Bioproducts Process 2011;89:116-27. [CrossRef]
20. Doymaz I. Thin-layer drying behaviour of mint leaves. J Food Eng 2006;74:370-5. [CrossRef]
21. To?rul ?T, Pehlivan D. Mathematical modelling of solar drying of apricots in thin layers. J Food Eng 2002;55:209-16. [CrossRef]
22. Pala M, Mahmuto?lu T, Saygi B. Effects of pretreatments on the quality of open-air and solar dried apricots. Food 1996;40:137-41. [CrossRef]
23. Vimercati WC, da Silva Araújo C, Macedo LL, Fonseca HC, Guimarães JS, de Abreu LR, et al. Physicochemical, rheological, microbiological and sensory properties of newly developed coffee flavored kefir. LWT 2020;123:109069. [CrossRef]
24. Kheto A, Joseph D, Islam M, Dhua S, Das R, Kumar Y, et al. Microwave roasting induced structural, morphological, antioxidant, and functional attributes of Quinoa (Chenopodium quinoa Willd). J Food Process Preserv 2022;46:e16595. [CrossRef]
25. Licciardello F, Frisullo P, Laverse J, Muratore G, Del Nobile MA. Effect of sugar, citric acid and egg white type on the microstructural and mechanical properties of meringues. J Food Eng 2012;108:453-62. [CrossRef]
26. Demirel D, Turhan M. Air-drying behavior of Dwarf cavendish and Gros Michel banana slices. J Food Eng 2003;59:1-11. [CrossRef]
27. Subhanki P, Sahithi M, Madhuresh D. Investigation of drying characteristics and nutritional retention of unripe green banana flour by refractance window drying technology using statistical approach. J Food Meas Characterization 2022;16:2375-85. [CrossRef]
28. Akanbi CT, Adeyemi RS, Ojo A. Drying characteristics and sorption isotherm of tomato slices. J Food Eng 2006;73:157-63. [CrossRef]
29. Madamba PS, Driscoll RH, Buckle KA. The thin-layer drying characteristics of garlic slices. J Food Eng 1996;29:75-97. [CrossRef]
30. Prakash S, Jha SK, Datta N. Performance evaluation of blanched carrots dried by three different driers. J Food Eng 2004;62:305-13. [CrossRef]
31. Dandamrongrak R, Young G, Mason R. Evaluation of various pre-treatments for the dehydration of banana and selection of suitable drying models. J Food Eng 2002;55:139-46. [CrossRef]
32. Drouzas AE, Schubert H. Microwave application in vacuum drying of fruits. J Food Eng 1996;28:203-9. [CrossRef]
33. Ahmed J, Shivhare US. Effect of pre-treatment on drying characteristics and colour of dehydrated green chillis. J Food Sci Technol 2001;38:504-6.
34. Akpinar EK, Bicer Y. Modelling of the drying of eggplants in thin-layers. Int J Food Sci Technol 2005;40:273-81. [CrossRef]
35. Crank J. The Mathematics of Diffusion. Oxford:Clarendon Press;1979.
36. Prachayawarakorn S, Tia W, Plyto N, Soponronnarit S. Drying kinetics and quality attributes of low-fat banana slices dried at high temperature. J Food Eng 2008;85:509-17. [CrossRef]
37. Lund MN, Ray CA. Control of Maillard reactions in foods:Strategies and chemical mechanisms. J Agric Food Chem 2017;65:4537-52. [CrossRef]
38. Macedo LL, Vimercati WC, da Silva Araújo C, Saraiva SH, Teixeira LJ. Effect of drying air temperature on drying kinetics and physicochemical characteristics of dried banana. J Food Process Eng 2020;43:e13451. [CrossRef]
39. Balasundram N, Sundram K, Samman S. Phenolic compounds in plants and agri-industrial by-products:Antioxidant activity, occurrence, and potential uses. Food Chem 2006;99:191-203. [CrossRef]
40. An K, Zhao D, Wang Z, Wu J, Xu Y, Xiao G. Comparison of different drying methods on Chinese ginger (Zingiber officinale Roscoe):Changes in volatiles, chemical profile, antioxidant properties, and microstructure. Food Chem 2016;197:1292-300. [CrossRef]
41. Kumar PS, Nambi E, Shiva KN, Vaganan M, Ravi I, Jeyabaskaran KJ, et al. Thin layer drying kinetics of Banana var. Monthan (ABB):Influence of convective drying on nutritional quality, microstructure, thermal properties, color, and sensory characteristics. J Food Process Eng 2019;42:e13020. [CrossRef]
42. Tsamo CV, Andre CM, Ritter C, Tomekpe K, Newilah GN, Rogez H, et al. Characterization of Musa sp. fruits and plantain banana ripening stages according to their physicochemical attributes. J Agric Food Chem 2014;62:?-15. [CrossRef]
43. Babu AS, Parimalavalli R, Rudra SG. Effect of citric acid concentration and hydrolysis time on physicochemical properties of sweet potato starches. Int J Biol Macromol 2015;80:557-65. [CrossRef]