Research Article | Volume 14, Issue 2, March, 2026
Evaluating cytochrome C oxidase subunit 1 and NADH dehydrogenase 1 mitochondrial genes for five Buthidae scorpions with maximum likelihood, Bayesian inference, and parsimony analyses
The Buthidae family is a widespread family of scorpions distributed worldwide. Most of the lethal scorpions belong to this family, which comprises Androctonus, Leiurus, and Buthacus scorpion genera. Although morphological characteristics have various unclear phylogenetic relationships and characteristic polarity assumptions among these scorpion species, the molecular markers method is preferred by many researchers to determine genetic relationships between family members due to the variability of geographic areas and environmental factors associated with different habitats. The DNA barcoding system has been used in species comparison by sequencing conserved DNA standard loci sequences. This phylogeny study covered scorpion species from the following countries: Algeria, Morocco, Egypt, Tunisia, Sudan, and Iran to have more information on molecular identification between Androctonus species (Androctonus crassicauda, Androctonus bicolor, and Androctonus amoreuxi), Buthus species (Buthacus arenicola), and Leiurus species (Leiurus quinquestriatus) using cytochrome C oxidase subunit 1 (CO1) and NADH dehydrogenase 1 (ND1). Our results indicate that CO1 as a mitochondrial marker is a more informative molecular marker and reflects partial but not identical evolutionary patterns with ND1 that yielded inconsistent phylogenetic groupings, exhibiting fast evolutionary rates, and moderate-to-severe substitution saturation; the concatenated sequences provided higher resolution and support values, which demonstrates the worth of multigene investigations in scorpion systematics.
Aldeyarbi S, Abu Almaaty AH, Hassan MK. Evaluating cytochrome C oxidase subunit 1 and NADH dehydrogenase 1 mitochondrial genes for five Buthidae scorpions with maximum likelihood, Bayesian inference, and parsimony analyses. J Appl Biol Biotech 2026;14(2):131-144. http://doi.org/10.7324/JABB.2026.272599
A group of arthropods that have received the attention of many toxicologists and taxonomists for many decades is scorpions [1]. Except for some areas in the Pacific Islands and Antarctica, these arthropods are distributed worldwide and are considered the oldest of their kind. The order Scorpiones in the class Arachnida contains a single superfamily called Scorpionidae, which consists of 16 extant families. Buthidae family species are known for their toxicity to mankind. The family includes 73 genera. The diversity of Buthidae is divided between the New World (nine genera) and the Old World (64 genera) [1]. Various genera of this family inhabit Central Asia, the Middle East, and North Africa. Therefore, the old-world scorpion genera, known to be widely distributed in the Palearctic realm deserts [2].
Our study included three genera: Leiurus, Buthacus, and Androctonus from this family. First, Androctonus species are found in deserts from Togo to the Atlantic coast, as well as in semi-arid territories and across the African continent, extending from Egypt in the east to Morocco in the west [3,4]. Among these Androctonus species, Androctonusamoreuxi is primarily found in sandy deserts, whereas the second species, Androctonusbicolor, is distributed across Algeria, Tunisia, and Egypt [5]. The third species, Androctonus crassicauda, is localized in Asia and North Africa (Morocco, Egypt, and Sudan) [6]. Leiurus scorpions are mainly from the Arabian Peninsula, with 12 species described under this genus [7]. They are located in a vast geographical area and are highly adaptable to various habitats [8,9]. Leiurus quinquestriatus is distributed in several regions of Egypt and Sudan, though its presence in these areas is more restricted [7]. The Buthacus Birula (1908) genus is widely spread with about 22 identified species, dispersed across Asia, Africa, and the Arabian Peninsula [10]. Scorpions are a medically significant species. Many studies revealed the efficacy of crude scorpion venoms and some purified peptides against cancer cells through a different mechanism of action [11], and scorpions can produce antibacterial substances [12]. The geographical and individual variation in venom components among species has extreme importance in antivenom production, as well as comprehending the pathological manifestations of envenomation in patients. Moreover, the environmental and genetic aspects play a vital role in intragenic differences among the same species [13,14] even though scorpion envenomation is an agonizing problem in North Africa [15,16].
Egyptian scorpions have been around since the 5th dynasty (2465-2323) [17]. For 2300 years, many natural habitats have been under considerable changes in Egypt’s Delta Nile’s coastline and the Mediterranean’s coastline due to erosion that caused threats to coastal habitations. The changes in natural habitats continued to increase during the 19th and 20th centuries because of human industries. All these factors lead to many changes in the natural habitats and repel most living creatures away from coastlines [18]. Along with the natural habitat changes, there is a natural barrier as the Isthmus of Suez contributes to scorpion diversification by closing the route from the Asia part (Sinai Peninsula) and the African part (rest of Egypt) [19]. In considering all the changes in the environmental conditions, scorpion variation will occur morphologically and genetically to assist the adaptation to the new biological conditions [20-22]. Therefore, the recent genomic and cytogenetic studies suggest that the molecular evolution must be decoupled with the morphological characterization to clarify the variation in the family of Buthuidae species [22-24]. Recently, several studies have used molecular markers to interpret the phylogenetic relationship of many scorpions among and within populations [25-27]. Thus, molecular taxonomy usage is crucial in revealing the patterns of diversity that cannot be identified via traditional morphological analysis [20]. During the past 30 years, mitochondrial DNA (mtDNA) has served as the favored genetic marker in molecular diversity studies [28].
Previously, many studies have demonstrated that the cytochrome C oxidase subunit 1 (CO1) gene is a robust and widely used marker for taxonomy and phylogenetic studies in scorpions [23,29,30]. In contrast, only a few studies have explored the utility of the NADH dehydrogenase 1 (ND1) gene in scorpion systematics, and these works did not provide clear evidence about its reliability to be used as a phylogenetic marker [5,31].
Therefore, this study aims to evaluate the effectiveness of ND1 and provide information about the genetic distance, evolution, and intraspecific variation between Old World scorpion genera Androctonus, Buthus, and Leiurus from six countries, along with our Egyptian isolated species.
The subsequent sections detail the methodology, findings with discussion, and conclusion.
2. MATERIALS AND METHODS
2.1. Sampling
Scorpions were purchased from the Pet Trader, with specimens collected from five distinct ecological regions across the Sinai Peninsula and Egypt [Figure 1] between October 2017 and May 2018. The scorpions were kept alive in plastic containers until DNA extraction was performed.
Figure 1: Map representing the samples’ locations across Egypt. Symbols correspond to each specimen. (1) Androctonusbicolor (31°18’45.9”N 26°50’18.0”E), (2) Androctonus amoreuxi (31°22’33.1”N 30°40’20.2”E), (3) Androctonus crassicauda (28°42’36.8”N 33°48’34.2”E), (4) Buthacus arenicola (30°22’02.6”N 33°10’18.3”E), and (5) Leiurus quinquestriatus (24°14’14.6”N 32°56’43.1”E).
DNA was extracted from both preserved and fresh tissue muscles using the QIAamp DNA Mini Kit (Qiagen, #56304), following the protocol provided by the manufacturer. In brief, tissue samples were dissected and homogenized in alanine aminotransferase buffer, followed by digestion (lysis step) with proteinase K. For DNA precipitation, AL buffer and 99% ethanol were added. The purification process involved washes with AW1 and AW2 buffers. The final DNA eluates were stored at 4°C in the AE buffer until further analysis.
2.3. MtDNA Fragment Amplification
Two mitochondrial gene fragments, CO1 and ND1, were amplified using polymerase chain reaction (PCR). Each PCR was carried out in a total volume of 25 μL, comprising for each primer (10 pmol) a 1.0 μL, MgCl2 mixed with Taq ReadyMix PCR Reaction Mix 12.5 μL, purified DNA template 1.0 μL, and distilled water 9.5 μL. The PCR reactions were conducted for 35 cycles to obtain sufficient amplification of the target regions and to prevent non-specific products. The annealing temperatures were designed according to the melting temperatures (Tm) of the primers as follows: of 48°C for CO1 (Folmer et al., 1994), and 52°C for ND1 (Hedin, 1997), which are known as appropriate annealing temperatures for arthropods, and resulted in clear single-band products on agarose gel electrophoresis when tested, thus we kept using the same Tm as it used in the previous research [Table 1].
Table 1: List of primers and PCR conditions used for molecular analyses.
PCR conditions start with an initial denaturation at 94°C for 180 s (3 min). This is followed by 35 cycling steps, with the temperature (°C) of each step indicated, along with the corresponding time in seconds for denaturation, annealing, and extension, respectively. Finally, a final extension step occurs at 72°C for 300 s (5 min). Afterward, the samples are stored at 12°C until they are removed from the thermocycler. CO1: Cytochrome C oxidase subunit 1, ND1: NADH dehydrogenase 1, PCR: Polymerase chain reaction.
2.4. Sequencing and Submitting Genes to the NCBI
Sequencing of amplicons was performed via the standard protocol (Sanger method), in which samples were sequenced in the Macrogen company (Seoul, Republic of Korea). The 10 genes were submitted to GenBank [Table 2] after they had been viewed and checked manually for sequencing errors by ChromasPro1.41 (http://www.technelysium.com.au).
Table 2: The five scorpion species that are collected from Egypt, along with their corresponding GenBank accession numbers.
Taxon
Description*
CO1 Accession
ND1 Accession
Country
Androctonus amoreuxi
Egy
MT629926
MT702987
Egypt
Androctonus bicolor
Egy
MT636859
MT702989
Egypt
Androctonus crassicauda
Egy
MT636858
MT702988
Egypt
Buthacus arenicola
Egy
MT636861
MT702991
Egypt
Leiurus quinquestriatus
Egy
MT636860
MT702990
Egypt
All sequences were submitted to the NCBI GenBank database under the accession numbers listed for both CO1 and ND. *Description (representing the location) will be used as a unique identifier after each taxon name to facilitate the identification and tracking of each isolate in subsequent analyses. CO1: Cytochrome C oxidase subunit 1, ND1: NADH dehydrogenase 1.
2.5. Datasets Preparation (Retrieval and Analysis)
The sequences of each gene CO1 and ND1 were blasted individually in the NCBI to find the similarity and to compare them with the sequences that have been recorded. The samples with the highest query coverage were retrieved from GenBank. [Table 3] contains the CO1 sequences [32], [Table 4] contains the ND1 sequences, and [Table 5] contains the combined data set.
Table 3: Samples with the highest query coverage with the blasted CO1 genes were retrieved from the GenBank.
Taxon
Description*
Accession
Country
Androctonus amoreuxi
A.AM1
KJ538275.1
Algeria
Androctonus amoreuxi
M.AM1.1
KJ538282.1
Morocco
Androctonus amoreuxi
M.AM1.2
KJ538286.1
Morocco
Androctonus amoreuxi
A.AM2
KJ538427.1
Algeria
Androctonus amoreuxi
M.AM2.1
KJ538429.1
Morocco
Androctonus amoreuxi
M.AM2.2
KJ538433.1
Morocco
Androctonus amoreuxi
E.AM3.1
KJ538478.1
Egypt
Androctonus amoreuxi
E.AM3.2
KJ538480.1
Egypt
Androctonus bicolor
A.B
KJ538320.1
Algeria
Androctonus bicolor
T.B.1
KJ538325.1
Tunisia
Androctonus bicolor
T.B.2
KJ538329.1
Tunisia
Androctonus bicolor
E
KF548120.1
Egypt
Androctonus bicolor
E.B
KJ538333.1
Egypt
Leiurus quinquestriatus
SU1
KX648421.1
Sudan
Androctonus crassicauda
IN.1
MH352603.1
Iran
Androctonus crassicauda
IN.2
MH352604.1
Iran
Androctonus crassicauda
IN.3
MH352605.1
Iran
Androctonus crassicauda
IN.4
MH352606.1
Iran
Didymocentrus kraus
D. krausi
KM514633.1
Central American
These reference sequences were selected for comparison based on their high sequence similarity to our isolated samples and were used in subsequent phylogenetic analyses.
Description (representing the location) will be used as a unique identifier after each taxon name to facilitate the identification and tracking of each species in subsequent analyses. CO1: Cytochrome C oxidase subunit 1.
Table 4: The ND1 gene BLAST results that have query coverage 80% and above were retrieved from GenBank.
Taxon
Description*
Accession
Country
Androctonus bicolor
T
KJ538326.1
Tunisia
Androctonus cf. gonneti
M
KJ538378.1
Morocco
Androctonus amoreuxi
A
KJ538424.1
Algeria
Androctonus amoreuxi
T
KJ538440.1
Tunisia
Androctonus crassicauda
Iran
MH352597.1
Iran
Didymocentrus krausi
D. krausi
MK049535.1
Central American
These reference sequences were selected for comparison based on their availability, sequence similarity to our isolated samples, and were used in subsequent phylogenetic analyses.
Description (representing the location) will be used as a unique identifier after each taxon name to facilitate the identification and tracking of each species in subsequent analyses. ND1: NADH dehydrogenase 1.
Table 5: Samples containing both the ND1 and CO1 gene sequences were retrieved from GenBank (without query coverage threshold).
Taxon
Description*
CO1Accession
ND1Accession
Country
Androctonus amoreuxi
A.AM1
KJ538275
KJ538276
Algeria
Androctonus amoreuxi
M.AM1
KJ538282
KJ538283
Morocco
Androctonus amoreuxi
M.AM1.2
KJ538286
KJ538287
Morocco
Androctonus amoreuxi
A.AM2
KJ538423
KJ538424
Algeria
Androctonus amoreuxi
M.AM2
KJ538429
KJ538430
Morocco
Androctonus amoreuxi
T.AM2
KJ538439
KJ538440
Tunisia
Androctonus amoreuxi
T.AM2.2
KJ538443
KJ538444
Tunisia
Androctonus bicolor
T.B
KJ538325
KJ538326
Tunisia
Androctonus bicolor
T.B.2
KJ538329
KJ538330
Tunisia
Androctonus bicolor
E.B
KJ538334
KJ538333
Egypt
These reference sequences were selected based on their origin from the same scorpion specimen, allowing the combination of both genes into a concatenated dataset for phylogenetic analysis to improve testing accuracy.
Description (representing the location) will be used as a unique identifier after each taxon name to facilitate the identification and tracking of each species in subsequent analyses. CO1: Cytochrome C oxidase subunit 1, ND1: NADH dehydrogenase 1.
Sequences were edited via MEGA-X [33], in which ambiguous alignment positions were identified and excluded before phylogenetic analysis manually, and aligned with ClustalW (default settings), which is the following settings: Gap opening penalty = 10.0, gap extension penalty = 0.10 (pairwise) and 0.20 (multiple), and enabling the Gonnet substitution matrix with residue-specific and hydrophilic penalties [34]. Maximum Parsimony (MP), Bayesian Inference (BI), and Maximum Likelihood (ML) were used in phylogeny reconstruction. Three programs were used in PAUP [35], the MRBAYES software [36], and MEGA-X, respectively.
PAUP v. 4.0b10a (Swofford, 2000) is used in phylogenetic reconstruction analysis, treating characters without ordering and under equal weights. Heuristic search strategies applied tree-bisection-reconnection (TBR) branch swapping across 1000 replicates of random-taxon addition, with each replicate retaining a maximum of 20 trees. The resulting trees experienced a second round of TBR swapping, capped at 20,000 saved trees. Clade support was subsequently assessed via non-parametric bootstrap analysis (MP-BT), utilizing 1000 pseudo-replicates of simple taxon addition, followed by TBR swapping, and limiting 15 trees per replicate output [37].
For the three datasets, MEGA-X was used under the Akaike Information Criterion (AIC) criterion to determine the best-fitting sequence evolution models. ML trees were performed using MEGA-X, utilizing 5000 replicates to calculate support values of branch bootstraps. Then the program was used for calculating the mean genetic distances within and between clades by operating 4000 bootstrap replicates for variance and p-distances estimation. Furthermore, heatmaps have been generated using R with the “Pheatmap” package [38].
MrBayes 3.0 software was used in phylogenetic reconstruction using a Bayesian approach [36]. Markov chains (three heated and one cold), which are four chains operated in two parallel searches under the default temperature, setting the chains’ length to 10 million generations, with sampling conducted every 100 generations. The initial 10% of sampled trees were excluded as burn-in. In addition, substitution model parameters were selected based on the AIC. Bayesian posterior probabilities were derived from a 50% majority-rule consensus tree, constructed from the post-burn-in samples after the Markov chains reached stationarity.
The neutrality test was conducted in R (version 4.5.1) using the ape package. For each dataset, Tajima’s D values were calculated, and statistical significance was assessed using both normal approximation and beta distribution-based P-values [39]. Statistics were from the vegan, whereas Pairwise distance matrices were calculated using the Euclidean distance metric, and the Mantel statistic was based on Pearson’s product-moment correlation with 999 permutations to assess statistical significance [40]. In addition, we used packages: phangorn and seqinr to analyze the saturation test and nucleotide composition test, respectively, to assess the ND1 gene marker. The Index of Substitution Saturation (Iss) test was conducted and customized using the DAMBE algorithm, and Iss values were calculated with the calc_Iss() function. Critical Iss values (Iss.cSym and Iss.cAsym) were obtained based on the number of taxa, and a bootstrap distribution of Iss values was generated with 1000 replicates [41-43].
3. RESULTS
3.1. Sequenced Data
The phylogenetic reconstruction was performed from 3 different datasets. The first dataset is all CO1 genes [Tables 2 and 3] and consists of an alignment of 24 sequences with 1078 sites; the monomorphic sites (constant) were 411, the polymorphic sites (variable) were 176, and the parsimony informative sites were 126. The second dataset is all ND1 genes [Tables 2 and 4] and consists of an alignment of 11 sequences with 438 sites,43 of which were monomorphic (invariable) sites, 293 were polymorphic (variable) sites, and about 235 sites were parsimony informative. While the third dataset used was the combined dataset of CO1 and ND1 [Tables 2 and 5], it consisted of an alignment of 16 sequences containing 1704 sites. Within this alignment, 180 sites were monomorphic (constant), 562 sites exhibited variation (polymorphic), and 340 sites were parsimony-informative.
To test for departure from neutrality, Tajima’s D test was performed for the CO1, ND1, and concatenated mitochondrial sequences. CO1 and ND1: The D value for CO1 as well as for ND1 was positive but not significant (CO1: D = 0.694, P > 0.05; ND1: D = 1.127, P > 0.05). By comparison, the concatenated dataset yielded a significantly negative D value (D = −2.104, P < 0.05) [Table 6]. However, for assessing the correlation between the genetic distance of CO1 and ND1, we performed a Mantel test, which yielded a significant correlation coefficient (Mantel r = 0.42, P = 0.006; based on 999 permutations) [Figure 2a].
Table 6: Tajima’s D test results for CO1, ND1, and concatenated mitochondrial sequences.
Dataset
Tajima’s D
P-value (normal)
P-value (beta)
Interpretation
CO1
0.694
0.488
0.502
Neutral: No significant deviation
ND1
1.127
0.260
0.298
Neutral: No significant deviation
Concatenated
–2.104
0.035
0.011
Natural selection: Significant negative deviation
CO1: Cytochrome C oxidase subunit 1, ND1: NADH dehydrogenase 1.
Figure 2: (a) Comparison of genetic distance matrices derived from cytochrome C oxidase subunit 1 and NADH dehydrogenase 1 (ND1) genes using a Mantel test. A significant positive correlation (Mantel r = 0.42, P = 0.006) was observed between the two datasets, indicating harmonious phylogenetic signals. (b) Saturation test (ND1 dataset) revealing the saturation pattern of transition levels over time, indicating the divergence/mutation over time distance. (c) Base composition test in ND1 dataset: showed elevation in thymine (T) and Adenine (A) content, while a highly reduction in cytosine (c) and Guanine across samples. (d) Index of Substitution Saturation (Iss) for the ND1 dataset, using 1000 bootstrap replicates (error bar = 95% CI), the observed Iss (red), symmetrical (green), and asymmetrical (blue) topologies are shown for comparison. Because the observed Iss is far above the symmetrical threshold but slightly above the asymmetrical threshold, ND1 exhibits moderate-to-strong substitution saturation, indicating reduced phylogenetic reliability.
A total of 24 specimens with the outgroup have been used to construct the Phylogenetic distance heatmap [Figure 3], the BI tree [Figure 4], and the pairwise distance [Table 7].
Figure 3: Phylogenetic distance heatmap using the Cytochrome C oxidase subunit 1 sequences. The dendrograms on the top and left sides reveal the hierarchical clustering of the species based on their genetic distances. Red or orange colors indicate greater genetic distances, while blue or faint blue colors represent closer genetic distances. The scale bar on the right reflects the range of pairwise p-distances.
Table 7: Dataset 1 (CO1 data): Genetic distances between and within groups using Maximum Likelihood and Bayesian Inference analysis.
Distance between clades
Within clades
A1
0.0750
0.0923
0.0820
0.0902
0.1026
0.0882
0.1074
0.1124
0.1870
0.010
0.003
A1
A2
0.0750
0.0876
0.0821
0.0979
0.1022
0.1001
0.1153
0.1168
0.1873
0.025
0.005
A2
B
0.0923
0.0876
0.0985
0.0986
0.1111
0.0991
0.1047
0.1074
0.1925
0.003
0.002
B
C1
0.0820
0.0821
0.0985
0.0760
0.1071
0.0971
0.1146
0.1141
0.1887
0.000
0.000
C1
C2
0.0902
0.0979
0.0986
0.0760
0.1122
0.1011
0.1120
0.1088
0.1996
0.031
0.006
C2
D
0.1026
0.1022
0.1111
0.1071
0.1122
0.0799
0.1071
0.1080
0.1803
0.000
0.000
D
E
0.0882
0.1001
0.0991
0.0971
0.1011
0.0799
0.1056
0.1074
0.1792
0.000
0.000
E
F1
0.1074
0.1153
0.1047
0.1146
0.1120
0.1071
0.1056
0.0142
0.1716
0.005
0.003
F1
F2
0.1124
0.1168
0.1074
0.1141
0.1088
0.1080
0.1074
0.0142
0.1728
n/c
n/c
F2
OUT.G
0.1870
0.1873
0.1925
0.1887
0.1996
0.1803
0.1792
0.1716
0.1728
n/c
n/c
OUT.G
A1
A2
B
C1
C2
D
E
F1
F2
OUT.G
P-distances
Standard error
The table displays pairwise p-distances between clades (below the diagonal) and within-clade genetic distances (last two columns). These genetic distances were used to support phylogenetic differentiation among clades and evaluate intra- and interspecific variation within dataset 1. *Values marked as n/c indicate that the genetic distance could not be calculated due to insufficient data. CO1: Cytochrome C oxidase subunit 1.
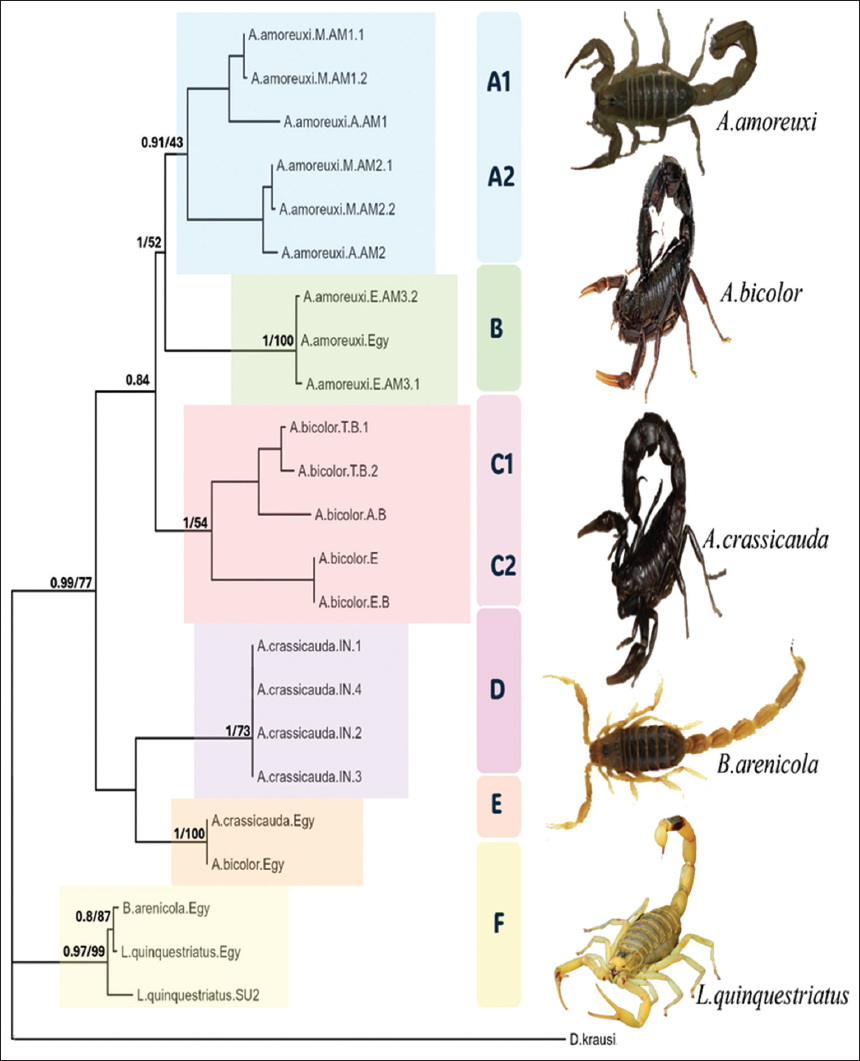
Figure 4: Bayesian Inference (BI) tree (50% majority rule consensus tree) of Cytochrome C oxidase subunit 1 data (dataset 1), which represents 25 species with the outgroup. Numbers above branches represent, respectively, the posterior probabilities of the BI analysis nodes and the nodes’ maximum likelihood bootstrap values. Clades (A-F) and subclades are shaded in distinct colors.
Six clades are performed. A. amoreuxi is presented in two clades, A and B. A1 and A2 are sister groups of Clade A that have a high support value (BI = 0.91) but a low ML value. In the A1 and A2 clades, there are two Moroccan specimens of A. amoreuxi, and one is from Algeria in each clade. While the B clade contains all specimens from Egypt, including our species, that have been collected from Baltim in the Kafr El-Sheikh Governorate. Clade B has a high supportive value (BI = 1; ML = 100) for pairwise distances of these clades ranging from 7.5% to 9.23%. According to the genetic distance within Clades [Table 7], A2 shows the highest distance, which is about 2.5%, while Clade B shows the lowest distance, about 0.3%.
A. bicolor is divided into two Clades, Clade C with supportive value (BI = 1; ML = 54), and it contains two sister groups, C1 and C2. C1 contains two Egyptian specimens, and C2 contains two Tunisian specimens and one specimen from Algeria. While clade E with high supportive value (BI = 1; ML = 100) contains two different types of specimens, both are Androctonus, both of them are our specimens, and they are A. bicolor and A. crassicauda. The specimen A. bicolor was collected from Matrouh (west of Alexandria). The genetic divergence among these clades ranges between 7.6% and 10%, with Clade C2 exhibiting the highest intra-clade variation at 3.1%.
A. crassicauda is found in two Clades, D and E. As shown previously, Clade E contains two different species, A. bicolor and A. crassicauda. The A. crassicauda is located in the southern area of the Sinai Peninsula. Clade D has a supportive value (BI = 1; ML = 73). All specimens in clade D are from Iran. 7.99% is the pairwise distance between D and E.
Clade F has two subclades (F1, F2), which are sister groups with a supportive Bayesian value (0.97) and an ML value (99%). The F clade contains two different species, L. quinquestriatus and Buthacusarenicola. Both of these species are found in subclade F1 with supportive value (BI = 0.8; ML = 87), and they are Egyptian specimens. L. quinquestriatus was collected from south Egypt in Aswan, while B. arenicola has been collected from Sinai, El Maghara. The F2 clade also contains an L. quinquestriatus specimen, but it’s isolated from Sudan. The pairwise genetic distance between the subclades is 1.42%. 0.5% is the genetic distance within the F1 clade.
3.3. ND1 Dataset 2
Six different species have been represented in the ND1 distance heatmap [Figure 5], the BI tree [Figure 6], and the pairwise distance [shown here as Table 8]. The data were taken from the blast’s result, which had above 80% query coverage (the low query coverage due to a few results submitted in Genbank for this gene). There is a total of 10 specimens used in the analysis, forming four clades.
Figure 5: Phylogenetic distance heatmap using the NADH dehydrogenase 1 (ND1) sequences. The dendrograms on the top and left sides reveal the hierarchical clustering of the species based on their genetic distances. Red or orange colors indicate greater genetic distances, while blue or faint blue colors represent closer genetic distances. The scale bar on the right reflects the range of pairwise p-distances. However, the test using ND1 sequences is not reliable because it causes the outgroup (Didymocentrus krausi) to appear closer to the other species.
Table 8: Dataset 2 (ND1 data): Genetic distances between and within groups using Maximum Likelihood and Bayesian Inference analysis.
Distance between clades
Within clades
A
0.1441
0.1461
0.6056
0.6048
0.5570
0.141
0.0139
A
B
0.1441
0.1058
0.6022
0.6023
0.5158
0.0048
0.0034
B
C
0.1461
0.1058
0.5845
0.5984
0.5079
n/c
n/c
C
D.1
0.6056
0.6022
0.5845
0.1744
0.6329
0.0106
0.0052
D.1
D.2
0.6048
0.6023
0.5984
0.1744
0.6698
0.005
0.0035
D.2
OUT.G
0.5570
0.5158
0.5079
0.6329
0.6698
n/c
n/c
OUT.G
A
B
C
D.1
D.2
OUT.G
p-distances
Standard error
The table displays pairwise p-distances between clades (below the diagonal) and within-clade genetic distances (last two columns). These genetic distances were used to support phylogenetic differentiation among clades and evaluate intra- and interspecific variation within dataset 2. *Values marked as n/c indicate that the genetic distance could not be calculated due to insufficient data.
Figure 6: Bayesian Inference (BI) tree based on NADH dehydrogenase 1 data (Dataset 2), presented as a 50% majority-rule consensus tree, which represents 11 species with the outgroup. Numbers shown above the branches represent the posterior probabilities from the BI analysis, followed by the bootstrap support values from the Maximum Likelihood analysis, respectively. These values indicate the statistical support for each node in both phylogenetic reconstructions. Clades (A-D) and subclades are shaded in distinct colors.
Clade A has three different species: A. amoreuxi, A. crassicauda, and Androctonuscf. gonneti. The Bayesian supportive value (0.94, but the ML bootstrap value is low. A. amoreuxi and A. crassicauda (BI = 0.99; ML = 96) are sister groups with A. cf. gonneti. A. cf. gonneti specimen is from Morocco, A. crassicauda is from Iran, and A. amoreuxi is our Egyptian sample. The within Clade A mean genetic distance is 14.1%.
Apparently, Clade B is the sister Clade for A, with strong support value (BI = 1; ML = 99). Two A. amoreuxi specimens are in clade B, one from Tunisia and the other from Algeria. The pairwise distance between clades A and B is 14.1%, while the p-distance within Clade B is 0.48%.
A. bicolor is found in two clades, one of which is a terminal taxon (clade C) and the other is in clade D2. The specimen from clade C is from Tunisia, and the specimen from clade D2 is Egyptian. A high pairwise genetic distance between the two clades equals 59.8%.
Clade D: This clade has two subclades, D1 and D2. Clade D contains four different species, and the four species are Egyptian. It has a support value (BI = 1; ML = 100) in which the highest support value is within the tree. D1 has support value (BI = 0.88; ML = 93), while D2 has support value (BI = 1; ML = 85). B. arenicola, along with A. crassicauda, are in clade D1. L. quinquestriatus and A. bicolor are in clade D2. Lastly, the pairwise distance between these clades is 17.4%. The genetic distance within the clades is 1.06% for clade D1 and 0.5% for clade D2.
The saturation analysis for this dataset revealed a characteristic saturation due to transitions leveling corresponding to a higher divergence number [Figure 2b]. This could indicate that ND1 is approaching substitutional saturation; thus Substitution saturation test applied, which revealed that ND1 (11 taxa, 438 bp) is affected by moderate-to-severe substitution saturation due to the observed Iss was higher than critical value of symmetrical topology by 0.286 and slightly higher than the asymmetrical topology by 0.024, suggesting that its phylogenetic signal is only partially reliable [Figure 2d] [43]. However, examination of base composition across taxa showed a significant bias in ND1 sequences [Figure 2c], with always even more strongly biased T/A than G/C.
3.4. Concatenation Dataset 3
About fifteen combined sequences of ND1 and CO1 were used in the analysis of the ND1 distance heatmap [Figure 7], the BI tree [Figure 8], and the pairwise distance [Table 9].
Figure 7: Heatmap of pairwise genetic distances based on concatenated Cytochrome C oxidase subunit 1 and NADH dehydrogenase 1 gene sequences. The dendrograms on the top and left sides reveal the hierarchical clustering of the species based on their genetic distances. Red or orange colors indicate greater genetic distances, while blue or faint blue colors represent closer genetic distances. Notably, samples from Androctonus amoreuxi and Androctonus bicolor show tight clustering, suggesting close genetic relationships, whereas species like Didymocentrus krausi and Leiurus quinquestriatus are more genetically distinct.
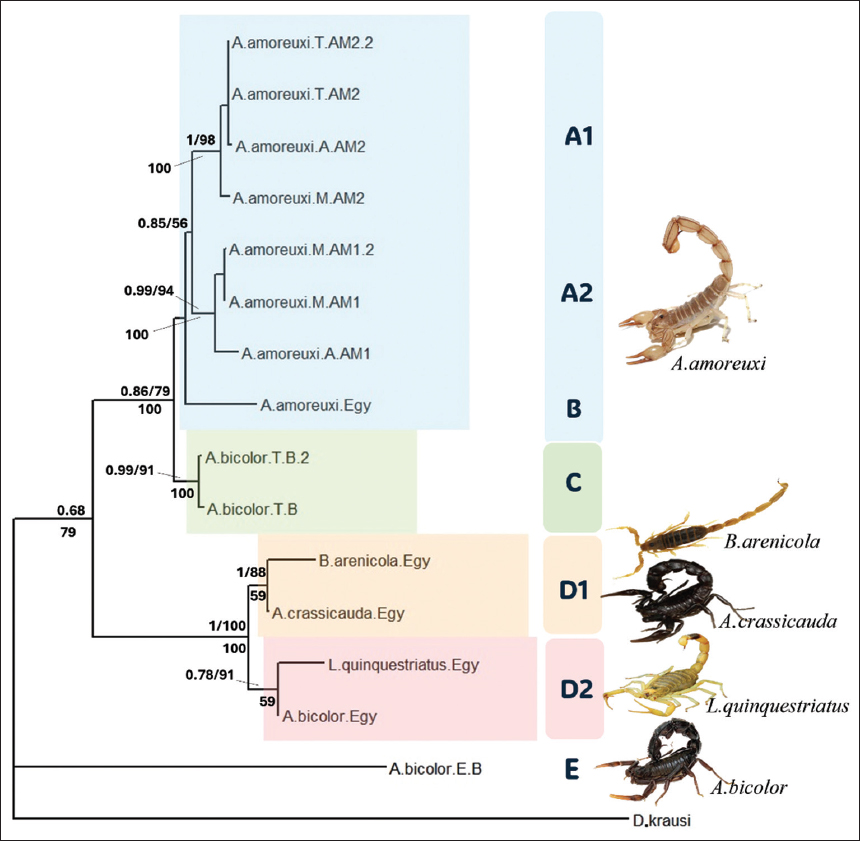
Figure 8: Bayesian inference (BI) phylogenetic tree based on concatenated Cytochrome C oxidase subunit 1 and NADH dehydrogenase 1 sequences (Dataset 3), which represents 16 species with the outgroup. This 50% majority-rule consensus tree illustrates the phylogenetic relationships among scorpion samples. Posterior probabilities from the BI analysis are shown above the branches, followed by bootstrap support values from the Maximum Likelihood analysis. Non-parametric bootstrap values from the Maximum Parsimony analysis (based on 1000 replicates) are indicated below the branches. Clades (A-E) and subclades are shaded in distinct colors.
Table 9:Dataset 3 (concatenated data): Genetic distances between and within groups using Maximum Likelihood, Bayesian Inference analysis, and parsimony analysis.
Distance between clades
Within clades
A.1
0.0082
0.0100
0.0087
0.0135
0.0139
0.0172
0.0139
0.012
0.0024
A.1
A.2
0.0902
0.0097
0.0086
0.0134
0.0136
0.0171
0.0136
0.029
0.0042
A.2
B
0.1254
0.1223
0.0105
0.0139
0.0142
0.0177
0.0142
n/c
n/c
B
C
0.0927
0.0955
0.1303
0.0137
0.0139
0.0172
0.0139
0.0088
0.0029
C
D.1
0.2973
0.2913
0.2919
0.2960
0.0085
0.0169
0.0085
0.068
0.008
D.1
D.2
0.2971
0.2900
0.2953
0.2895
0.1008
0.0172
0.0139
0.065
0.007
D.2
E
0.5491
0.5415
0.5263
0.5385
0.6231
0.6171
0.0172
n/c
n/c
E
OUT.G
0.7501
0.7602
0.6061
0.6358
0.7409
0.6034
0.7123
n/c
n/c
OUT.G
A1
A2
B
C
D.1
D.2
E
OUT.G
p-distances
St. err.
The table displays pairwise p-distances between clades (below the diagonal) and within-clade genetic distances (last two columns). These genetic distances were used to support phylogenetic differentiation among clades and evaluate intra- and interspecific variation within dataset 3. *Values marked as n/c indicate that the genetic distance could not be calculated due to insufficient data.
Clades A and B contain all A. amoreuxi specimens. In which A. amoreuxi forms monophyletic units. Clades A and B were placed as a sister group with a supportive value of BI of 0.85 and an ML of 56%, but with a low MP value of 53. A1 clade contains two Tunisian A. amoreuxi specimens, one Moroccan, and one from Algeria. The support value for Clade is (BI = 1; ML = 98; PM = 100). For the A2 clade, there are two Moroccan specimens and one Algerian. The support value is (BI = 0.99; ML = 94; PM = 100). Clade B has only one terminal taxon, which is A. amoreuxi (the sample we collected from Egypt). The pairwise distances between A1, A2, and B clades are in the range between 9.02% and 12.54%. The p-distance within groups is A1 1.2% and A1 2.9%.
A. bicolor is divided into three clades (C, D.2, and E). The two Tunisian specimens found in clade C have (BI = 0.99; ML = 91; MP = 100) support values. Clades D.2 and E each have an Egyptian specimen. The pairwise distances between these clades are 29.6% to 62.31%. Clade C has the lowest divergence within clades, which is 0.88%.
L. quinquestriatus, A. crassicauda, and B. arenicola are in clade D along with A. bicolor. All specimens in clade D are our collected samples from Egypt. Clade D has (BI = 1; ML = 100 and MP = 100) support values, and it is divided into two subclades. Clade D.2 contains A. bicolor and L. quinquestriatus with support values (BI = 1; ML = 88). While the clade D.1 with (BI = 0.78; ML = 91) support values contains A. crassicauda and B. arenicola. 59 is the MP value, and it’s equal in both subclades. The pairwise distance between the two subclades is 10%. The P-distance is the highest in D.2, 6.8%.
4. DISCUSSION
The Isthmus of Suez, the river Nile, Mediterranean coastline erosion, and also the climate changes due to human industries, all of these factors caused genetic diversity and gene flow in scorpion populations, and the genetic variation among different scorpion species from various areas will eventually lead to intraspecific variation [19,44-47]. Meanwhile, the deviation of neutral evolution was tested by Tajima’s D test, and the values for CO1 (D = 0.694, P > 0.05) and ND1 (D = 0.694, P > 0.05) were estimated as positive and not significant, suggesting a neutral evolution with the uniform mutation and genetic drift among individuals. In contrast, the concatenated dataset (D = −2.104, P < 0.05), showing significantly negative Tajima’s D, indicates neutral deviation (not random mutation), presumably reflective of natural selection associated with adaptation to their physical environment, reflecting demographic history, or the effect of limited sample size [48].
While the differences in the statistical tests are likely due to the fact that each gene alone has a limited number of sites (CO1 ~1000 bp, ND1 ~400 bp) but the combined sequences (~1700 bp) increased the statistical power, reduced the random noise, and easier for pattern detection, which translates to decreased variance and increased ability to detect evolutionary signals that the individuals’ datasets lacked, and this underscores the importance of using concatenated data sets to capture broader patterns of evolution which otherwise would be missed if loci were examined separately. Altogether, they illustrate the interaction of geographic barriers, demography, and selection in determining genetic structure and potential of adaptive scorpion populations.
To assess the similarity in clustering patterns observed in the CO1 and ND1 heatmaps [Figures 3 and 5], the Mantel test result showed a moderate significance of correlation, which means that they have a similarity in their evolutionary pattern [Figure 2a]. This finding is not surprising as both CO1 and ND1 are components of the mitochondrial genome and are maternally inherited [24]. Although the heatmaps look similar, this is due to the coincidence of underlying biological patterns and not redundancy or data overlap. Meanwhile, ND1 base composition analysis showed that (A+T > C+G) content, which is aligned with previous studies of arthropods, and particularly, scorpions, is considered a conserved feature of scorpion mitogenomes [49,50]. However, the ND1 saturation analysis and even the Iss test showed a limitation of using this gene as a marker due to exhibiting fast evolutionary rates, as transitions plateaued with increasing genetic distance and exceeding both the symmetrical and asymmetrical critical thresholds, potentially compromising its reliability for species-level resolution, which obscures deeper evolutionary relationships when relying solely on it, and may be the reason for making weakly supported group in tree topology of BI and ML [51]. In addition, this gene showed the same features that were represented by Galtier et al. about exhibiting features like highly variable and possessing complex mutations, which their study describes that the mtgenome has the worst phylogenetic molecular markers [28].
In the comparison upon taxon level, A. amoreuxi (Audouin, 1826): the habitat of this species in Egypt is in arid and hyper-arid regions that cover the Sandy areas with shrubby vegetation [52]. Our sample has been collected from Baltim. The two CO1 data and concatenation data analysis of Bayesian trees (BI) gave monophyletic clusters belonging to A. amoreuxi. In another phylogenetic study of some Androctonus species resulted in Androctonus australis, A. amoreuxi, and A. crassicauda gonneti species clustered together in the phylogenetic relationship [53]. ND1 tree confirmed the latter statement A. amoreuxi clustered with A. crassicauda gonneti from Morocco as a sister group with a high support value (BI = 0.94), and it is found in the same clade as A. crassicauda from Iran. On the other hand, the three species A. australis, A. amoreuxi, and A. crassicaudagonneti did not yield the same result as previous studies, in which the three species were found in separate clades [5]. According to the MP analysis, Androctonus aeneas and A. amoreuxi are two sister clades [26], which supports the result of the CO1 and concatenation consensus trees. Whereas A. bicolor, which is known as A. aeneas, might belong to the A. amoreuxi [5,25]. But in morphology, both are completely different and easily recognizable.
A. bicolor (Ehrenberg, 1828): lives in arid regions, rocky habitats with scrub vegetation cover, and sand patches. This species was collected from Matruh. In the CO1 consensus BI tree, A. bicolor was found with A. crassicauda in the same clade (E) with a high support value in both BI and ML. While it is not clustered with the other A. bicolor from Egypt, Tunisia, and Algeria, A. crassicauda gonneti is not in a cluster with A. bicolor, and both are in totally different clades according to the BI phylogenetic relationship by Coelho et al. [5]. ND1 and concatenated consensus trees, A. bicolor was in the same clade as L. quinquestriatus, and both clades have high support value for BI and ML in each tree.
A. crassicauda (Olivier, 1807): habitats are in sandy coastal areas in arid regions and rocky areas. Our sample has been collected from the south Sinai Peninsula. Bayatzadeh conducted a Phylogenetic investigation using the Neighbor-Joining method to examine neurotoxin homology among scorpion species, focusing on AnCra1 and Na+V toxins. The study used 26 specific Na+V toxin sequences from Buthidae, along with the AnCra1 sequence from A. crassicauda. As a result, both A. bicolor and A. crassicauda had a high support value (81), as well as 97% homology with Neurotoxin 8, which is highly significant [54]. CO1 BI tree A. crassicauda clustered in the same clade with A. bicolor, but that is not the case in ND1 and concatenated BI trees; both trees gave the same result that A. crassicauda and B. arenicola are in the same clade with a high support value for ML and BI analysis. However, this result contradicts another research analysis that used a different gene, which estimated the estimation of evolutionary divergence between 16S rRNA sequences of A. crassicauda from southeast Anatolia in Turkey and B. arenicola from North Sinai and Northwestern Egypt, which was conducted using the Tamura-Nei 22%, and this percentage is a high in pairwise distance between the two species [55]. But that is not enough to reject our result because the A. crassicauda they used to be from Turkey. Likewise, A. crassicauda in both CO1 and ND1 trees were not in a cluster with their species that is isolated from Iran, and that may represent that the A. crassicauda lineage in Egypt is different genetically from those from Iran because they are different populations. Additionally, our findings matched the study that used CO1 gene in two populations of A. crassicauda, which are from Saudi Arabia and Iran, that revealed highly significant genetic diversity [56].
B. arenicola (Simon, 1885): A distinct subspecies may be depicted among B.arenicola specimens, ranging from Egypt to northern Algeria [52,57]. Furthermore, molecular studies have proven that B. arenicola from Matrouh, El Daba (Northwestern Egypt), and those from North Sinai are genetically identical (D = 0) [55]. Moreover, Simon confirmed that the specimens from Egypt belonging to B. arenicola are from Sinai. The B. arenicola samples were from Sina El Maghara. There is no available sequence data on the CO1 or ND1 genes about this species in the gene bank.
L. quinquestriatus (Ehrenberg, 1828): those species are adapted to a vast majority of substrates, like mesic, hyper-arid, and arid areas [52]. The L. quinquestriatus specimen that was included in this study is from Aswan; nevertheless, they are localized in many geographical areas across Egypt [19]. L. quinquestriatus is grouped with A. bicolor in the same clade in both ND1 and Concatenation analysis trees, but clearly, they are different genera. In a phylogenetic analysis by Fet et al. of the family Buthidae (17 genera), their results suggested that both Old World scorpion genera Leiurus and Androctonus may associate with each other than with any other genus described in their study, and they support that these genera are known to be the origin of the Old World Buthidae lineage, with the most powerful neurotoxic venom [2]. There is a study that used sodium dodecyl sulfate-polyacrylamide gel electrophoresis protein profile in measuring protein concentration in venoms, showing that the venoms belong to well-known Egyptian scorpion species isolated from diverse areas across Egypt: O. innesi, B. arenicola, A. bicolor, A. crassicauda, Scorpio marus palmatus, L. quinquestriatus, A. amoreuxi, and A. australis. which used their venom protein profiles instead of traditional morphological approaches for the taxonomical investigation. Accordingly to their study, the protein profile of A. bicolor and L. quinquestriatus showed a major similarity equal to 0.83, which is high [58]. The protein profile analysis supported the result of both ND1 and concatenation BI trees. Also, protein profiles of A. crassicauda and A. bicolor gave minor similarity (S = 0.26), which also supports both ND1 and the Concatenation tree.
Several limitations should be acknowledged. First, morphological and ecological data were not incorporated, which their inclusion could have strengthened species delimitation when combined with genetic evidence. Second, the comparative dataset was limited, as publicly available reference sequences for many scorpion species remain insufficient, which restricted the breadth of our analysis. Finally, our sampling was confined to specific regions and populations, which may not have fully captured the full scope of genetic variation across the species’ distribution.
5. CONCLUSION
Environmental and geographical barriers, such as the Isthmus of Suez, the Nile River, coast erosion, and climatic change, have resulted in genetic differences and gene flow among Egyptian scorpion populations. In addition, the phylogenetic position of L. quinquestriatus, B. arenicola, A. crassicauda, A. bicolor, and A. amoreuxi from different habitats around the world is known to have separate lineages and potential cryptic diversity. To evaluate evolutionary patterns, this study aimed to assess the effectiveness of mitochondrial markers in CO1 and ND1. Based on phylogenetic trees, CO1 proved a suitable molecular marker for scorpion species’ evolutionary relationships in Egypt, particularly in the genus Androctonus. In contrast, ND1 was not informative and did not provide true phylogenetic clustering, however, not only substitution saturation in ND1 alone can be the major factor of the weakened resolution, which could be also incomplete lineage sorting, presence of cryptic species or even sequence mislabeling in GenBank; concatenated data analysis has higher resolution and greater support values among the three analyses: ML, BI, and parsimony analyses. Based on statistical analysis of both genes, CO1 and ND1 showed a moderate similarity in evolution pattern, but on focusing about the reasons that ND1 gave inconsistencies in the tree topology analysis of both ML and BI, which according to the saturation result, there are a high mutation frequency in this gene, making it less reliable in this study to be used as taxonomical marker, especially if it used solely. Hence, we are affirming that multigene approaches, which are more stable than single-gene analyses, are suitable for scorpion systematics.
6. FUTURE WORK
We evaluated the ND1 gene against CO1, which is widely recognized as a reliable marker in scorpions. Our result showed a possible cryptic diversity within Androctonus; however, genetic distance alone is not enough to confirm this. Future work should combine molecular evidence with detailed morphological and ecological data and include broader taxonomic and geographic sampling.
7. ACKNOWLEDGMENT
The authors gratefully acknowledge Prof. Mohammad Allam (Zoology Department, Faculty of Science, South Valley University, Qena, Egypt) for his valuable support and cooperation in submitting data to the NCBI.
8. AUTHORS’ CONTRIBUTIONS
All authors made substantial contributions to conception and design, acquisition of data, or analysis and interpretation of data; took part in drafting the article or revising it critically for important intellectual content; agreed to submit to the current journal; gave final approval of the version to be published; and agree to be accountable for all aspects of the work. All the authors are eligible to be author as per the International Committee of Medical Journal Editors (ICMJE) requirements/guidelines.
9. FUNDING
There is no funding to report.
10. CONFLICTS OF INTEREST
The authors report no financial or any other conflicts of interest in this work.
11. ETHICAL APPROVALS
Scorpions used in this study were wild-captured in Egypt and obtained through a local trader. In Egypt, scorpions are not protected under national wildlife/animal welfare legislation, and no specific permits are required for their collection or trade. Therefore, ethical approval was not required for this study.
12. DATA AVAILABILITY
The raw sequence datasets generated during this study are available from the corresponding author upon reasonable request.
13. PUBLISHER’S NOTE
All claims expressed in this article are solely those of the authors and do not necessarily represent those of the publisher, the editors and the reviewers. This journal remains neutral with regard to jurisdictional claims in published institutional affiliation.
14. USE OF ARTIFICIAL INTELLIGENCE (AI)-ASSISTED TECHNOLOGY
The authors declare that they have not used artificial intelligence (AI)-tools for writing and editing of the manuscript, and no images were manipulated using AI.
REFERENCES
1. Fet V. SWDLG, Braunwalder ME. Catalog of the Scorpions of the World (1758-1998). New York:The New York Entomological Society;2000.
2. Fet V, Gantenbein B, Gromov A, Lowe G, Lourenco WR. The first molecular phylogeny of Buthidae (Scorpiones). Euscorpius. 2003;2003:1-2.[CrossRef]
3. Levy G, Amitai P. Fauna Palaestina. Arachnida I:Scorpiones. Israel:Israel Academy of Sciences and Humanities;1980.
4. Lourenço WR. Scorpion incidents, misidentification cases and possible implications for the final interpretation of results. J Venom Anim Toxins Incl Trop Dis. 2016;22:1.[CrossRef]
5. Coelho P, Sousa P, Harris DJ, van der Meijden A. Deep intraspecific divergences in the medically relevant fat-tailed scorpions (Androctonus,Scorpiones). Acta Trop. 2014;134:43-51.[CrossRef]
6. Ismail M, Abd-Elsalam MA, Al-Ahaidib MS. Androctonus crassicauda (Olivier), a dangerous and unduly neglected scorpion-I. Pharmacological and clinical studies. Toxicon. 1994;32:1599-618.[CrossRef]
7. Lowe G, Yagmur EA, Kovarík F. A review of the genus Leiurus Ehrenberg, 1828 (Scorpiones:Buthidae) with description of four new species from the Arabian Peninsula. Euscorpius. 2014;191:1-129.[CrossRef]
8. Lourenço WR, Qi JX, Cloudsley-Thompson JL. The African species of the genus Leiurus Ehrenberg, 1828 (Scorpiones:Buthidae) with the description of a new species. Bol Soc Entomol Aragon. 2006;39:97-101.
9. Lourenço WR, Kourim ML, Sadine SE. Scorpions from the Region of Tamanrasset, Algeria. Part I. A New Species of Buthacus birula, 1908 (Scorpiones:Buthidae). Arachnida-Rivista Aracnol Ital. 2017;13:31-41.
10. Fet V, Michael SE, Lowe G. A new trichobothrial character for the high-level systematics of Buthoidea (Scorpiones:Buthida). Euscorpius. 2005;2005:1-40.[CrossRef]
11. Salem ML, Shoukry NM, Teleb WK, Abdel-Daim MM, Abdel-Rahman MA. In Vitro and in Vivo Antitumor Effects of the Egyptian Scorpion Androctonus amoreuxi Venom in an Ehrlich Ascites Tumor Model. Berlin:Springerplus;2016. 5.[CrossRef]
12. Dehesa-Dávila M, Martin BM, Nobile M, Prestipino G, Possani LD. Isolation of a toxin from Centruroides infamatus infamatus Koch scorpion venom that modifies Na+permeability on chick dorsal root ganglion cells. Toxicon. 1994;32:1487-93.[CrossRef]
13. Sharma PP, Fernández R, Esposito LA, Gonzalez-Santillan E, Monod L. Phylogenomic resolution of scorpions reveals multilevel discordance with morphological phylogenetic signal. Proc Biol Sci. 2015;282:20142953.[CrossRef]
14. Ozkan O, Ahmet C, Zafer K. A study on the genetic diversity of Androctonus crassicauda (olivier, 1807;Scorpiones:Buthidae) from Turkey. J Venom Anim Toxins Incl Trop Dis. 2010;16:599-606.[CrossRef]
15. Mohamad IL, Elsayh KI, Mohammad HA, Saad K, Zahran AM, Abdallah AM, et al. Clinical characteristics and outcome of children stung by scorpion. Eur J Pediatr. 2014;173:815-8.[CrossRef]
16. Santibáñez-López CE, Francke OF, Ureta C, Possani LD. Scorpions from Mexico:From species diversity to venom complexity. Toxins (Basel). 2015;8:2.[CrossRef]
17. Fet V, El-Hennawy H, Braunwalder ME, Cloudsley-Thompson JL. The first observation on scorpion biogeography by Aristotle. Bol Soc Entomol Aragon. 2009;44:147-50.
18. El-Hennawy HK. Scorpions in ancient Egypt. Euscorpius. 2011;2011:1-12.[CrossRef]
19. Sarhan M, Badry A, Younes M, Saleh M. Genetic diversity within Leiurus quinquestriatus (Scorpiones:Buthidae) populations in Egypt as inferred from 16S mDNA sequence analysis. Zool Middle East. 2020;66:269-76.[CrossRef]
20. Mirshamsi O, Sari A, Elahi E, Hosseinie S. Phylogenetic relationships of Mesobuthus eupeus (C.L. Koch, 1839) inferred from COI sequences (Scorpiones:Buthidae). J Nat Hist. 2010;44:2851-72.[CrossRef]
21. Fet V, Kovarík F, Gantenbein B, Kaiser RC, Stewart AK, Graham MR. Revision of the Mesobuthus caucasicus complex from central Asia, with descriptions of six new species (Scorpiones:Buthidae). Euscorpius. 2018;255:1-77.[CrossRef]
22. Sadílek D, Nguyen P, KoçHL, Kovarík F, Yagmur EA, Stahlavsky F. Molecular cytogenetics of Androctonus scorpions:An oasis of calm in the turbulent karyotype evolution of the diverse family Buthidae. Biol J Linnean Soc. 2015;115:69-76.[CrossRef]
23. Sousa P, Froufe E, James Harris D, Alves PC, van der Meijden A. Genetic diversity of maghrebian Hottentotta(Scorpiones:Buthidae) scorpions based on CO1:New insights on the genus phylogeny and distribution. Afr Invertebr. 2011;52:135-43.[CrossRef]
24. Gantenbein B, Fet V, Gantenbein-Ritter IA, Balloux F. Evidence for recombination in scorpion mitochondrial DNA (Scorpiones:Buthidae). Proc Biol Sci. 2005;272:697-704.[CrossRef]
25. Ali ZB, Boursot P, Said K, Lagnel J, Chatti N, Navajas AM. Comparison of ribosomal ITS regions among Androctonus spp. Scorpions (Scorpionida:Buthidae) from Tunisia. J Med Entomol. 2000;37:787-90.[CrossRef]
26. Ben Othmen A, Said K, Mahamdallie SS, Testa JM, Haouas Z, Chatti N, et al. Phylogeography of Androctonus species (Scorpiones:Buthidae) in Tunisia:Diagnostic characters for linking species to scorpionism. Acta Trop. 2009;112:77-85.[CrossRef]
27. Alqahtani AR, Badry A. Genetic diversity among different species of the genus Leiurus(Scorpiones:Buthidae) in Saudi Arabia and the Middle East. Saudi J Biol Sci. 2020;27:3348-53.[CrossRef]
28. Galtier N, Nabholz B, Glémin S, Hurst GD. Mitochondrial DNA as a marker of molecular diversity:A reappraisal. Mol Ecol. 2009;18:4514-50.[CrossRef]
29. Soltan-Alinejad P, Rafinejad J, Dabiri F, Onorati P, Terenius O, Chavshin AR. Molecular analysis of the mitochondrial markers COI, 12S rDNA and 16S rDNA for six species of Iranian scorpions. BMC Res Notes. 2021;14:40. [CrossRef]
30. Kartavtsev YP, Rozhkovan KV, Masalkova NA. Phylogeny based on two mtDNA genes (Co-1, Cyt-B) among Sculpins (Scorpaeniformes, Cottidae) and some other scorpionfish in the Russian Far East. Mitochondrial DNA A DNA Mapp Seq Anal. 2016;27:2225-40.[CrossRef]
31. Ghavami MB, Alibabaei Z, Ghavami F. Molecular survey of mitochondrial genes in different populations of the black fat-tailed scorpion, Androctonus crassicauda. J Arthropod Borne Dis. 2022;16:84-96.[CrossRef]
32. Almaaty AA, Aldeyarbi S. COI-Based Molecular Phylogeny of Some Buthidae Scorpions from Egypt. J Biotech Res. 2022;13:18-25.
33. Kumar S, Stecher G, Li M, Knyaz C, Tamura K. MEGA X:Molecular evolutionary genetics analysis across computing platforms. Mol Biol Evol. 2018;35:1547-9.[CrossRef]
34. Larkin MA, Blackshields G, Brown NP, Chenna R, Mcgettigan PA, McWilliam H, et al. Clustal W and Clustal X version 2.0. Bioinformatics. 2007;23:2947-8.[CrossRef]
35. Swofford DL. Phylogenetic Analysis Using Parsimony. Sunderland:Sinauer Associates;1998. p. d64.
39. Paradis E, Claude J, Strimmer K. APE:Analyses of phylogenetics and evolution in R language. Bioinformatics. 2004;20:289-90.[CrossRef]
40. Oksanen J, Kindt R, Legendre P, O'Hara B, Simpson GL, Stevens MH, et al. The Vegan Package:Community Ecology Package, Version 1.13-1. R package;2008. Available from: http://vegan.r-forge.r-project.org
41. Charif D, Lobry JR. SeqinR 1.0-2:A Contributed Package to the R Project for Statistical Computing Devoted to Biological Sequences Retrieval and Analysis. New York:Springer Verlag;2007.[CrossRef]
42. Schliep KP. Phangorn:Phylogenetic analysis in R. Bioinformatics. 2011;27:592-3.[CrossRef]
43. Xia X, Xie Z, Salemi M, Chen L, Wang Y. An index of substitution saturation and its application. Mol Phylogenet Evol. 2003;26:1-7.[CrossRef]
44. Omran MA, McVean A. Intraspecific variation in scorpion Leiurus quinquestriatus venom collected from Egypt (Sinai and Aswan deserts). J Toxicol Toxin Rev. 2000;19:247-64.[CrossRef]
45. Pimenta AM, De Marco Almeida F, De Lima ME, Martin-Eauclaire MF, Bougis PE. Individual variability in Tityus serrulatus (Scorpiones, Buthidae) venom elicited by matrix-assisted laser desorption/ionization time-of-flight mass spectrometry. Rapid Commun Mass Spectrom. 2003;17:413-8.[CrossRef]
46. Borges A, García CC, Lugo E, Alfonzo MJ, Jowers MJ, Op Den Camp HJ. Diversity of long-chain toxins in Tityus zulianus and Tityus discrepans venoms (Scorpiones, Buthidae):Molecular, immunological, and mass spectral analyses. Comp Biochem Physiol C Toxicol Pharmacol. 2006;142:240-52.[CrossRef]
47. Abdel-Rahman MA, Omran MA, Abdel-Nabi IM, Ueda H, McVean A. Intraspecific variation in the Egyptian scorpion Scorpio mauruspalmatus venom collected from different biotopes. Toxicon. 2009;53:349-59.[CrossRef]
48. Tajima F. Statistical method for testing the neutral mutation hypothesis by DNA polymorphism. Genetics. 1989;123:585-95.[CrossRef]
49. Xu W, Zhang G, Xu T, He K, Wang J, Liu Z, et al. Comparative analysis of mitochondrial genomes from Buthidae (Scorpiones):Gene rearrangement and phylogenetic implications. Arthropod Syst Phylogeny. 2025;83:3-13. [CrossRef]
50. Song SN, Tang P, Wei SJ, Chen XX. Comparative and phylogenetic analysis of the mitochondrial genomes in basal hymenopterans. Sci Rep. 2016;6:20972.[CrossRef]
51. Santibáñez-López CE, Ojanguren-Affilastro AA, Graham MR, Sharma PP. Congruence between ultraconserved element-based matrices and phylotranscriptomic datasets in the scorpion Tree of Life. Cladistics. 2023;39:533-47.[CrossRef]
52. Badry A, Younes M, Sarhan MM, Saleh M. On the scorpion fauna of Egypt, with an identification key (Arachnida:Scorpiones). Zool Middle East. 2018;64:1414976.[CrossRef]
53. Jafari H, Salabi F, Navidpour S, Forouzan A. Phylogenetic and morphological analyses of Androctonus crassicuda from khuzestan province, Iran (Scorpiones:Buthidae). Arch Razi Inst. 2020;75:405-12.
54. Bayatzadeh MA, Mirakabadi AZ, Babaei N, Doulah AH, Doosti A. Characterization, molecular modeling and phylogenetic analysis of a long mammalian neurotoxin from the venom of the Iranian scorpion Androctonus crassicauda. Biologia (Bratisl). 2020;75:1029-41.[CrossRef]
55. Alqahtani AR, Badry A. Interspecific phylogenetic relationship among different species of the genus Buthacus (Scorpiones:Buthidae) inferred from 16S rRNA in Egypt and Saudi Arabia. Zool Middle East. 2020;66:178-85. [CrossRef]
56. Alqahtani AR, Badry A, Aly H, Amer SA, Al Galil FM, Ahmed MA, et al. Genetic diversity and population structure of Androctonus crassicauda (Scorpiones:Buthidae) in different ecogeographical regions of Saudi Arabia and Iran. Zool Middle East. 2022;68:171-9.[CrossRef]
57. Lourenço WR. Further considerations on the genus Buthacus Birula, 1908 (Scorpiones, Buthidae) with a description of one new species and two new subspecies. Bol SEA. 2006;38:59-70.
58. Salama WM, Sharshar KM. Surveillance study on scorpion species in Egypt and comparison of their crude venom protein profiles. J Basic Appl Zool. 2013;66:76-86.[CrossRef]
59. Folmer O, Hoeh WR, Black MB, Vrijenhoek RC. DNA primers for amplification of mitochondrial cytochrome c oxidase subunit I from diverse metazoan invertebrates. Mol Mar Biol Biotechnol. 1994;3:294-9.
60. Hedin MC. Molecular phylogenetics at the population/species interface in cave spiders of the southern Appalachians (Araneae:Nesticidae:Nesticus). Mol Biol Evol. 1997;14:309-24.[CrossRef]