
1. INTRODUCTION
Marine macrophytes, including macroalgae and seagrasses, are important coastal bioresources with ecological, nutritional, and functional significance [1,2]. Seaweeds have been widely explored as sources of food ingredients, feed additives, hydrocolloids, fertilizers, pigments, and bioactive compounds, while seagrasses contribute substantially to coastal productivity, habitat formation, sediment stabilization, and carbon storage [1–3]. These marine plant resources contain diverse biochemical constituents such as proteins, minerals, polysaccharides, lipids, phenolic compounds, chlorophylls, and carotenoids, which support their potential use in food, aquaculture, nutraceutical, cosmetic, and other value-added applications [2,4].
Brown seaweeds are particularly attractive because of their distinctive biochemical composition and metabolite diversity [4,5]. Sargassum, Padina, and Turbinaria species have been investigated for their phenolic constituents and associated bioactive properties [6–8]. Although brown seaweeds generally have low total lipid contents, their lipid fractions may contain biologically relevant fatty acids, including mono- and polyunsaturated fatty acids [5,6]. In addition, brown seaweeds are known to produce phenolic compounds, especially phlorotannins, which contribute to antioxidant protection and ecological responses to environmental stress [5,6]. Therefore, comparative biochemical screening of brown seaweeds can provide useful information for selecting promising local species for further functional and industrial studies.
Total polyphenols, flavonoid-like compounds, chlorophylls, and carotenoids are commonly used as preliminary indicators of the bioactive potential of marine plant materials [4,8]. Spectrophotometric assays provide useful estimates of these compound groups, but they cannot fully describe the diversity of individual metabolites present in complex marine biomass [8]. Ultraperformance liquid chromatography coupled with electrospray ionization quadrupole time-of-flight mass spectrometry operated in MS? acquisition mode (UPLC–ESI–QTOF–MS?) can complement conventional assays by enabling metabolite profiling based on retention time, accurate mass-to-charge ratio, adduct pattern, isotope pattern, elemental formula prediction, mass error, and low-/high-energy spectral information [9,10]. However, in screening studies, UPLC–ESI–QTOF–MS?-based annotations should be interpreted as putative unless they are confirmed using authentic reference standards, in accordance with commonly accepted metabolomics identification-confidence recommendations [10,11].
Vietnam has a long coastline and diverse coastal ecosystems that support diverse marine flora, including macroalgae, cyanobacteria, and seagrasses [12,13]. The Mekong Delta coastal region, including Phu Quoc Island in Kien Giang Province, comprises estuarine, mangrove-associated, and nearshore island habitats that support important seagrass beds and associated seaweed communities [14–16]. Nevertheless, available studies from this region have focused mainly on floristic diversity, habitat distribution, ecological status, and conservation concerns, whereas information on the nutritional composition, pigment content, phenolic-related compounds, and UPLC–ESI–QTOF–MS?-based metabolite profiles of local marine macrophytes remains limited [12,15,16]. This knowledge gap limits the evaluation and sustainable utilization of these local marine bioresources.
Therefore, this study comparatively evaluated four marine macrophyte taxa collected from the Mekong Delta coast of Vietnam, namely Sargassum sp., Padina sp., Turbinaria ornata, and Enhalus acoroides. Partial chloroplast 23S rRNA sequencing was used to support their taxonomic assignments, together with analyses of selected proximate components, phenolic-related compounds, photosynthetic pigments, and exploratory UPLC–ESI–QTOF–MS?-based metabolite profiles. By integrating these analytical components within the same set of locally collected samples, the study provides comparative baseline biochemical data and addresses the limited availability of combined biochemical and exploratory high-resolution metabolite-profiling information for marine macrophytes from coastal Vietnam.
2. MATERIALS AND METHODS
2.1. Study Materials and Sample Collection
Four marine macrophytes, including three brown seaweeds (Sargassum sp., Padina sp., and Turbinaria ornata) and one seagrass (E. acoroides), were investigated. The overall study was conducted from December 2025 to May 2026, while all samples were collected during a single sampling campaign in February 2026 from shallow coastal areas of Kien Giang Province, southwestern Vietnam. Sargassum sp. was collected from a rocky–sandy substrate at ~10.3718° N, 103.8397° E and a water depth of 0.5–1.0 m. Padina sp. was collected from small rocks and other hard substrates at approximately 10.3716° N, 103.8400° E and a depth of 0.3–0.8 m. Turbinaria ornata was collected from a shallow rocky substrate at ~10.3713° N, 103.8402° E and a depth of 0.5–1.5 m. Enhalus acoroides was collected from a nearby seagrass bed with sandy–muddy sediment at ~10.3708° N, 103.8408° E and a depth of 0.5–1.5 m. Water depth was estimated at the time of collection.
For each species, three healthy and mature thalli or shoots were collected by hand within the corresponding microhabitat. Individual biological samples were collected ~5–10 m apart and treated as within-site biological replicates. Each replicate was labeled, transported, processed, and analyzed separately. Immediately after collection, visible sediments, sand, epiphytes, and attached organisms were removed by gently rinsing the samples with ambient seawater. The cleaned samples were placed separately in sterile labeled polyethylene bags, protected from direct light, kept in an insulated container with ice packs, and transported to the laboratory.
In the laboratory, each biological replicate was processed separately. Samples were thoroughly rinsed with clean water followed by distilled water to remove residual surface salts and impurities. A portion of each fresh replicate was used immediately for moisture determination. The remaining material was cut into small pieces and dried in a forced-air oven at 40°C for ~48 hours, or until constant weight was achieved. Constant weight was defined as a difference of <0.01 g between two consecutive measurements performed at 2-hour intervals. Drying was conducted under light-protected conditions to minimize degradation of pigments, phenolic-related compounds, and unsaturated lipids.
The dried material from each biological replicate was ground separately into a fine powder, transferred to airtight amber containers, and stored at −20°C until analysis. All chemical analyses other than moisture determination were performed using separately processed dried biological replicates and were expressed on a dry-weight basis.
2.2. Molecular Identification of Samples
Molecular identification was performed to support the taxonomic assignment of the collected marine macrophyte specimens. Genomic DNA was extracted from ~100 mg of fresh tissue using the DNeasy Plant Mini Kit (QIAGEN, Hilden, Germany) according to the manufacturer’s instructions, with minor adaptation for marine macrophyte tissues. Briefly, fresh tissue was rinsed with sterile distilled water, blotted dry, cut into small pieces, and ground to a fine powder in liquid nitrogen. The homogenized tissue was lysed in Buffer AP1 containing RNase A and incubated at 65°C for 10 minutes. Cell debris and polysaccharide-rich precipitates were removed using the QIAshredder spin column, and DNA was purified using the DNeasy silica-membrane spin column. The purified DNA was eluted in 100 µl of Buffer AE and stored at −20°C until PCR analysis. DNA quality and concentration were assessed using agarose gel electrophoresis and spectrophotometric measurement.
A partial region of the chloroplast 23S rRNA gene was amplified using the plastid 23S primer pair p23SrV_f1 (5′-GGACAGAAAGACCCTATGAA-3′) and p23SrV_r1 (5′-TCAGCCTGTTATCCCTAGAG-3′), as described by Sherwood and Presting [17]. The partial chloroplast 23S rRNA marker was selected because the p23SrV primer pair enables broad amplification across diverse eukaryotic algae and cyanobacteria [17]. In the present study, the marker was used for preliminary taxonomic screening rather than definitive species-level identification. PCR amplification was performed in a 25 µl reaction mixture containing 12.5 µl of 2× PCR Master Mix, 1.0 µl of forward primer at 10 µM, 1.0 µl of reverse primer at 10 µM, 1.0 µl of template DNA, and 9.5 µl of nuclease-free water. The PCR cycling conditions consisted of an initial denaturation at 95°C for 3 minutes, followed by 35 cycles of denaturation at 95°C for 30 seconds, annealing at 52°C for 30 seconds, and extension at 72°C for 45 seconds, with a final extension at 72°C for 7 minutes.
PCR products were checked by agarose gel electrophoresis, purified, and subjected to Sanger sequencing. The obtained sequence chromatograms were quality checked, trimmed to remove low-quality regions, and used to generate consensus sequences before BLASTN analysis. The consensus sequences were compared with reference sequences available in the National Center for Biotechnology Information (NCBI) database using the BLASTN algorithm. Taxonomic assignment was based on sequence similarity, query coverage, E-value, and the closest BLASTN matches. Conservative assignments were applied when closely related taxa showed high sequence similarity within the analyzed 23S region. The corresponding chromatograms and trimmed consensus sequences are provided in Supplementary Figure S1 and Supplementary Text S1, respectively.
2.3. Determination of Selected Proximate Components
The selected proximate composition of the four marine macrophytes was determined according to standard AOAC procedures, with minor adaptation for dried marine plant materials [18]. All determinations were performed in biological triplicate. Moisture content was determined by drying a known amount of fresh sample in a hot-air oven at 105°C until constant weight. Moisture content was calculated as the percentage of weight loss relative to the initial fresh weight and expressed as a percentage of fresh weight. Crude protein content was determined by the Kjeldahl method. Dried and ground sample powder was digested with concentrated sulfuric acid in the presence of a catalyst to convert organic nitrogen into ammonium nitrogen. The digested sample was then alkalized, distilled, and titrated to determine total nitrogen content. Crude protein content was calculated by multiplying total nitrogen by a conversion factor of 6.25 and expressed as a percentage of dry weight. n-Hexane-extractable lipid content was determined by Soxhlet extraction using n-hexane as the extraction solvent. Dried sample powder was extracted for 6 hours. After extraction, the solvent was evaporated, and the recovered residue was dried to constant weight and weighed. The n-hexane-extractable lipid content was calculated as the percentage of the recovered residue relative to the initial dry sample weight. This fraction primarily represents nonpolar lipids extractable under the applied conditions and may not fully recover polar lipid classes, such as glycolipids and phospholipids. Total ash content was determined by dry ashing. Dried sample powder was weighed into preweighed crucibles and incinerated in a muffle furnace at 550°C until complete combustion of organic matter and constant weight was obtained. The remaining inorganic residue was weighed, and total ash content was expressed as a percentage of dry weight.
2.4. Preparation of Ethanolic Extracts
Ethanolic extracts were prepared separately from each biological replicate. For total polyphenol, total flavonoid, and UPLC–ESI–QTOF–MS? analyses, 1 g of dried powder was extracted with 10 ml of 70% ethanol. Separate pigment extracts were prepared using 1 g of dried powder and 10 ml of 95% ethanol. All extractions were conducted under light-protected conditions.
Extraction was performed once for 2 hours at 25°C under continuous agitation at 150 rpm. The containers were protected from direct light throughout extraction to reduce the degradation of phenolic-related compounds and photosynthetic pigments. After extraction, each suspension was centrifuged at 8,000 × g for 10 minutes at 4°C. The resulting supernatant was collected and adjusted to a final volume of 10 ml with the corresponding extraction solvent to compensate for solvent retained by the sample residue.
The recovered extracts were passed through 0.45 µm membrane filters and divided into separate amber vials. Aliquots intended for spectrophotometric analyses were stored at 4°C and analyzed within 24 hours. Aliquots of the 70% ethanol extracts intended for UPLC–ESI–QTOF–MS? analysis were further filtered through 0.22 µm membrane filters and stored at −20°C until instrumental analysis. Repeated freeze–thaw cycles were avoided. Spectrophotometric analyses were performed using the extracts prepared separately from the three biological replicates. For UPLC–ESI–QTOF–MS? profiling, equal-volume aliquots of the three separately prepared biological-replicate extracts from each taxon were pooled immediately before instrumental analysis to obtain one representative pooled extract per taxon.
2.5. Determination of Total Polyphenol Content
Total polyphenol content was determined using the Folin–Ciocalteu colorimetric method with gallic acid as the calibration standard, following commonly used procedures for seaweed and plant extract screening with minor modification [19,20]. Briefly, 0.5 ml of sample extract was mixed with 5.0 ml of 10% Folin–Ciocalteu reagent and allowed to react at room temperature for 5 minutes. Then, 4.0 ml of 1 M sodium carbonate solution was added, and the mixture was adjusted to a final volume of 10 ml with distilled water. The reaction mixture was incubated in the dark at room temperature for 90 minutes. Absorbance was measured at 750 nm using a UV–Vis spectrophotometer. Total polyphenol content was calculated from a gallic acid calibration curve and expressed as milligrams of gallic acid equivalents per gram dry weight (mg GAE/g DW).
2.6. Determination of Total Flavonoid Content
Total flavonoid content was determined using the sodium nitrite–aluminum chloride colorimetric method with catechin as the calibration standard, following Dewanto et al. [21] with minor modifications. Briefly, 1.5 ml of sample extract was mixed with 75 µl of 5% sodium nitrite solution. After 6 minutes, 150 µl of 10% aluminum chloride solution was added, and the mixture was incubated in the dark for 5 minutes. Subsequently, 500 µl of 1 M sodium hydroxide solution was added, and the final volume was adjusted to 2.5 ml with distilled water. The absorbance was measured at 510 nm using a UV–Vis spectrophotometer. Total flavonoid content was calculated from a catechin calibration curve and expressed as mg catechin equivalents per g dry weight (mg CE/g DW).
2.7. Determination of Chlorophyll and Carotenoid Contents
Total chlorophyll and total carotenoid contents were determined spectrophotometrically from the separate 95% ethanol extracts according to Lichtenthaler and Buschmann [22], with minor modification. The absorbance of the extract was measured at 470, 649, and 664 nm using a UV–Vis spectrophotometer, with 95% ethanol used as the blank. Chlorophyll a and chlorophyll b contents were calculated as follows:
Chlorophyll a = 13.36 (A664)–5.19 (A649)
Chlorophyll b = 27.43 (A649)–8.12 (A664)
Total chlorophyll was calculated as the sum of chlorophyll a and chlorophyll b. Total carotenoid content was calculated using the following equation:
Total carotenoids = [1,000 (A470)–2.13 (Chlorophyll a)–97.63 (Chlorophyll b)]/209
where A470, A649, and A664 represent absorbance values at 470, 649, and 664 nm, respectively. The final pigment contents were converted and expressed as mg/g dry weight.
2.8. UPLC–ESI–QTOF–MS?-Based Metabolite Profiling
The pooled ethanolic extracts prepared as described in Section 2.4 were analyzed using an ACQUITY UPLC I-Class system coupled to a Xevo G2-XS QTof mass spectrometer equipped with an electrospray ionization source and operated in MS? mode with negative electrospray ionization. The analysis followed a low- and high-energy MS? acquisition workflow, with reference to previously reported UPLC–QTOF–MS? and UNIFI-based metabolite profiling approaches [23,24], with modifications. Because the three biological-replicate extracts were pooled to obtain one representative extract per species, the LC–MS analysis did not provide biological replication at the species level. Therefore, peak response values were treated only as descriptive instrument signals for exploratory profiling and were not used for statistical comparison, quantitative abundance estimation, or inference of differences among species. Chromatographic separation was performed on a reversed-phase Acquity UPLC HSS T3 C18 column (2.1 × 100 mm, 1.8 µm). The column temperature was maintained at 40°C, and the autosampler was kept at 10°C. The mobile phase consisted of solvent A, water containing 0.1% formic acid, and solvent B, acetonitrile containing 0.1% formic acid. The flow rate was 0.30 ml/minutes, and the injection volume was 2 µl. The gradient elution program was as follows: 0–1 minutes, 5% B; 1–20 minutes, 5%–100% B; 20–22 minutes, 100% B; 22–22.5 minutes, 100%–5% B; and 22.5–25 minutes, 5% B for column re-equilibration.
Mass spectrometric analysis was conducted in negative electrospray ionization mode (ESI−). Data were acquired over an m/z range of 100–1,200 using low- and high-energy acquisition functions. Base peak chromatograms were generated from the low-energy TOF-MS acquisition data and used for preliminary visualization of the pooled-extract profiles. The low-energy function was used to obtain accurate precursor-ion information, whereas the high-energy function provided fragment-ion information to support metabolite annotation. The capillary voltage was set at 2.5 kV, cone voltage at 40 V, source temperature at 140°C, and desolvation temperature at 450°C. Nitrogen was used as both the desolvation and cone gas, with a desolvation gas flow of 800 l/hours and a cone gas flow of 50 l/hours. The low-energy collision energy was 6 eV, and the high-energy function used a collision energy ramp of 10–45 eV. The scan time was 0.2 seconds. Leucine-enkephalin was used as the lock-mass reference compound in negative ion mode at m/z 554.2620.
Chromatographic and mass spectrometric data were acquired and processed using the UNIFI Scientific Information System with a scientific library configured for natural-product screening. Candidate annotations were generated by matching the processed features against the UNIFI scientific library based on accurate mass and predicted elemental composition. Elemental-formula generation was restricted to C, H, N, O, P, and S. Chromatographic features were detected and processed based on retention time, observed m/z, accurate neutral mass, isotope pattern, adduct ion, and peak response. The main ion forms observed in the dataset included deprotonated ions [M−H]− and formate adducts [M+HCOO]−. For each detected feature, retention time, observed m/z, accurate neutral mass, predicted elemental formula, adduct ion, mass error, and peak response were recorded. Software-generated candidate annotations were manually reviewed based on mass error, isotope pattern, adduct assignment, retention behavior, predicted elemental formula, and available low- and high-energy MS? spectral information. Features were retained for tentative reporting when the mass error was within ±5 ppm and when the available evidence did not conflict with the proposed elemental formula and candidate annotation.
Molecular features were tentatively assigned based on accurate mass, predicted elemental formula, isotope pattern, adduct form, retention behavior, and available low- and high-energy MS? information. High-energy ions were used only as supporting evidence and were not regarded as compound-specific diagnostic fragments. According to the MSI framework [10], the reported annotations were classified as Level 3 putatively characterized compound classes rather than Level 2 compound annotations because authentic standards, validated diagnostic fragments, spectral-library match scores, numerical confidence scores, and retention-index data were unavailable. Accordingly, the reported features were conservatively described mainly at the molecular-formula or tentative chemical-class level. Peak response values were used only as descriptive instrument signals for preliminary profiling and were not subjected to quantitative or statistical comparison among taxa. Supplementary Table S1 summarizes the reported molecular features, while the corresponding base peak chromatograms and available low- and high-energy spectra are provided in Supplementary Figure S2 and Supplementary Data S1, respectively.
2.9. Statistical Analysis
All quantitative chemical analyses were performed using three independent biological replicates for each species, and the results were expressed as mean ± SD (n = 3). Given the small sample size, confidence intervals were not reported. Statistical analysis was conducted using Statgraphics Centurion 18. Homogeneity of variance was assessed before one-way ANOVA. When the overall ANOVA was significant, Tukey’s HSD test was applied for pairwise comparisons at α = 0.05. LC–MS data were not subjected to statistical analysis. Principal component analysis (PCA) was performed on species-level mean values after mean-centering and unit-variance scaling of the eight variables. Because PCA was based on only four species-level observations, it was used solely as an exploratory descriptive visualization and should not be interpreted as evidence of stable or robust clustering.
3. RESULTS AND DISCUSSION
3.1. Molecular Identification of Collected Samples
Partial chloroplast 23S rRNA gene sequencing generated sequences of 351–371 bp for representative specimens of the four marine macrophytes. BLASTN comparison against the NCBI database showed high similarity to reference sequences. Detailed BLASTN parameters are presented in Table 1. MM1 shared 100% similarity with Sargassum mcclurei isolate H03011 and was conservatively assigned as Sargassum sp. MM2 showed 99.43% similarity to Padina sp. voucher Padina_sp_C3 and was assigned as Padina sp. The sequences of MM3 and MM4 showed 100% similarity to T. ornata and E. acoroides, respectively, supporting their species-level assignments.
 | Table 1. Molecular identification of marine macrophyte samples based on partial 23S gene sequencing and BLASTN analysis. [Click here to view] |
The molecular analysis strengthened the reliability of sample assignment before biochemical characterization. Plastid markers are widely used to support algal identification and DNA-based species delimitation [17,25], which is particularly valuable when morphology is influenced by phenotypic plasticity, overlapping diagnostic characters, environmental conditions, or developmental stage [25–27]. Genus-level names were retained for Sargassum sp. and Padina sp. because closely related taxa may show limited sequence divergence within the short partial 23S rRNA region. Molecular identification was based on one representative specimen per taxon; therefore, the sequence data support the assignment of the analyzed representatives but do not assess within-taxon genetic variation. In addition, the relatively conserved partial 23S rRNA region may provide limited resolution among closely related species. Definitive species confirmation would therefore require additional morphological evidence, longer sequences, or multilocus phylogenetic analysis [25,26].
3.2. Selected Proximate Composition of the Four Marine Macrophytes
The selected proximate composition differed among the four marine macrophytes (Table 2). Moisture content ranged from 86.22% to 92.12% FW, with a significant overall difference among species (one-way ANOVA, p < 0.0001). Tukey’s HSD test indicated that all pairwise differences were significant, with values decreasing in the order Sargassum sp. > Padina sp. > T. ornata > E. acoroides. These values reflect the water-rich nature of fresh marine plant biomass and its susceptibility to postharvest deterioration. Moisture management is therefore important during storage, drying, and processing because microbial growth, respiratory activity, sensory deterioration, and biochemical changes may occur after harvest [28].
 | Table 2. Selected proximate components of the four marine macrophytes with molecularly supported taxonomic assignments. [Click here to view] |
Crude protein content ranged from 14.45% to 23.22% DW. Sargassum sp. had the numerically highest value (23.22% DW), but it did not differ significantly from Padina sp. (22.19% DW). Both contained significantly more crude protein than T. ornata (18.94% DW) and E. acoroides (14.45% DW). The values for Sargassum sp. and Padina sp. were comparable to or higher than many reported values for brown seaweeds, although protein content varies with species, habitat, season, maturity, and analytical method [4,19]. The higher protein contents of Sargassum sp. and Padina sp. may reflect species-specific differences in nitrogen assimilation, growth status, and investment in enzymes and proteins associated with photosynthetic metabolism [4,19]. However, these physiological mechanisms were not directly evaluated in the present study. These two seaweeds merit further assessment as protein-containing biomass for nutritional or aquafeed applications. Since the conventional nitrogen-to-protein factor of 6.25 can overestimate true seaweed protein, amino acid composition, digestibility, and nonprotein nitrogen should also be evaluated [29,30].
The n-hexane-extractable lipid fraction was low in all samples, ranging from 0.69% to 1.64% DW, consistent with the generally low lipid contents reported for seaweeds [19,31]. Turbinaria ornata showed the highest n-hexane-extractable lipid content (1.64% DW), whereas Padina sp. had the lowest value (0.69% DW). Compared with oleaginous yeasts, including Rhodotorula and Sporobolomyces strains, the investigated macrophytes contained relatively low lipid levels [32,33]. Their potential value may therefore depend more on the composition and functional properties of specific lipid classes than on total lipid yield [31,34]. These lipid classes are important components of photosynthetic membranes and may contribute to membrane stability and acclimation to environmental stress [31,34]. Therefore, the higher n-hexane-extractable lipid content of T. ornata may indicate a different lipid-allocation strategy, although lipid classes were not specifically quantified. Targeted GC–FID or GC–MS analysis after fatty acid methyl ester derivatization is needed to clarify the composition and nutritional value of these fractions [35,36]. It should also be noted that the present analysis included only selected proximate components, because carbohydrate and dietary fiber were not determined. Moreover, the use of n-hexane may have led to incomplete recovery of polar lipid classes, particularly glycolipids and phospholipids.
Total ash content ranged from 20.57% to 22.84% DW. Padina sp. showed the numerically highest value, but the overall difference among species was not significant (one-way ANOVA, p = 0.3846). The high ash levels indicate substantial mineral fractions and agree with the ability of marine macrophytes to accumulate inorganic components from seawater and coastal sediments [19,37]. Their practical value depends on mineral composition: essential elements may add nutritional value, while excessive sodium, iodine, arsenic, cadmium, lead, mercury, or other potentially toxic elements may create safety concerns [38,39]. Mineral profiling and heavy-metal assessment are therefore required before food, feed, or functional use.
3.3. Total Polyphenol, Flavonoid, Chlorophyll, and Carotenoid Contents
Phenolic-related compounds and photosynthetic pigments differed significantly among the four marine macrophytes (Table 3). Total polyphenol content decreased in the order Padina sp. (18.48 mg GAE/g DW) > Sargassum sp. (14.55 mg GAE/g DW) > T. ornata (13.04 mg GAE/g DW) > E. acoroides (2.56 mg GAE/g DW), with a significant overall difference among species (one-way ANOVA, p < 0.0001), and Tukey’s HSD test indicated that all pairwise differences were significant. Total flavonoid content followed the same pattern, ranging from 11.21 mg CE/g DW in Padina sp. to 1.05 mg CE/g DW in E. acoroides. Thus, the three brown seaweeds, especially Padina sp., contained substantially higher levels of phenolic-related compounds than the seagrass.
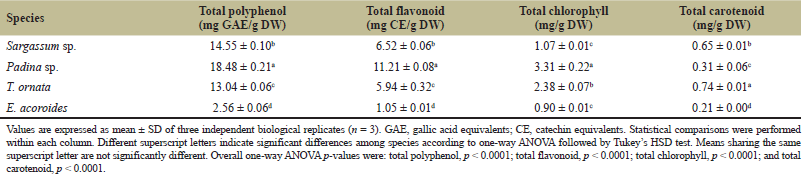 | Table 3. Total polyphenol, flavonoid, chlorophyll, and carotenoid contents of the four marine macrophytes with molecularly supported taxonomic assignments. |
The comparatively high values in Padina sp. agree with reports of phenolic compounds, phlorotannins, and flavonoid-related constituents in this genus [8]. Brown seaweeds are also recognized as sources of phlorotannins, pigments, and polysaccharides [4,40]. The present colorimetric results serve as screening indicators rather than evidence for individual compounds or antioxidant activity. Therefore, the higher polyphenol, flavonoid, chlorophyll, and carotenoid contents observed in some species should be interpreted only as biochemical indicators and not as evidence of confirmed antioxidant, antimicrobial, cytotoxic, nutraceutical, or other biological activities. The Folin–Ciocalteu assay is not specific to phenolic compounds, and reducing sugars, ascorbate, amino acids, and other reducing substances may contribute to the measured response [41]. Phlorotannins, which are characteristic of brown algae, may also contribute to the higher values observed in the three brown seaweeds [4,8,40]. Therefore, the results should be interpreted as Folin-reactive phenolic-related contents rather than exact concentrations of confirmed polyphenols. Similarly, the aluminum-chloride assay provides flavonoid-like colorimetric responses but does not confirm individual flavonoids [8,21].
Pigment contents showed a different species pattern. Padina sp. had the highest total chlorophyll content (3.31 mg/g DW), followed by T. ornata (2.38 mg/g DW); both exceeded Sargassum sp. (1.07 mg/g DW) and E. acoroides (0.90 mg/g DW), which did not differ significantly. Total carotenoid content was highest in T. ornata (0.74 mg/g DW), followed by Sargassum sp. (0.65 mg/g DW), Padina sp. (0.31 mg/g DW), and E. acoroides (0.21 mg/g DW), with a significant overall difference among species (one-way ANOVA, p < 0.0001). Tukey’s HSD test indicated that all pairwise differences were significant.
Species composition, physiological status, light exposure, habitat, and extraction efficiency may all contribute to these pigment differences [42–44]. The higher chlorophyll content of Padina sp. may reflect greater investment in light-harvesting capacity, whereas the higher carotenoid content of T. ornata may be associated with photoprotection and the dissipation of excess light energy [42–44]. Carotenoids can also help protect photosynthetic tissues against photooxidative stress [44], although photosynthetic performance and oxidative-stress markers were not measured in this study. The carotenoid level of T. ornata is of interest because brown seaweeds commonly contain xanthophylls, particularly fucoxanthin [5,42]. Although T. ornata showed the highest total carotenoid content among the studied macrophytes, this within-study result should not be interpreted as evidence of industrial competitiveness. Carotenogenic yeasts such as Rhodotorula, Sporidiobolus, and Cystofilobasidium have been investigated as microbial sources of carotenoid pigments under optimized cultivation conditions [45,46]. Moreover, fucoxanthin was not specifically identified in this study and requires targeted HPLC-DAD or LC–MS confirmation [43]. The spectrophotometric assay measured total carotenoids and could not distinguish fucoxanthin, β-carotene, violaxanthin, or other pigments.
Similar species-dependent variation in phenolic compounds and pigments has also been reported for brown seaweeds from other Southeast Asian locations, particularly Malaysia [47,48]. These regional findings support the view that biochemical composition varies substantially among Sargassum, Padina, and Turbinaria species. However, direct numerical comparisons should be interpreted cautiously because species identity, habitat, season, extraction solvent, and analytical procedures differ among studies [47,48].
3.4. UPLC–ESI–QTOF–MS?-Based Metabolite Profiles
Exploratory UPLC–ESI–QTOF–MS? screening yielded different sets of tentatively assigned molecular features among the pooled extracts (Table 4 and Fig. 1). Based on retention time, accurate mass, adduct and isotope patterns, predicted elemental formula, mass error, and low- and high-energy spectral information, 15 molecular features were tentatively assigned in the pooled Padina sp. extract, compared with seven in T. ornata, seven in Sargassum sp., and five in E. acoroides. Mass spectrometry-based profiling is useful for preliminary characterization of small molecules in algal resources [9,49], but the number of annotations is not a complete measure of metabolite diversity. Extraction solvent, chromatographic separation, ionization conditions, signal intensity, and database coverage all influence feature detection.
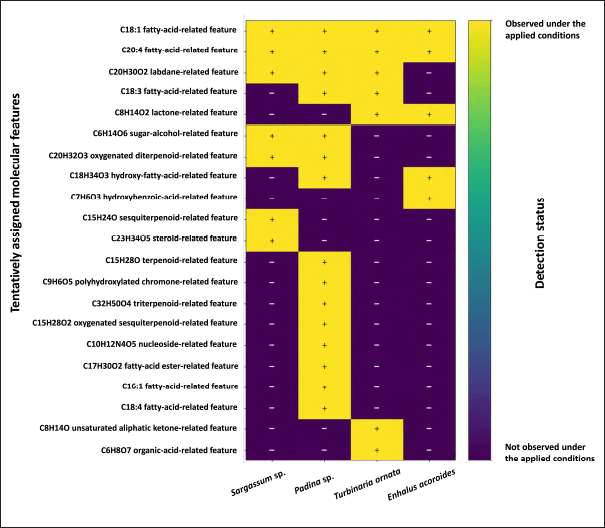 | Figure 1. Detection summary of selected tentatively assigned molecular features in pooled extracts from four marine macrophytes under the applied UPLC–ESI–QTOF–MS? screening conditions. Reported assignments are conservative MSI Level 3 annotations based mainly on accurate mass, predicted molecular formula, adduct pattern, retention behavior, isotope pattern, and available low-/high-energy spectral information. “Observed” indicates that a corresponding feature was detected under the applied screening conditions; it does not imply confirmed compound identity or quantitative comparison across taxa. [Click here to view] |
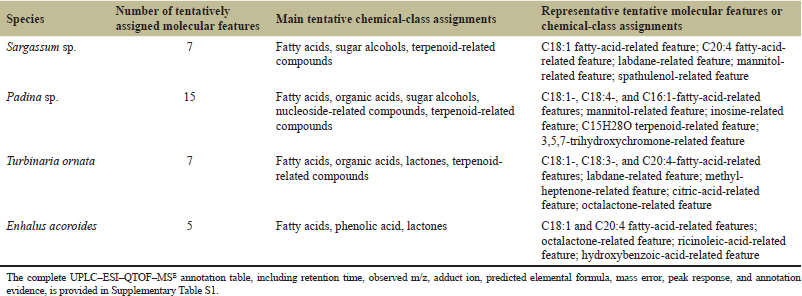 | Table 4. Summary of tentatively assigned molecular features detected in four marine macrophyte extracts by UPLC–ESI–QTOF–MS?. [Click here to view] |
Fatty-acid-related features formed the most frequently assigned group. C18:1 and C20:4 fatty-acid-related features were observed in all four pooled extracts, indicating shared lipid-related signals under the analytical conditions used. The pooled Padina sp. extract additionally contained C16:1, C18:3, and C18:4 fatty-acid-related features, together with ricinoleic-acid-related and methyl hexadecadienoate-related features. The profile of T. ornata also included organic-acid-related, lactone-related, and terpenoid-related features. Sargassum sp. contained mannitol-related, spathulenol-related, and other terpenoid-related features, whereas E. acoroides showed a simpler profile comprising fatty-acid-related, octalactone-related, and hydroxybenzoic-acid-related features.
The detection summary further illustrated shared and sample-specific patterns (Fig. 1), similar to the chemical differentiation reported in comparative LC–MS studies of marine macroalgae [49]. Several tentative assignments were observed only in the pooled Padina sp. extract, including a C15H28O terpenoid-related feature, trihydroxychromone-related, acetylaleuritolic-acid-related, cryptomeridiol-related, inosine-related, fatty-acid-methyl-ester-related, C16:1 fatty-acid-related, and C18:4 fatty-acid-related features. Features observed only in the pooled T. ornata extract included methyl-heptenone-related and citric-acid-related features, whereas spathulenol-related and periplogenin-related features were observed only in the pooled Sargassum sp. extract. These condition-dependent patterns do not establish definitive compound presence or absence across species.
The pooled Padina sp. extract yielded the largest number of tentative annotations under the applied screening conditions. This count should not be interpreted as a direct measure of overall metabolite diversity or as evidence of correspondence with its higher total polyphenol, flavonoid, and chlorophyll values, because the relevant compound classes were not quantitatively confirmed. Some phenolic-related tentative features in Padina sp. were qualitatively consistent with its higher colorimetric values, but no quantitative relationship can be established because the LC–MS analysis lacked biological replication, authentic standards, and targeted quantification. Previous studies have reported terpenoid-, polyphenol-, and polysaccharide-related compounds in the genus Padina [4,40], but such reports do not confirm the specific assignments observed here. All molecular-feature assignments in the present study remain tentative because authentic standards were not used for confirmation. Because the LC–MS dataset lacked biological replication at the taxon level, peak responses were treated only as descriptive instrument signals and were not interpreted quantitatively or statistically. The detection patterns remain preliminary because the analysis also lacked extraction blanks, pooled QC samples, internal standards, replicate injections, and formal blank-subtraction and signal-to-noise criteria. Consequently, low-intensity signals and apparent sample-specific detections should be interpreted cautiously and require confirmation using replicated targeted analyses. No functional activity can be inferred without targeted quantification and biological assays.
3.5. Exploratory Visualization of Biochemical Profiles
Exploratory PCA was used to visualize the relative positions of the four sampled species based on eight standardized biochemical variables (Fig. 2). Given the ratio of eight variables to only four species-level observations, the ordination is statistically unstable and should not be interpreted as evidence of robust clustering or generalizable species differentiation. PC1 and PC2 explained 63.1% and 26.8% of the variance, respectively, accounting together for 89.9%. Padina sp. was positioned on the positive side of PC1 and associated mainly with total polyphenol, total flavonoid, total chlorophyll, and total ash. Enhalus acoroides occupied the negative side of PC1, consistent with its generally lower values for most variables. Sargassum sp. and T. ornata appeared in the upper region of the biplot and were more closely associated with moisture and crude protein, and with n-hexane-extractable lipid and total carotenoid contents, respectively.
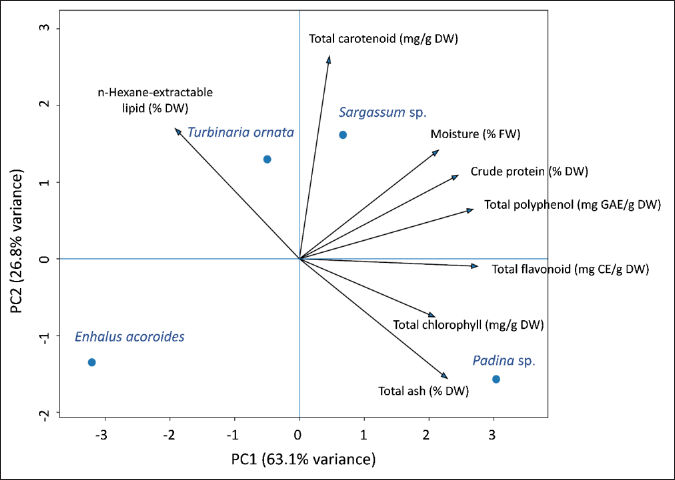 | Figure 2. Exploratory PCA biplot based on species-level mean values of eight mean-centered and unit-variance-scaled biochemical variables. Because only four observations were included, the plot is descriptive and should not be interpreted as demonstrating statistically robust clustering or generalizable species differentiation. The species-level mean values used for the exploratory PCA are provided in Supplementary Table S2. [Click here to view] |
Sargassum sp. was characterized primarily by crude protein, Padina sp. by phenolic-related compounds and chlorophyll, and T. ornata by its n-hexane-extractable lipid and total carotenoid contents. Enhalus acoroides had lower values for most measured nutritional and bioactive-related variables. Under the conditions of this study, the three brown seaweeds showed biochemical characteristics that may justify further investigation as potential functional ingredients, natural pigment sources, or aquafeed additives; however, such applications require compound confirmation, safety assessment, and biological validation [4,50,51].
PCA is useful for summarizing multidimensional biochemical patterns [49,52]. Small datasets can reduce the stability and generalizability of multivariate patterns [52,53]. Larger datasets incorporating biological replicates, seasons, and sampling locations are needed to test the observed differentiation. The findings provide baseline comparative data but remain limited by the restricted sampling period and geographic area; seasonal and spatial variations in seaweed composition were not assessed [50,54]. Metabolite assignments were based on screening-level UPLC–ESI–QTOF–MS? evidence and require confirmation with authentic standards under accepted identification-confidence frameworks [10,11]. Antioxidant activity was not measured, so it cannot be inferred directly from total polyphenol or flavonoid values [8]. These limitations should be addressed through replicated targeted analyses.
4. CONCLUSION
This study compared the selected proximate composition, phenolic-related compounds, photosynthetic pigments, and UPLC–ESI–QTOF–MS?-based metabolite profiles of four marine macrophytes collected from the Mekong Delta coast of Vietnam. The results revealed distinct biochemical patterns among the investigated samples. Sargassum sp. showed the numerically highest crude protein content, although this value was not significantly different from that of Padina sp., whereas Padina sp. was characterized by higher phenolic-related and chlorophyll contents. Turbinaria ornata exhibited the highest n-hexane-extractable lipid and total carotenoid contents among the investigated taxa, while E. acoroides generally showed lower phenolic-related compound and pigment contents than the brown seaweeds. Exploratory UPLC–ESI–QTOF–MS? screening generated preliminary tentative assignments, mainly comprising fatty-acid-related, terpenoid-related, organic-acid-related, sugar-alcohol-related, and phenolic-related features. Overall, these findings provide screening-level baseline data for the biochemical characterization of local marine macrophytes from coastal Vietnam. Further studies should include targeted quantification of fucoxanthin and phlorotannins using authentic standards, fatty-acid profiling, seasonal and spatial replication, and measurements of photosynthetic performance and oxidative-stress parameters.
5. ACKNOWLEDGMENT
This research was funded by Vietnam National University Ho Chi Minh City (VNU-HCM) under Grant No. CB2025-16-01, within the framework of the Program titled “Strengthening the Capacity for Education and Basic Scientific Research Integrated with Strategic Technologies at VNU-HCM, Aiming to Achieve Advanced Standards Comparable to Regional and Global Levels during the 2025–2030 Period, with a Vision toward 2045.”
6. AUTHORS' CONTRIBUTION
All authors made substantial contributions to conception and design, acquisition of data, or analysis and interpretation of data; took part in drafting the article or revising it critically for important intellectual content; agreed to submit to the current journal; gave final approval of the version to be published; and agree to be accountable for all aspects of the work. All the authors are eligible to be authors as per the International Committee of Medical Journal Editors (ICMJE) requirements/guidelines.
7. CONFLICT OF INTEREST
The authors report no financial or any other conflicts of interest in this work.
8. ETHICAL APPROVALS
This study does not involve experiments on animals or human subjects.
9. DATA AVAILABILITY
The data supporting this study are provided in the accompanying Supplementary Materials and Supplementary Data S1. Supplementary Materials include Supplementary Figures S1–S2, Supplementary Text S1, and Supplementary Tables S1–S2. Supplementary Data S1 contains the complete processed UPLC–ESI–QTOF–MS? reports, including the available low- and high-energy spectra. Additional available data may be obtained from the corresponding author upon reasonable request.
10. PUBLISHER’S NOTE
All claims expressed in this article are solely those of the authors and do not necessarily represent those of the publisher, the editors, and the reviewers. This journal remains neutral about jurisdictional claims in published institutional affiliations.
11. USE OF ARTIFICIAL INTELLIGENCE (AI)-ASSISTED TECHNOLOGY
During the preparation of this manuscript, the authors used ChatGPT (OpenAI) to assist with English language refinement, improve clarity, and organize selected passages based on author-provided content. The tool was not used to generate, manipulate, or analyze research data. All scientific content, interpretations, references, and conclusions were critically reviewed and approved by the authors, who take full responsibility for the final manuscript.
12. SUPPLEMENTARY MATERIAL
The supplementary material can be accessed at the journal's website: https://jabonline.in/admin/php/uploadss/1512_pdf.pdf.
REFERENCES
1. Do Amaral Camara Lima M, Bergamo TF, Ward RD, Joyce CB. A review of seagrass ecosystem services: providing nature-based solutions for a changing world. Hydrobiologia 2023;850(12):2655–70; CrossRef
2. Xie C, Lee ZJ, Ye S, Barrow CJ, Dunshea FR, Suleria HAR. A review on seaweeds and seaweed-derived polysaccharides: nutrition, chemistry, bioactivities, and applications. Food Rev Int 2024;40(5):1312–47; CrossRef
3. Ward M, Dibble C, Millington-Drake M, Lynch J, Mcglathery K, Lilley RJ, et al. Management approach matters: meeting seagrass recovery and carbon mitigation goals. NPJ Ocean Sustain 2025;4(1):18; CrossRef
4. Cadar E, Popescu A, Dragan AML, Pesterau AM, Pascale C, Anuta V, et al. Bioactive compounds of marine algae and their potential health and nutraceutical applications: a review. Mar Drugs 2025;23(4):152; CrossRef
5. Can B, Sanlier N. Secret heroes of the sea: brown macroalgae and their bioactive powers—a narrative review. Front Nutr 2026;13:1766041; CrossRef
6. Helal MA, El-Gamal AD, Elhela AA, El-Belely EF. Biochemical composition and bioactivity of the crude extract of Sargassum dentifolium (Turner) C. Agardh from the western coast of the Red Sea, Hurghada, Egypt. Biomass Convers Biorefin 2024;14(20):25203–22; CrossRef
7. Puspita M, Setyawidati NAR, Stiger-Pouvreau V, Vandanjon L, Widowati I, Radjasa OK, et al. Indonesian Sargassum species bioprospecting: potential applications of bioactive compounds and challenges for sustainable development. In: Seaweeds around the world: state of art and perspectives. Academic Press; 2020;95:113–61; CrossRef
8. Peng Z, Wu Y, Fu Q, Xiao J. Free and bound phenolic profiles and antioxidant ability of eleven marine macroalgae from the South China Sea. Front Nutr 2024;11:1459757; CrossRef
9. Mathanmohun M, Sagadevan S, Fatimah I, Lett JA, Kaus NHM, Garg S, et al. Metabolomic characterization of algal nutraceuticals to elucidate their biological activities. Metabolomics 2025;21(6):155; CrossRef
10. Sumner LW, Amberg A, Barrett D, Beale MH, Beger R, Daykin CA, et al. Proposed minimum reporting standards for chemical analysis. Metabolomics 2007;3(3):211–21; CrossRef
11. Schymanski EL, Jeon J, Gulde R, Fenner K, Ruff M, Singer HP, et al. Identifying small molecules via high-resolution mass spectrometry: communicating confidence. Environ Sci Technol 2014;48(4):2097–8; CrossRef
12. Nguyen L, Kim MS, Nguyen NT, Nguyen XT, Cao VL, Nguyen XV, et al. Marine floral biodiversity, threats, and conservation in Vietnam: an updated review. Plants. 2023;12(9):1862. CrossRef
13. Veettil BK, Ward RD, Van DD, Quang NX, Hoai PN. Seagrass ecosystems along the Vietnamese coastline: current state of research and future perspectives. Estuar Coast Shelf Sci 2022;277:108085; CrossRef
14. Schmitt K, Albers T. Mangroves and ecosystem-based coastal protection in the Mekong River Delta, Vietnam. In: Yllano OB ed., Mangrove biology, ecosystem, and conservation. IntechOpen, London, United Kingdom, 2023. CrossRef
15. Hieu NT, Ben HX, Dat MX. Species composition and distribution characteristics of seaweeds on seagrass beds in Phu Quoc Island. Vietnam J Mar Sci Technol 2019;19(4A):229–40; CrossRef
16. Nguyen VL, Hoang STP. Status and temporal change in the distribution of seagrass beds and coral reefs in the waters of Phu Quoc Islands, Kien Giang Province. Vietnam J Mar Sci Technol 2023;23(1):57–71; CrossRef
17. Sherwood AR, Presting GG. Universal primers amplify a 23S rDNA plastid marker in eukaryotic algae and cyanobacteria. J Phycol 2007;43(3):605–8; CrossRef
18. AOAC International. Official methods of analysis of AOAC International. 21st ed. Rockville: AOAC International; 2019.
19. Ismail MM, El Zokm GM, Lopez JMM. Nutritional and bioactive compound contents and antioxidant activity of brown seaweeds from the Red Sea. Front Nutr 2023;10:1210934; CrossRef
20. Sari KRP, Ikawati Z, Danarti R, Hertiani T. Micro-titer plate assay for measurement of total phenolic and total flavonoid contents in medicinal plant extracts. Arab J Chem 2023;16:105003; CrossRef
21. Dewanto V, Wu X, Adom KK, Liu RH. Thermal processing enhances the nutritional value of tomatoes by increasing total antioxidant activity. J Agric Food Chem 2002;50(10):3010–4; CrossRef
22. Lichtenthaler HK, Buschmann C. Chlorophylls and carotenoids: measurement and characterization by UV-VIS spectroscopy. Curr Protoc Food Anal Chem 2001;1:F4.3.1–8; CrossRef
23. Twohig M, O’Leary M, Cleland GE. Methodology for the identification of pesticide metabolites in complex matrices using UPLC-ToF/MS? and the UNIFI Scientific Information System [Internet]. WatersCorp. 2015 [cited 2026 Jan 25]. Available from: https://www.waters.com/nextgen/in/en/library/application-notes/2015/methodology-for-identification-of-pesticide-metabolites-in-complex-matrices-using-uplc-tof-mse-and-unifi.html.
24. Ren Y, Wang W, Zhang D, Zhang M, Zhang H, Wu Y, et al. SARS-CoV-2 Mpro inhibitors from Siphonostegia chinensis: an integrated biophysical and computational study. Front Chem 2026;14:1790228; CrossRef
25. Leliaert F, Verbruggen H, Vanormelingen P, Steen F, López-Bautista JM, Zuccarello GC, et al. DNA-based species delimitation in algae. Eur J Phycol 2014;49(2):179–96; CrossRef
26. Álvarez-Canali D, Sansón M, Sangil C, Tronholm A. Multigene phylogenetics of Sargassum (Phaeophyceae) revealed low molecular diversity in contrast to high morphological variability in the NE Atlantic Ocean. J Phycol 2024;60(6):1528–56; CrossRef
27. Huynh TTH, Vu DP, Nguyen TBN, Nguyen TTX, Do TTT, Dam DD, et al. Combining morphological and molecular data to identify Padina seaweed samples collected from Hon Thom, Phu Quoc, Vietnam. Acad J Biol 2024;46(2):7–18; CrossRef
28. Wirenfeldt CB, Sørensen JS, Kreissig KJ, Hyldig G, Holdt SL, Hansen LT. Post-harvest quality changes and shelf-life determination of washed and blanched sugar kelp (Saccharina latissima). Front Food Sci Technol 2022;2:1030229; CrossRef
29. Angell AR, Mata L, De Nys R, Paul NA. The protein content of seaweeds: a universal nitrogen-to-protein conversion factor of five. J Appl Phycol 2016;28(1):511–24; CrossRef
30. De Bhowmick G, Hayes M. In vitro protein digestibility of selected seaweeds. Foods 2022;11(3):289; CrossRef
31. Domingues MR, Calado R. Lipids of marine algae—biomolecules with high nutritional value and important bioactive properties. Biomolecules 2022;12(1):134; CrossRef
32. Gientka I, Gadaszewska M, B?a?ejak S, Kieliszek M, Bzducha-Wróbel A, Stasiak-Ró?a?ska L, et al. Evaluation of lipid biosynthesis ability by Rhodotorula and Sporobolomyces strains in medium with glycerol. Eur Food Res Technol 2017;243(2):275–86; CrossRef
33. Gientka I, Kieliszek M, Jermacz K, B?a?ejak S. Identification and characterization of oleaginous yeast isolated from kefir and its ability to accumulate intracellular fats in deproteinated potato wastewater with different carbon sources. Biomed Res Int 2017;2017:6061042; CrossRef
34. Gnayem N, Unis R, Gnaim R, Israel A, Gnaim J, Golberg A. Fatty acid profile in field-collected seaweed, lipid extraction optimization, and food functional properties. Life 2025;15(5):710; CrossRef
35. Tang B, Row KH. Development of gas chromatography analysis of fatty acids in marine organisms. J Chromatogr Sci 2013;51(7):599–607; CrossRef
36. Guihéneuf F, Schmid M, Stengel DB. Lipids and fatty acids in algae: extraction, fractionation into lipid classes, and analysis by gas chromatography coupled with flame ionization detector (GC-FID). In: Stengel DB, Connan S ed.s, Natural products from marine algae: methods and protocols. New York: Humana Press; 1308:173–90. Available from: https://pubmed.ncbi.nlm.nih.gov/26108506/
37. Lindenmayer R, Lu L, Eivazi F, Afrasiabi Z. Atomic spectroscopy-based analysis of heavy metals in seaweed species. Appl Sci 2023;13(8):4764; CrossRef
38. Dujardin B, Ferreira De Sousa R, Gómez Ruiz JA. Dietary exposure to heavy metals and iodine intake via consumption of seaweeds and halophytes in the European population. EFSA J 2023;21(1):7798; CrossRef
39. Jönsson M, Nordberg Karlsson E. Chemical food safety of seaweed: species-, spatial-, and thallus-dependent variation of potentially toxic elements and techniques for their removal. J Appl Phycol 2024;36(2):765–81; CrossRef
40. Nguyen LM, Akita S, Cao LV, Nguyen ATM, Pham QV, Vu HM, et al. Concise review of the brown algal genus Padina (Dictyotaceae): knowledge in biodiversity, biogeography, potential, and scope for future research in Vietnam. Vietnam J Mar Sci Technol 2024;24(4):399–418; CrossRef
41. Martínez-López R, Tuohy MG. Rapid and cost-efficient microplate assay for the accurate quantification of total phenolics in seaweeds. Food Chem Mol Sci 2023;6:100166; CrossRef
42. Garcia-Perez P, Lourenço-Lopes C, Silva A, Pereira A, Fraga-Corral M, Zhao C, et al. Pigment composition of nine brown algae from the Iberian northwestern coastline: influence of the extraction solvent. Mar Drugs 2022;20(2):113; CrossRef
43. Lourenço-Lopes C, Fraga-Corral M, Garcia-Perez P, Carreira-Casais A, Silva A, Simal-Gandara J, et al. A HPLC-DAD method for identifying and estimating the content of fucoxanthin, β-carotene and chlorophyll a in brown algal extracts. Food Chem Adv 2022;1:100095; CrossRef
44. Lopes C, Obando JMC, Santos TCD, Cavalcanti DN, Teixeira VL. Abiotic factors modulating metabolite composition in brown algae (Phaeophyceae): ecological impacts and opportunities for bioprospecting of bioactive compounds. Mar Drugs 2024;22(12):544; CrossRef
45. Rapoport A, Guzhova I, Bernetti L, Buzzini P, Kieliszek M, Kot AM. Carotenoids and some other pigments from fungi and yeasts. Metabolites 2021;11(2):92; CrossRef
46. Kot AM, S?k W, Kieliszek M, B?a?ejak S, Pobiega K, Brzezi?ska R. Diversity of red yeasts in various regions and environments of Poland and biotechnological potential of the isolated strains. Appl Biochem Biotechnol 2024;196(6):3274–316; CrossRef
47. Chin YY, Chang KA, Ng WM, Eng ZP, Chew LY, Neo YP, et al. A comparative evaluation of nutritional composition and antioxidant properties of six Malaysian edible seaweeds. Food Chem Adv 2023;3:100426; CrossRef
48. Nazarudin MF, Alias NH, Balakrishnan S, Wan Hasnan WNI, Noor Mazli NAI, Ahmad MI, et al. Chemical, nutrient and physicochemical properties of brown seaweed, Sargassum polycystum C. Agardh (Phaeophyceae) collected from Port Dickson, Peninsular Malaysia. Molecules 2021;26(17):5216; CrossRef
49. Al-Adilah H, Preet G, Astakala RV, Oluwabusola ET, Jaspars M, Ebel R, et al. Chemical profiling of seaweeds of the Arabian Gulf by liquid chromatography-mass spectrometry and in-silico screening against MPOX. Bot Mar 2025;68(3):281–302; CrossRef
50. Melchor-Martínez EM, Reyes AG, Peña-Rodríguez A, Delgado-Cortez IG, Flores-Contreras EA. Utilization of brown algae and pre-treatment strategies as a source of bioactive nutrients for aquaculture species. J Appl Phycol 2025;37(3):2121–46; CrossRef
51. Vieira EF, Gomes LR, Grosso C, Delerue-Matos C. Recent advances on seaweed-derived pigments for food application and the current legal framework. Foods 2025;14(18):3265; CrossRef
52. Worley B, Powers R. Multivariate analysis in metabolomics. Curr Metabolomics 2013;1(1):92–107; CrossRef
53. Saccenti E, Timmerman ME. Approaches to sample size determination for multivariate data: applications to PCA and PLS-DA of omics data. J Proteome Res 2016;15(8):2379–93; CrossRef
54. Mckinney RE, Cunningham EM, Burton J, Kraan S, Dick JTA, Walsh PJ. Fine-scale biochemical variation in Fucus serratus (Phaeophyceae): point sampling vs bulk samples and implications for industrial applications. J Appl Phycol 2026;38(1):601–12; CrossRef