1. INTRODUCTION
Pigmented rice has various advantages, especially due to its phytochemical content that is beneficial for health. Pigmented rice contains substances with proven anti-inflammatory and antioxidant properties, including flavonoids, anthocyanins, and proanthocyanidins. Consumption of pigmented rice has been shown to provide health benefits, especially for individuals with gluten intolerance [1]. The pigments that are stored in the different layers of the pericarp, seed coat, and aleurone give rice its colors, which can range from red to purple to brown to black [2,3]. At present, more than 200 varieties of black rice have been found worldwide, while in Indonesia, recent studies have recorded 24 local black rice varieties [4]. One of the varieties that has been commercially cultivated is jeliteng black rice in Central Java [5].
Black rice is known to have hypoglycemic and hypocholesterolemic potential [6]. To improve product diversification, black rice has been turned into flour in addition to being consumed as rice [5]. The bran layer of black rice is rich in dietary fiber, which contributes to the texture and increases the toughness of cooked rice [7]. Various processing methods have been applied to increase the utilization of black rice, including conversion into flour [8,9]. Black rice flour is used in various food applications, such as wheat substitution to improve the rheological properties and structure of bread [10] and making low-gluten muffins [11].
As a potential source of starch, black rice flour has promising commercial opportunities, especially in Indonesia, which has extensively cultivated black rice. The amylose content in black rice flour ranges from 13.99% to 18.49% [5], which is useful in the formation of resistant starch (RS). When ingested, RS, a food element with a low glycemic index, produces very few calories (2 kcal/g) [12] and has antidiabetic effects [13]. RS modification of black rice flour can improve food functionality, considering that RS-rich foods contribute to the prevention of obesity, diabetes, lipid disorders, and gut health problems [14].
Increasing the RS content in flour is generally done through physical modification, one of which is by cooling after microwave heating. This technique has been shown to significantly increase RS levels in corn flour [15]. The microwave process produces radiation that penetrates the starch matrix, causing molecular vibrations that generate heat due to friction, resulting in gelatinization [16]. When cooled, the starch structure undergoes retrogradation and forms solid crystals with double helix bonds, which are more stable to heat and resistant to digestive enzymes [17]. Physical modification with microwaves is an efficient method in terms of time and energy compared to conventional heating [16].
Microwave technology is promising because it is fast, safe, and hygienic, and can avoid the differential heating effects that often occur in other heating methods [18]. Therefore, this technique has received great attention in the industry and continues to be explored for its compatibility with various starch sources. Factors that influence the success of starch modification in RS production include the frequency and duration of treatment. The frequency of 900 MHz has been reported to produce high levels of RS [19,20]. However, information on the optimal duration of microwave heating in the formation of RS in black rice flour is still limited. Similarly, its impact on the physicochemical properties and structure of black rice flour has not been widely studied. Therefore, further understanding of RS production through variations in microwave heating duration is essential to develop ingredients. This study aims to evaluate the effect of microwave heating duration on RS formation, as well as the physicochemical properties and structure of Indonesian black rice flour.
2. MATERIALS AND METHODS
2.1. Materials
This research used black rice of the Sirampog (Brebes) variety sourced from local farmers in Central Java, Indonesia. Chemicals and enzymes included acetic acid, citric acid, hydrochloric acid, sulfuric acid, sodium hydroxide, boric acid, petroleum benzine, lead acetate, sodium oxalate, Nelson’s and arsenomolybdate reagents, glucose, iodine, standard amylose, various buffers (KCl-HCl, Tris-maleate, sodium acetate), pepsin, alpha-amylase, and amyloglucosidase from reputable suppliers, such as Merck, Sigma-Aldrich, PT. XYZ Chemical, and R&D Systems. Equipment used comprised a disk mill (Agrowindo, Indonesia), refrigerator (Panasonic, Japan), cabinet dryer (Memmert, Germany), ultraviolet (UV)-Vis spectrophotometer (Shimadzu, Japan), vortex mixer (Scientific Industries, USA), chromameter (Konica Minolta, Japan), Rapid Visco Analyzer (Newport Scientific, Australia), scanning electron microscope (SEM) (JEOL, Japan), Laser Particle Size Analyzer (Malvern Panalytical, UK), DSC (TA Instruments, USA), X-ray Diffractometer (Bruker, Germany).
2.2. Black Rice Flour Preparation
Black rice was then milled according to method [5] using a disc mill (Agrowindo, Indonesia) at an idle rate of 2,800 rpm and shortened to a particle size of 100 mesh. The passed results were preserved at 4°C and packed in an airtight container. Black rice flour without modification treatment was used as a control with a native label.
2.3. Preparation of RS
The modification of black rice flour starts by heating a 30% (w/v) suspension of black rice flour in water at 75°C for about 15 min. For microwave treatment, the pre-heated suspension was subjected to 900 W microwave (Toshiba MWP-MM20C, Japan) radiation for durations of 1, 3, and 5 min. After this process, the samples were cooled at 4°C for a full day [21]. Subsequently, all samples were oven-dried at 40°C for 24 h. After drying, the samples were then reduced to ensure uniform particle size and stored in the freezer for testing purposes.
2.4. Starch Content
The concentration of starch was measured applying the Nelson-Somogyi procedure [22], which included a hydrolysis pre-treatment with 30% HCl followed by neutralization with 40% NaOH [23].
2.5. Amylose Content
A 100 mg sample of black rice flour was prepared by adding a solution containing 9 mL of ethanol and 1 mL of 1N NaOH. The mixture was heated in a water bath at 75°C for 15 min to form a gel. After cooling to 25°C, up to 5 mL of the mixture was transferred to a 100 mL volumetric flask. The volume was then adjusted by adding 1 mL of 1N acetic acid and 2 mL of iodine solution. Following 20 min of mixing, the absorbance of the solution was measured using a spectrophotometer at 620 nm. The amylose content was then determined using an amylose standard curve [24].
2.6. RS Content
The RS concentration was determined using Goñi’s direct method [25]. To remove proteins, a 100 mg sample of ground material was treated with a 20 mg concentration of pepsin for 60 min at temperatures of 40°C. To break down digestible starch (DS), add 40 mg of pancreatic α-amylase to a Tris-maleate buffer and incubate at 37°C for 16 h. Following centrifugation, the remaining residue was solubilized and incubated with amyloglucosidase at 60°C for 45 min to degrade the RS. The glucose released was measured using the GOD-PAP method, and the RS content is expressed as 0.9 times the glucose amount.
2.7. Proximate Analysis
A quantitative chemical approach was used to analyze the proximate composition of black rice flour, including moisture content (method 934.01), ash content (method 923.03), protein content (method 960.53), and total fat (method 963.15), following AOAC guidelines [26].
2.8. Total Anthocyanin
The anthocyanin (TA) content in black rice flour samples was measured using a modified version of the method by Catena [27]. The sample extract was prepared by mixing 1 g of flour with 10 mL of ethanol and allowing it to macerate for 24 h. Then, 0.05 mL of the extract was placed into two separate test tubes. One tube was filled with 4.95 mL of pH 1 buffer solution (0.025 M potassium chloride), while the other contained 4.95 mL of pH 4.5 buffer solution (0.4 M sodium acetate). After incubating the solutions for 15 min, their absorbance was measured using a spectrophotometer at wavelengths of 520 nm and 700 nm. TA concentration in the black rice flour was expressed in parts per million (ppm).
2.9. Total Phenolic Content (TPC)
The total number of phenolic compounds (TPC) was determined through the Folin-Ciocalteu colorimetric method [28]. Each sample has been extracted in methanol within a 1:20 (w/v) proportion and stirred continuously for 15 min. Following extraction, 0.2 mL of the sample was combined along with 1 mL of 0.5 N the reagent Folin-Ciocalteu to start the oxidation process, which was then neutralized with saturated sodium carbonate. The resulting solution was then held at 25°C for 60 min. The resulting blue color was measured at the 760-nm wavelength using an UV spectrophotometer. TPC values were obtained using a reference curve and presented as mg GAE/g.
2.10. Total Flavonoid Content (TFC)
The TFC in black rice flour was measured using the method described in [29]. Samples were extracted with 5 mL of 50% ethanol, stirred until uniform, and then centrifuged at 3,000 rpm for 15 min. In a test tube, 0.5 mL of the filtrate was mixed with 0.5 mL of ethanol, followed by the addition of 1.0 mL of 2% aluminum chloride (AlCl3) solution. The resulting solution was allowed to rest for around 30 min. The absorbing capacity was subsequently determined at 415-nm wavelength. Quercetin was used to create the standard curve, and TFC was expressed as milligrams of quercetin equivalents per gram (mg QE/g) of black rice flour.
2.11. Antioxidant Activity (AA)
The 2,2-diphenyl-1-picrylhydrazyl (DPPH) radical scavenging activity (%RSA) was assessed using the method by Waewkum and Singthong [3]. A combination of 0.1 mL of test and 3.9 mL containing a 1:10 diluted DPPH solution was prepared and incubated in the dark for 30 min. The decrease in absorbance at 517 nm was measured using a spectrophotometer. The AA was expressed as the percentage of DPPH %RSA.
2.12. Swelling Power and Solubility
A 0.1 g sample was placed into a centrifuge tube and mixed with distilled water at a ratio of 1:100 (w/v). The sample was then homogenized for 5 min, heated at 95°C for 30 min, and allowed to cool to room temperature. Afterwards, the mixture was centrifuged at 3,000 g for 15 min. The resulting gel was measured to determine the swelling power. Next, the supernatant was transferred to a Petri dish and dried at 105°C. The remaining residue was then weighed to obtain its weight. The swelling power (SP) and solubility (S) were calculated using the formulas developed by Deng [30].
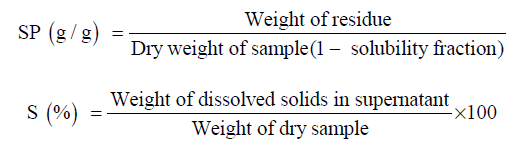
2.13. Water Holding Capacity (WHC) and Oil Holding Capacity (OHC)
The black rice flour sample (2.5 g) was mixed with an aliquot of distilled water (20 mL) to prepare a uniform suspension. This mixture was then centrifuged at 3,000 g for 10 min and subsequently agitated for 30 min. The moist sediment was then isolated from the liquid phase, subjected to drying for 10 min, and its mass recorded. WHC was calculated as the amount of water retained per gram of dry sample. To determine the OHC, the same procedure was followed, substituting the distilled water with 15 mL of maize oil. OHC is defined as the quantity of oil absorbed per gram of dry material [31].
2.14. Morphological Structure
The morphology of starch granules was examined using a SEM (SEM-EDX JEOL JSM-651LA, Tokyo, Japan). The starch was suspended in a glycerol solution before imaging. The process involved mounting the ground sample onto a metal stub with tape, followed by coating it with a layer of gold.
2.15. Pasting Properties
A total of 3 g of dry sample was mixed with 25 g of distilled water. Using a Modular Compact Rheometer Model-52 (Anton Paar, Austria), the starch suspension was heated from 50°C to 95°C at a rate of 6°C/min and held at the maximum temperature. After heating, the temperature was decreased back to 50°C at the same rate and held for 2 min. Measurements are recorded and presented.
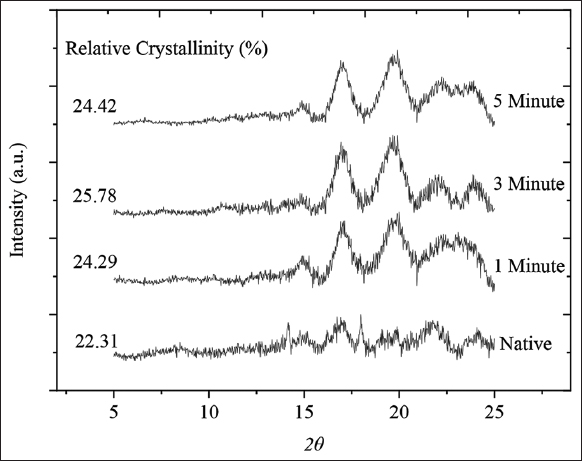
2.16. Crystalline Structure
Black rice flour was conditioned in a 100% relative humidity chamber at room temperature for 24 h. X-ray diffraction analysis was then performed, scanning diffraction angles from 5° to 25° at small increments. Relative crystallinity was calculated by dividing the area under the fitted curve by the total area of the diffraction pattern.
2.17. Statistical Analysis
All of the trials were repeated 4 times, and the results are presented in the mean plus or minus the standard deviation. Statistical evaluation of the quantitative results was carried out using analysis of variance with a 95% confidence level. Upon identifying significant variations, Duncan’s Multiple Range Test was applied for multiple comparisons, using SPSS software version 22.0 on the Windows platform.
3. RESULTS AND DISCUSSION
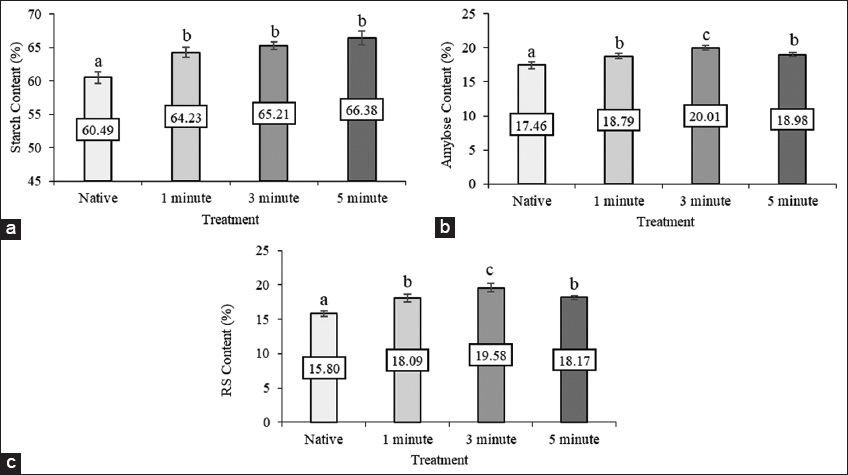
3.1. Starch, Amylose, and RS Content
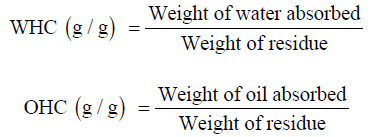
The starch content in black rice flour increased after the modification process compared to the native sample; however, there was no significant difference among the microwave exposure durations. This content was still lower than the results reported before [32], which reached a starch content of 69.65–82.06% [Figure 1a]. This increase in starch content was due to a decrease in protein and fat content after the modification process. Several studies have shown that the use of microwaves in processing can cause a decrease in protein content due to the denaturation process. Although short-term microwave treatment only has a negligible effect on protein, excessive heating can cause denaturation or damage to some amino acids, which ultimately affects the quality and nutritional value of protein in food ingredients [33]. Data showed that the amylose content was 17.46–20.01% [Figure 1b], increasing after microwave modification. Microwave treatment affects the crystal structure of starch granules. For example, it has been observed that microwave treatment can disrupt the crystalline regions of starch, leading to increased mobility of amylose molecules. This disruption allows re-association and formation of new, larger crystal structures, which can result in higher amylose content after treatment [34]. Along with the increase in microwave duration, there was a decrease in the 5-min treatment. This is because the intensity of the structural features decreased, indicating rearrangement rather than complete damage to the amylose chain. This suggests that although initial treatment improves specific properties, prolonged exposure can lead to diminishing returns in terms of amylose content [35]. Research findings have found an elevated association among amylose and RS content (15.80–19.58%) [Figure 1c]. Higher amylose content is associated with increased RS, especially the RS3 type [36]. This correlation suggests that manipulating amylose levels may be an effective strategy to increase RS in rice varieties. In a study comparing microwave treatment with other methods, such as moist heat treatment (12.3%) and autoclaving (15.5%), microwave treatment consistently resulted in the highest increase in RS content [37]. RS offers numerous health benefits, particularly for gut health, metabolic function, weight management, and potential cancer prevention. Its role as a prebiotic supports beneficial gut bacteria while improving insulin sensitivity and aiding digestion. Including a variety of foods rich in RS may be an effective strategy to improve overall health [38].
 | Figure 1: Starch (a), Amylose (b), and resistant starch (c) content of black rice flour modified. [Click here to view] |
3.2. Proximate Composition
As shown in Table 1, microwave treatment led to a substantial reduction in the moisture content of native black rice flour, decreasing from 9.30%. In contrast, no significant differences were observed in the moisture content of modified black rice flour across different microwave treatment durations, with values ranging between 6.08% and 6.23%. The results of this study indicate that microwave treatment can affect water retention in food. Microwave heating tends to reduce water content, especially at high time and power intensities, as observed in previous studies on rice [39] and wheat [40]. In addition, a significant decrease in protein content was also recorded, where native black rice flour, which had a protein content of 9.21%, decreased during the modification process to 5.45–6.21%. In contrast, ash (1.02–1.13%) and fat (1.13–1.24%) content did not show significant differences between native black rice flour and modified black rice flour.
Table 1: Proximate composition and starch content of black rice flour modified.
| Samples | Moisture (%) | Ash (% db) | Protein (% db) | Lipid (%) |
|---|---|---|---|---|
| Native | 6.30±0.88 | 1.05±0.30 | 9.21±1.18b | 1.20±0.47 |
| 1 min | 6.23±0.31 | 1.12±0.15 | 6.21±0.78a | 1.23±0.81 |
| 3 min | 6.08±0.91 | 1.13±0.64 | 6.01±1.13a | 1.24±0.50 |
| 5 min | 6.09±0.47 | 1.02±0.25 | 5.45±1.19a | 1.13±0.22 |
Data are means±standard deviations. Values in the same column followed by different superscripts indicate significant differences (P<0.05).
3.3. Bioactive Compounds
Anthocyanins are natural pigments that have red, blue, and purple colors found in plants or fruits [41]. Processing processes, such as using microwaves, can affect TA, phenolic, and flavonoid content in black rice flour. Microwave treatment can cause anthocyanin degradation because these compounds are quite sensitive to heat [42]. This is because microwave radiation causes a rapid increase in temperature and can trigger chemical reactions that break down TA structure. Table 2 shows that the longer the microwave duration, the more significant the decrease in anthocyanin that occurs, this also affects the color of the product, which is less intense. Ifadah [43] stated that damage caused by heating occurs in two stages. In the first stage, hydrolysis occurs in TA glycoside bond, producing an unstable aglycone. The second stage is the aglycone ring, which opens to form carbinol and chalcone groups. Phenolic and flavonoid compounds are compounds that provide AA that is beneficial for health. As with anthocyanins, phenolic and flavonoid compounds are also susceptible to heat generated by microwaves, especially if heating is carried out for a long time. It can be seen in Table 2. The longer the microwave duration, the more it is directly proportional to the decrease in phenolic and flavonoid compound content. Microwave treatment can cause damage to phenolic and flavonoid compounds through oxidation processes and changes in structure into other compounds [44]. Heat and radiation can cause the decomposition of phenolic and flavonoid compounds into simpler compounds. Antioxidants are chemical compounds that can prevent oxidation reactions and are widely used in various health fields [45]. From Table 2, it is observed that the longer the microwave duration, the AA decreases gradually. Process for too long will degrade antioxidant substances and reduce the effectiveness of antioxidants. The following is described in Utami’s research [46], which states that AA is susceptible to hot temperatures because its chemical structure is unstable. In the heating process, antioxidant compounds can experience degradation due to the breaking of chemical bonds and oxidation by heat [47]. Antioxidant compounds also have properties that are not resistant to heat; this is because they can reduce their antioxidant properties and damage the chemical structure of their constituent compounds [48]. When the chemical structure of these compounds is damaged, their ability to capture free radicals and provide antioxidant effects will also decrease.
Table 2: Chemical properties and antioxidant activity of black rice flour modified.
| Samples | TA (ppm) | TFC (mg QE/g) | TPC (mg GAE/g) | AA (% RSA) |
|---|---|---|---|---|
| Native | 74.48±1.67d | 373.91±1.46d | 632.66±4.41d | 89.43±0.65d |
| 1 min | 11.27±0.32c | 26.52±0.53c | 183.82±0.78c | 62.46±0.99c |
| 3 min | 10.35±0.27b | 24.92±0.29b | 163.94±1.04b | 56.57±0.71b |
| 5 min | 8.68±0.47a | 24.10±0.41a | 102.17±0.46a | 43.78±1.08a |
Data are means±standard deviations. Values in the same column followed by different superscripts indicate significant differences (P<0.05).
3.4. Swelling Power and Solubility
Table 3 shows a comparison of the swelling power and solubility of original black rice flour with modified black rice flour. Original black rice flour has a swelling power of 13.41 g/g, while the modified flour shows a lower swelling power, ranging from 7.79 to 9.34 g/g. This difference is related to the composition of amylose and amylopectin in black rice starch granules. When heated, amylose tends to reduce swelling power, while the stable double helix crystal structure of amylopectin allows optimal water binding, thereby increasing swelling power [49,50]. The most significant decrease in swelling power occurred in flour modified by the MC method, which is thought to be caused by the reorganization of the crystal area in the starch granule to become more random [51]. Prolonged microwave treatment also strengthens the interactions between amylose molecules and increases amylose-amylose interactions, which inhibit water absorption [52]. Further studies have shown that short microwave heating can significantly reduce swelling power, with a more significant decrease with longer heating duration, as found in Bambara groundnut starch, which experienced a decrease in swelling power with increasing heating duration [53]. In addition to the decrease in swelling power, the solubility of black rice flour also decreased after modification. Based on the data in Table 3, the solubility of the original black rice flour (20.28%) decreased after modification to 10.31–12.02%, with a significant decrease over time. The decrease in swelling power in microwave-treated flour correlates with a decrease in solubility in water because changes in the starch structure reduce its ability to dissolve in water [54]. The MC method is known to cause the restructuring of starch granules, reduce amylose release, and increase the area of double helices. The hydroxyl groups in the amylose double helix structure form hydrogen bonds, which reduce the hydrophilic nature of amylose, thereby reducing its solubility and swelling power [55].
Table 3: Functional properties and antioxidant activity of black rice flour modified.
| Samples | Solubility (%) | Swelling power (g/g) | WHC (g/g) | OHC (g/g) |
|---|---|---|---|---|
| Native | 20.28±0.11d | 13.31±0.61d | 2.37±0.31a | 2.91±0.17b |
| 1 min | 12.02±0.26c | 9.34±0.45c | 4.06±0.20b | 2.13±0.22a |
| 3 min | 11.24±0.31b | 8.26±0.14b | 3.91±0.42b | 2.03±0.15a |
| 5 min | 10.31±0.41a | 7.79±0.29a | 3.90±0.37b | 1.95±0.26a |
Data are means±standard deviations. Values in the same column followed by different superscripts indicate significant differences (P<0.05).
3.5. WHC and OHC
The data showed that WHC ranged from 2.37 to 4.06 g/g, and OHC went about 1.95 toward 2.13 g/g. The modification resulted in a significant increase in WHC but a decrease in OHC levels, depending on the heating duration (P < 0.05). Microwave treatment causes a rapid increase in temperature in the flour, which induces gelatinization of the starch granules. This gelatinization increases the number of hydrophilic hydroxyl groups available to bind water, thereby increasing the water retention capacity. The thermal energy from the microwave treatment also causes changes in the molecular structure of starch and proteins in the flour [56,57]. These changes allow more significant exposure to hydrophobic areas that can interact with water molecules, thereby increasing the WHC. Other studies support these findings, showing that microwave treatment significantly increased WHC in modified tapioca flour [58] and proso millet starch [37]. While some studies have suggested that longer microwave durations may decrease OHC due to increased starch aggregation, the overall trend suggests that microwave treatment can increase OHC at optimal durations [58]. In addition to increasing WHC but decreasing OHC, microwave treatment also modifies starch gelatinization characteristics and alters protein structure, where the thermal effects of microwaves facilitate exposure of hydrophobic residues, thereby enhancing molecular interactions and material functionality [59].
3.6. Morphological Structure
Microwave treatment significantly changes the morphological structure of flour, which has an impact on its physical and functional properties. This process involves exposing flour to microwave radiation, which induces thermal changes and changes the microstructure of flour [Figure 2]. Native black rice flour has a typical morphology, with aggregated and adherent particles surrounded by non-starch components, such as proteins and fats [5]. In modified black rice flour, a different morphology is seen, where irregularly shaped particles resemble large clumps surrounded by small flakes. Microwave treatment can cause agglomeration of flour particles, thereby increasing their particle size. These changes have an impact on the flow properties and rehydration characteristics of flour [60]. This treatment also tends to disrupt the amorphous regions of starch granules while strengthening the crystal structure, which can increase the overall crystallinity of flour and support its gelatinization properties [61]. Studies have shown that after microwave treatment, there is a significant increase in the ratio of crystalline to amorphous regions, which is associated with higher gelatinization temperatures and changes in the adhesion profile [62].
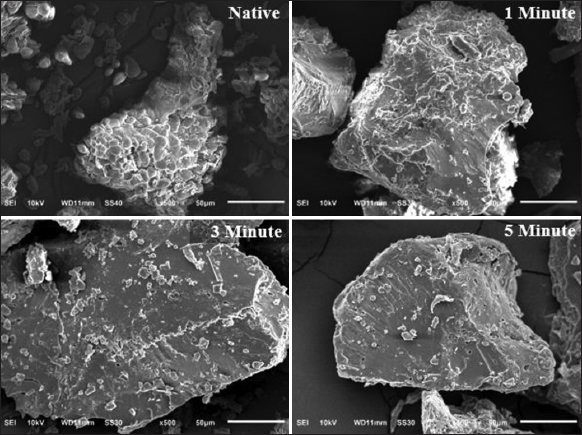 | Figure 2: Morphological structure of modified black rice. [Click here to view] |