
1. INDRODUCTION
Wheat (Triticum aestivum) is one of the most important food crops in the world as it is consumed by 35% of the world’s population [1]. It is rich in protein, carbohydrates, dietary fiber, phosphorus, zinc, tocopherol, β-carotene, folate, niacin, and essential fatty acids (linoleic and linolenic acids). The globalization, rampant urbanization, and altered lifestyles have led to the extensive consumption of refined cereals compared to coarse grains [2]. According to the Global Panel of Agriculture and Food System for Nutrition (2016), this trend may be due to the lack of nutritious food and limited purchasing power of the people. Moreover, intestinal malabsorption of proline from wheat, rye, and barley may cause celiac disease, leading to severe malnutrition [3,4]. Therefore, cereal-based gluten-free flour has been a choice for celiac disease consumers. Hence, the substitution of wheat flour with non-wheat crop food (millet) may alleviate some of the health concerns. The nutritional value of cereal-based flour may be enhanced by the addition of cereal flour (millet) to wheat flour. Furthermore, people are now becoming more health conscious in urban areas and there is an emerging trend of novel and enriched foods consumption. Millets are the powerhouse of nutrition as they are a good source of energy, dietary fibers, slowly digestible starch, and a better fatty acid profile [5,6]. Anitha et al. [7] reported that millets contain high protein and sulfur-containing amino acids (methionine and cysteine) compared to other cereals. Millets are rich in vitamins E and D and minerals like potassium, magnesium, calcium, phosphorus, manganese, and iron [8,9]. Furthermore, millets mature rapidly, having a high storage capacity, greater resistance to pests and illnesses, and can withstand unfavorable environmental conditions. Moreover, being the cheapest source of a nutrition-rich diet, its productivity should be enhanced to ensure nutritional and food security [10]. With high nutritional value over other crops, the Government of India celebrated 2018 as the “National Year of Millet” and proposed the United Nations to celebrate 2023 as the “International Year of Millet (IYM-2023).” Considering the nutritional and dietary value of millets, the optimization of wheat–millet flours with nutrient-rich ingredients is essential. After an extensive literature survey, the three millets flour, viz., finger millet (Eleusine coracana, Ragi), barnyard millet (Echinochloa frumentacea), and foxtail millet (Setaria italica) were selected to prepare composite flour with wheat. Finger millet (E. coracana, Ragi) is rich in polyphenol, protein (5–8%), dietary fiber (65–67%), carbohydrate (65–70%), mineral (2.5–3.5%), etc., while having a high calcium content (344 mg 100 g–1), tannins (0.61%), polyphenol, and trypsin inhibitory factors [11-13], respectively. Barnyard millet (E. frumentacea) possesses γ-amino butyric acid (GABA) and blood lipid-lowering antioxidants. In addition, it has low, and slowly digestible carbohydrates, protein (11.2 g 100 g–1), crude fiber (10.1 g 100 g–1), iron (15.3 g 100 g–1), minerals (4.4 g 100 g–1), grain, etc. However, foxtail millet (S. italica) contains protein (11.2 g), carbohydrate (63.2 g), crude fiber (6.7 g), total fat (4.0 g), calories (14.8 kJ), etc., apart from a high level of antinutrients [14]. It has been reported that polyphenols in finger millets have antioxidant, antibacterial, anti-inflammatory, antiviral, and anticancerous activities [15,16]. Sharma and Niranjan [17] reported the laxative effect of foxtail millet due to its coarse grain with 79% of digestible constituents.
Hence, it is essential to optimize the wheat and millet flour proportion to prepare good-quality composite flour with nutrient-rich ingredients. A number of studies pertaining to the optimization of composite flour have been published. Mohan Aringalayan et al. [18] used an optimum mixture design to optimize the flour combination of refined wheat flour (RWF) (50–75.9%), malted proso millet flour (20–45.7%), and gluten (2–5%) on a range of responses and general acceptance of malted millet bread. In a similar study, Benali et al. [19] added milk powder, a natural organoleptic enhancer, to improve the nutritional value and technical qualities of the wheat–chickpea flour mixture by combining wheat flour with 10–30% chickpea flour and 10–20% milk powder. They generated 13 unique combinations for their study purpose.
The quantities of the ingredients in combination are the factors that are studied in mixture experiments. Furthermore, mixture studies typically aim to determine the ideal ratios for each ingredient and predict the response(s) for all potential mixture formulations [20]. Different kinds of factors, including process, mixture, and discrete factors, can be accommodated by optimal designs. For the optimization in mixture experiments, I-optimal designs appear more suitable than the widely utilized D-optimal designs, which minimize the average variance of prediction. The objective of the study was to design an optimized solution to enhance the nutritional value in the fortified flour that may help in the alleviation of malnutrition and also address gluten-allergic people to control the celiac disease.
2. MATERIALS AND METHODS
2.1. Materials
Wheat (T. aestivum; WH1270) was procured from Chaudhary Charan Singh Haryana Agricultural University (CCSHAU), Hisar, Haryana, India. Foxtail millet (S. italica; CO7) was procured from Tamil Nadu Agricultural University (TNAU), Coimbatore, Tamil Nadu, India. Finger millet (E. coracana; GPU67) and Barnyard millet (Echinochloa sp.; PRJ1) was precured from the Indian Institute of Millet Research (IIMR), Hyderabad, Telangana, India.
2.2. Chemicals
The following chemicals were used in the study: trichloroacetic acid (TCA), sodium dodecyl sulfate (SDS), Folin-Ciocalteu (FC) reagent, 2-phenylmethanesulfonyl fluoride (PMSF), Tris-hydrochloride (Tris–HCl), sodium carbonate (Na2CO3), copper sulfate pentahydrate (CuSo4.5H2O), sodium potassium tartrate, and bovine serum albumin (BSA), which were purchased from Hi-media, Mumbai, India. Catechin, methanol, and 1,1-diphenyl 2-picryl hydrazyl (DPPH) were procured from Merck, NJ, USA.
2.3. Sample Preparation and Experimental Design
Based on available literature, four different individual variables, that is, wheat, finger millet, barnyard millet, and foxtail millet, were selected to prepare the samples using a pestle mortar [Table 2]. The I-optimal mixture (custom) model of response surface methodology (RSM) (Design Expert version 13; Statease Inc., Minneapolis, MN, USA) was used to optimize the nutritional composition of the wheat–millet mixture. The nutritional value of flour combinations was determined by studying total proteins [21], antinutrients [22], and antioxidants [23] in composite flours. The coded values and nutritional profiling of the experiment are shown in Tables 1 and 2, respectively. The design included four independent variables (wheat, finger, barnyard, and foxtail millet flour), and three dependent variables [protein, antinutrient (Tannin), and scavenging activity via DPPH essay]. From the available literature, the range of independent variables was culled. The coded low and high values of independent variables are shown in Table 1. A mixture design with three levels and four factors resulted in 24 runs to obtain the optimum level of independent variables for the composite flour [Table 2].
Table 1: Coded values of independent variables (wheat, finger, barnyard, and foxtail millet) their mean and standard deviation.
| S. No. | Flour Name | Units | Min. | Max. | Coded Low | Coded High | Mean | Std. Dev. |
|---|---|---|---|---|---|---|---|---|
| A | Wheat | % | 42.48 | 81.75 | +0 ↔ 40 | +1 ↔ 85 | 62.21 | 9.31 |
| B | Finger millet | % | 5 | 20 | +0 ↔ 5 | +0.33↔ 20 | 12.06 | 5.79 |
| C | Barnyard millet | % | 5 | 20 | +0 ↔ 5 | +0.33 ↔20 | 13.05 | 5.60 |
| D | Foxtail millet | % | 5 | 20 | +0 ↔ 5 | +0.33 ↔20 | 12.68 | 6.12 |
Std. Dev: standard deviation.
Table 2: Nutritional profiling runs of independent and dependent variables.
| Components/Independent Variables | Dependent/Response Variables | ||||||
|---|---|---|---|---|---|---|---|
| Runs | Wheat Flour (g) | Finger Millet (g) | Barnyard Millet (g) | Foxtail Millet (g) | Protein mg g1 | Tannin mg g1 | % Inhibition (via DPPH) |
| 1 | 56.72 | 11.27 | 20 | 12.01 | 20.7 | 10.54 | 50.17 |
| 2 | 55 | 20 | 20 | 5 | 19.08 | 11.46 | 55.93 |
| 3 | 56.09 | 11.73 | 12.18 | 20 | 21.02 | 8.3 | 53.38 |
| 4 | 67.47 | 13.28 | 5 | 14.25 | 19.99 | 10.13 | 51.86 |
| 5 | 72.06 | 17.94 | 5 | 5 | 19.91 | 9.23 | 56.98 |
| 6 | 48.99 | 12.58 | 20 | 18.43 | 20.90 | 9.98 | 46.02 |
| 7 | 56.09 | 11.73 | 12.18 | 20 | 20.48 | 7.50 | 51.80 |
| 8 | 57.84 | 20 | 11.19 | 10.97 | 21.18 | 10.56 | 52.12 |
| 9 | 70 | 5 | 5 | 20 | 22.97 | 9.83 | 51.05 |
| 10 | 42.48 | 19.41 | 18.98 | 19.12 | 20.34 | 8.03 | 53.8 |
| 11 | 68.29 | 5 | 13.73 | 12.98 | 19.98 | 9.56 | 57.01 |
| 12 | 55 | 5 | 20 | 20 | 22.02 | 12.5 | 51.51 |
| 13 | 64.91 | 20 | 10.09 | 5 | 20.94 | 10.51 | 54.88 |
| 14 | 67.47 | 13.28 | 5 | 14.25 | 21.50 | 9.12 | 51.01 |
| 15 | 81.75 | 5.64 | 6.19 | 6.42 | 20.48 | 10.73 | 52.66 |
| 16 | 75.24 | 7.34 | 12.42 | 5 | 19.37 | 8.26 | 54.97 |
| 17 | 56.72 | 11.27 | 20 | 12.01 | 19.99 | 9.44 | 51.03 |
| 18 | 67.85 | 12.04 | 15.10 | 5 | 19.31 | 9.02 | 52.10 |
| 19 | 70 | 5 | 20 | 5 | 18.91 | 8.19 | 56.15 |
| 20 | 50.09 | 20 | 13.09 | 16.82 | 21.99 | 8.88 | 55.78 |
| 21 | 68.29 | 5 | 13.73 | 12.98 | 21.05 | 9.37 | 60.02 |
| 22 | 67.85 | 12.04 | 15.10 | 5 | 19.38 | 8.64 | 52.60 |
| 23 | 61.72 | 5 | 14.15 | 19.13 | 21.3 | 9.02 | 56.24 |
| 24 | 55 | 20 | 5 | 20 | 23.58 | 10.39 | 63.01 |
*g: gram, %: percentage, mg: milligram, DPPH: 1,1-diphenyl 2-picryl hydrazyl.
Schematic diagram of whole process of sample preparation and experimental design

2.4. Response Surface Methodology Evaluation
RSM is a crucial optimization technique that can be applied to select the most suitable flour blend. It is a statistical tool, viz., mixture response surface methodology (MRSM) used to study the function of multiple variables in a mixture and their interaction effect on responses [24,25]. The RSM reduces the number of trials and provides a multiple regression approach. The availability of limited scientific literature for formulating nutritionally rich composite flour using wheat and millet necessitates the application of RSM. It is convenient to make, enhance, and formulate the procedures for the new product development to enhance the preservation of its nutritional, physicochemical, and chemical composition. The optimal level of each independent variable was predicted by the optimization procedure. The experimental design of the fortified flour is shown in Table 2, which depicts the effect of various independent factors such as wheat flour, finger millet flour (FMF), barnyard millet flour, and foxtail millet flour on protein, antinutrient via tannin and antioxidant activity via DPPH. The R2 value measures the degree of fitness and the model is best fitted when the R2 value is equal to 1 [26]. The present research aimed to optimize and analyze the millet–wheat mixed flour with high nutritional value. The adequacy is checked via analysis of variance (ANOVA) and residual plots. Furthermore, contour and 3D plots were used in the evaluation of the interaction between all the independent variables and responses.
2.5. Total Protein Profiling
The total protein content was determined by Lowry’s method [21] with slight modification. Briefly, 1 g of blended flour (Weighing balance, Mettler Toledo, Switzerland) was added in 10 mL TCA solution (10%). The extract was harvested through centrifugation (model-3740, Kubota, Japan) of the reaction mixture for 15 min at 11000 × g (4ºC). Subsequently, 100 µL of extract was mixed with 400 µL TCA buffer and the reagent C was added (5 mL). The mixture was vortexed (Tarsons, Mumbai) and allowed to stand for 10 min at room temperature. Furthermore, reagent D (0.5 mL) was added immediately by rapidly mixing and incubating at the same condition for 30 min (Magnetic stirrer, Tarson, Mumbai). After incubation, the absorbance was measured at 660 nm against a blank and total protein content was quantified using BSA as a standard curve. The protein content was expressed as mg g–1 of protein of dry matter.
2.6. Estimation of Tannin Content
The tannin content of each flour blend was determined according to Lakshmi et al.’s [22] method with some modifications. The tannin was extracted by dissolving 1 g of blended flour in 10 mL of double distilled water (ddH2O) after incubation of 6 h in water bath (Narang Scientific, Mayapuri, New Delhi). The mixture was filtered through a Whatmann filter paper grade I and the volume of filtrate was mentioned as original volume by adding ddH2O. The FC phenol reagent (0.5 mL) was added in each extract (100 µL) and incubated at room temperature for 5 min. Sodium carbonate (1 mL) was added to each mixture, and the reaction volume was raised to 10 mL with ddH2O. Furthermore, the reaction mixture was mixed well and kept at room temperature for 40 min. The concentration of tannin was estimated at 725 nm by taking catechin at standard. The result was expressed as mg g1 of dry matter.
2.7. Percent Scavenging Activity via DPPH Assay
The protocol of Sanchez-Moreno et al. [23] with slight modification was followed to study the antioxidant activity. The DPPH solution (1.0 mL) was mixed with 100 µL blended flour extracts in sterile test tubes and mixed well. The reaction mixture was left at room temperature for 30 min in the dark condition and absorbance was taken at 517 nm with UV–visible spectrophotometer (Thermo Scientific, USA). For evaluating the samples’ capacities to scavenge free radicals, ascorbic acid was taken as a positive control. The following formula was used to determine the free radical-scavenging activity:

where cAbs is the absorbance of negative control and sAbs is the sample absorbance.
2.8. Optimization and Statistical Analysis
The numerical optimization technique of RSM (Design-Expert version 13 software) was used to optimize multiple responses simultaneously. The main objective was to obtain the optimal blend of flour with improved nutritional qualities via optimization. In the optimization, all the independent variables were kept in range, and the response variables, viz., protein and antioxidants, were kept at a maximum because protein is essential for human body growth and antioxidants like DPPH, phenol, and flavonoids act as scavengers for free radicals. However, the antinutrients were kept minimal because they inhibit the absorbance of essential minerals present in our food. These variables are essential indices for measuring the desirability function for multiple response optimization, where desirability ranges from 0 (least desirable) to 1 (most desirable) [27]. The value with the highest desirability was selected for future experiments. Desirability functions can be used to determine the best levels of independent variables. The variables mentioned in the quadratic equation of the Scheffe mixture model correspond to the different interactions with each other. A, B, C, and D are denoted as linear interactions. The interaction of regression coefficients is denoted by AB, AC, AD, BC, and CD, whereas ABC, ABD, ACD, and BCD represent the special cubic regression coefficients between the variables. A statistical test to investigate the nutritional characteristics of composite flour was conducted using Design Expert Software Version 13. ANOVA verified the model response fitting. The significance level was obtained by ANOVA for each response at the 95% confidence level. Coefficient of determination (R1), model analysis, and model F-value (lack of fit) were used to assess the model’s statistical significance [28]. The chosen model was based on the p < 0.05 level of significance, lack of fit, and the highest adjusted R1 as recommended by Cornell [29]. To assess the suitability of the response surface model, the coefficient of determination (R1) was examined [28]. Each response variable’s estimated regression coefficient was evaluated for significance using the F-ratio lack-of-fit test at a probability (p) of 0.05. Significance was higher for corresponding variables with higher F-values and lower p-values [30]. Equation 1 was used to fit the actual value of the response using a quadratic Scheffe mixture model equation [31]. By contrasting the experimental data with those that were chosen through numerical optimization, the suitability of the response surface model was established [32]:

where Y is the response, q is the total number of mixture components, β is the model term’s coefficient, and x is the total number of mixture components. Just as βi xi and xi xj are distinct parameters, i and j are also distinct parameters that can be estimated. Its only purpose is to distinguish the parameter.
3. RESULTS AND DISCUSSION
3.1. Total Protein Quantification
The protein content for 24 samples ranges from 18.91 to 23.58 mg g1. The minimum protein content was observed in a flour blend prepared using wheat (70 g), finger millet (5 g), barnyard millet (20 g), and foxtail millet (5 g), while the maximum protein content was observed in flour prepared using wheat (55 g), finger millet (20 g), barnyard millet (5 g), and foxtail millet (20 g) as shown in Table 2. The I-optimal mixture design recommended a unique cubic model with coded factor, which is presented in Equation 2, to determine the protein content. The equation in terms of coded factors can be used to the predict response for different levels of each factor. The mixture components’ high levels are coded as +1, while the low levels are coded as 0. By comparing the factor coefficients, the coded equation can be used to determine the relative importance of the factors. The result of our study corroborates with Dooshima et al. [33], who reported a progressive increase in the protein content of bread from composite flour of wheat, soybeans, and banana. Furthermore, the observations of the current study are in agreement with Akinjayeju et al. [34], who observed the improvement of dietary fiber and protein in whole millet and soya flour. However, Ajiwe and Nwaigbo [35] found an increase in the protein content of weaning foods formulated with cereals and legumes composite flour, and bread from wheat and soya flour composite [36]. Similarly, Satish Kumar et al. [37] reported higher crude protein content and lower total ash content in doughnuts prepared by 40% substitution of RWF with FMF in comparison to control RWF doughnuts. Furthermore, Akinjayeju et al. [34] studied 16 blends for fiber and protein content, which increased with an increase in whole millet and soya flours, with a reduction in quality protein maize. It is a type of protein developed from convectional opaque-2 maize and considered biofortified food that double the level of lysine and tryptophan. The opaque-2 mutation in maize variety (Zea mays) is associated with an increased level of free amino acids in the mature endosperm [38]. These increases could be attributed to the relatively high content of protein in soya flour and the high fiber contents of both soya cake and whole millet flours compared to wheat flour as observed by Mashayekh et al. [39] and Saleh et al. [40]. The high crude protein content of these samples would make them a good source of dietary protein, especially for low-income populations whose staple food is flour and who cannot afford expensive high-protein animal proteins in their diets:

where A, B, C, and D are the mixture component’s coded values [Table 1]. The positive (+) sign in the equation denotes the response value increase with the variables’ increase, whether linear, binary, ternary, or quaternary combinations. In contrast, the negative (–) sign indicates that there is an antagonistic impact, with the response value decreasing as the number of variables rises [41].
Table 3 provides the ANOVA results for the model that was obtained, which showed the significance (p < 0.0005), and the essentiality, F-value, that is, 9.65 of the models. The average probability and residuals vs. run plots were also used to test the model’s applicability. The residuals either have a normal distribution or a straight line, according to the conventional probability plot. The residuals vs. run plot looks for hidden factors that could have influenced the experiment’s outcome. The straight-line trend in the probability plot in Figure 2A shows that the response was normally distributed and close to the experimental value means deviations of the variance that was significant, and the random dispersion in the residual versus run plot in Figure 2B both supported the applicability of the model. The R1 value (0.9262) confirmed the fitness of the model to the actual values. The plots of predicted vs. actual values are displayed in Figure 2C, which demonstrates that the value was close to the experiments and the value of predicted and experimental response was correlated, which shows that the model was significant. The effect of variables and their response on the protein content were described by the 3D and 2D contour plots. Figure 3 shows the combination (%) of wheat, finger millet, and barnyard millet; 23.19 mg g1 protein was observed by the interaction of a different combination. Also, there was a decent degree of agreement between the adjusted R1 (0.8302) and predicted R1 (0.6369), with the difference between them being less than 0.2, which shows that the model is significant. Additionally, the insignificant lack of fit (F-value 0.1198) confirmed the model’s suitability. The model’s important terms were A, B, C, D, AD, BD, CD, ABC, and BCD. The linear variables had a positive correlation with the protein, whereas the interaction terms, except for AD, BD, CD, BCD, and ABC, had a negative correlation (i.e., AB, AC, BC, ABD, and ACD) because the interaction of these different factors decreases the protein content. The model term +199.11 ABC was the most crucial factor for protein.
Table 3: ANOVA of special cubic model for the protein determination.
| Source | Sum of Squares | df | Mean Square | F-value | p-value |
|---|---|---|---|---|---|
| Model | 29.68 | 13 | 2.28 | 9.65 | 0.0005 Significant |
| *Linear mixture | 20.97 | 3 | 6.99 | 29.55 | <0.0001* |
| AB | 2.59 | 1 | 2.59 | 10.96 | 0.0079 |
| AC | 1.46 | 1 | 1.46 | 6.16 | 0.0325 |
| AD | 0.4462 | 1 | 0.4462 | 1.89 | 0.1996 |
| BC | 4.50 | 1 | 4.50 | 19.03 | 0.0014 |
| BD | 0.0087 | 1 | 0.0087 | 0.0366 | 0.8521 |
| CD | 0.0048 | 1 | 0.0048 | 0.0203 | 0.8896 |
| ABC | 4.59 | 1 | 4.59 | 19.40 | 0.0013 |
| ABD | 0.5016 | 1 | 0.5016 | 2.12 | 0.1760 |
| ACD | 0.0858 | 1 | 0.0858 | 0.3626 | 0.5605 |
| BCD | 0.0111 | 1 | 0.0111 | 0.0468 | 0.8331 |
| Residual | 2.37 | 10 | 0.2366 | ||
| Lack of fit | 0.2531 | 5 | 0.0506 | 0.1198 | 0.9813 Not significant |
| Pure error | 2.11 | 5 | 0.1198 | ||
| Cor total | 32.05 | 23 |
*Inference for linear mixtures uses type ? sums of squares.
 | Figure 1: The diagnostic chart of tannin content. (A) Normal plot of residuals, (B) residuals vs. run plot, and (C) predicted vs. actual plot. [Click here to view] |
 | Figure 2: The diagnostic chart of protein content. (A) Normal plot of residuals, (B) residuals vs. run plot, and (C) predicted vs. actual plot. [Click here to view] |
 | Figure 3: Contour plot and 3D plots showing the effect of wheat, finger, barnyard, and foxtail millet composite flour on protein content. [Click here to view] |
3.2. Tannin Content (Antinutrient) Estimation
The term antinutrients refers to the metabolites that have specific biological effects dependent on the structure of certain molecules ranging from high molecular weight proteins to simple amino acids and oligosaccharides. I-optimal mixture design proposed using a specific cubic model with coded factor, as shown in Equation 3, to determine the antinutrient content. The equation represented in terms of coded factors can be used to predict response for different levels of each factor. The mixture components’ high levels are coded as +1, while the low levels are coded as 0. By comparing the factor coefficients, the coded equation can be used to determine the relative importance of the factors. The tannin content for each of the 24 samples was determined by the MRSM [Table 2] and ranged from 7.5 to 12.50 mg g–1. The minimum tannin content was observed in the flour blend prepared using wheat (56.09 g), finger millet (11.73 g), barnyard millet (12.18 g), and foxtail millet (20 g); however, the maximum tannin content was observed in a flour blend prepared using wheat (55 g), finger millet (5 g), barnyard millet (20 g), and foxtail millet (20 g). From a nutritional perspective, antinutrient compounds should be regarded as hazardous and poisonous because they obstruct normal growth, reproduction, and health when routinely eaten in amounts that are typical of a diet. As the following equation illustrates, not all of the components significantly reduce the antinutrient (tannin) content. However, in this experiment, we want to reduce the antinutrient content because it forms complexes with metal ions like zinc, iron, calcium, etc., in the human gastrointestinal tract, reducing the bioavailability of these essential minerals as well as a protein needed for average human growth and development [42] while some antinutritional factor may have some benefits like the Lupinus campestris seed found to have antimutagenic activity and prevents the mutagenic process involved in the development of cancer [43]. Still, most of them have to produce a harmful effect on humans and animals:

where A, B, C, and D are the mixture component’s coded values according to Table 1. The model was significant (p < 0.0002) according to the ANOVA results [Table 4], and the F-value (12.42) further demonstrated that the model is crucial. To examine the applicability of the model, the normal probability and residual vs. run plot was also used. The residuals either have a normal distribution or a straight line, according to the conventional probability plot. The residuals vs. run plot looks for hidden factors that could have influenced the experiment’s outcome. The straight-line trend in the probability plot in Figure 1A shows that the responses were normally distributed and close to the experimental value, meaning that the deviation of the variance was significant, and the random dispersion in the residual vs. run plot in Figure 1B both supported the applicability of the model. The excellent fit of the model to the actual variables was verified by the R2 value (0.9417). Figure 1C displays the plot of predicted vs. actual values, which demonstrates that the value was close to the experimental value and the value of predicted and experiments response was correlated, which showed that the model is significant. Figure 4 displays 2D contour and 3D plots illustrating the effect of variables and their response on the tannin content. Figure 4 shows the combination (%) of wheat, barnyard millet, and finger millet; 9.07 mg g–1 minimum tannin was observed by the interaction of different combination. Also, there was a decent degree of agreement between the adjusted R2 (0.8658) and predicted R2 (0.7519), with the difference between them being less than 0.2. Furthermore, the model’s suitability was confirmed by the model’s negligible lack of fit (F-value 0.2136). The significant model terms in the model were D, and the interaction terms AB, AC, BC, BD, ACD, and BCD. The linear terms A, B, and C, and interaction terms AD, CD, ABC, and ABD are negatively correlated with tannin because these factors increase the tannin content. In contrast, the linear terms D, and the interaction terms AB, AC, BC, BD, ACD, and BCD were positively correlated because D alone and the interaction of different factor, that is, AB, AC, BC, BD, ACD, and BCD decrease the tannin content, so according to our objective, we want to decrease the tannin content. Hence, the positive sign factors are negatively correlated and the negative sign factors are positively correlated. The model term –206.91 BCD was the most crucial factor influencing the antinutrient (tannin) content.
Table 4: ANOVA of special cubic model for the tannin determination.
| Source | Sum of Squares | df | Mean Square | F-value | p-value |
|---|---|---|---|---|---|
| Model | 29.88 | 13 | 2.30 | 12.42 | 0.0002 Significant |
| *Linear mixture | 0.1952 | 3 | 0.0651 | 0.3515 | 0.7891 |
| AB | 4.10 | 1 | 4.10 | 22.17 | 0.0008 |
| AC | 3.04 | 1 | 3.04 | 16.44 | 0.0023 |
| AD | 1.59 | 1 | 1.59 | 8.58 | 0.0150 |
| BC | 2.98 | 1 | 2.98 | 16.09 | 0.0025 |
| BD | 0.0015 | 1 | 0.0015 | 0.0083 | 0.9290 |
| CD | 0.07 | 1 | 1.07 | 5.76 | 0.0373 |
| ABC | 2.99 | 1 | 2.99 | 16.15 | 0.0024 |
| ABD | 0.0023 | 1 | 0.0023 | 0.0126 | 0.9130 |
| ACD | 0.9616 | 1 | 0.9616 | 5.19 | 0.0458 |
| BCD | 1.78 | 1 | 1.78 | 9.64 | 0.0112 |
| Residual | 1.85 | 10 | 0.1851 | ||
| Lack of fit | 0.3259 | 5 | 0.0652 | 0.2136 | 0.9422 Not significant |
| Pure error | 1.53 | 5 | 0.3051 | ||
| Cor total | 31.73 | 23 |
*Inference for linear mixture uses type ? sums of squares.
 | Figure 4: Contour plot and 3D plots showing the effect of wheat, finger, barnyard, and foxtail millet composite flour on tannin content. [Click here to view] |
3.3. Antioxidant Activity
The DPPH scavenging activity for each of the 24 samples was determined by MRSM [Table 2] and ranged from 46.02% to 63.01%. The minimum antioxidant activity was observed in flour blends prepared using wheat (48.99 g), finger millet (12.58 g), barnyard millet (20 g), and foxtail millet (18.43 g), while the maximum antioxidant activity was observed in flour blends prepared using wheat (55 g), finger millet (20 g), barnyard millet (5 g), and foxtail millet (20 g). The I-optimal mixture design recommended using a specific cubic model with coded factor, as shown in Equation 4, to determine the antioxidant activity. The equation represented in terms of coded factors can be used to predict the response for different levels of each factor. The mixture components’ high levels are coded as +1, while the low levels are coded as 0. By comparing the factor coefficients, the coded equation can be used to determine the relative importance of the factors. According to the following equation, not all of the ingredients have a discernible impact on the antioxidant activity. Due to the presence of phenolic compounds, millet is regarded as a powerful source of antioxidants [44], hence adding millet flour to wheat flour significantly increases the antioxidant activity. By flour fortification of wheat–millet, the antioxidant activity increased and was maximum as observed in flour blends prepared using wheat (55 g), finger millet (20 g), barnyard millet (5 g), and foxtail millet (20 g). Khan et al. [45] also reported the positive impact of milk powder on the antioxidant activity when used in the preparation of composite flour with wheat–chickpea. Earlier studies on wheat–chickpea flour and pasta revealed high levels of polyphenol content and antioxidant activity, which finally resulted in the products’ content being double that of the control [46]. Our results were in agreement with Sharma and Gujral [47], who made pancakes using barley flour rather than wheat flour and reported a higher antioxidant activity:

where A, B, C, and D are the mixture component’s coded values according to Table 1. ANOVA results are shown in Table 5, which shows that the model is significant (p < 0.0001) and the F-value (21.59) also suggests the essentiality of model. The average probability and residuals vs. run plots were also used to test the model’s applicability. The residuals either have a normal distribution or a straight line, according to the conventional probability plot shown in Figure 5. The residuals vs. run plot looks for hidden factors that could have influenced the experiment’s outcome. The straight-line trend in the probability plot in Figure 5A shows that the response was normally distributed and close to the experimental value means the deviation of the variance that was significant, and the random dispersion in the residual vs. run plot in Figure 5B both supported the applicability of the model. The R2 value of 0.9656 validated the model’s good agreement with the measured values. The predicted vs. real values are presented in Figure 5C, which demonstrates that the model is significant because the actual value is nearly identical to the predicted value. Figure 6 displays the 2D contour and 3D plots illustrating how many factors, that is, independent variable and response variable, affect antioxidant activity. Additionally, there was a decent degree of agreement between the adjusted R2 (0.9209) and predicted R2 (0.8078), with the difference between them being less than 0.2. Furthermore, the model’s suitability was confirmed by the model’s insignificant lack of fit (F-value 0.4768). The model’s important terms included A, B, C, D, AB, AC, BC, BD, and ACD and have a positive correlation with antioxidant because the linear term and interaction of different factor increase the antioxidant activity. With the exception of AD, CD, ABC, ABD, and BCD interaction terms had a negative correlation with antioxidants because the interaction of different factor decreases the antioxidant activity. The model term +469.17 ACD was the most crucial factor influencing the scavenging activity.
Table 5: ANOVA of special cubic model for the scavenging activity, viz., DPPH.
| Source | Sum of Squares | df | Mean Square | F-value | p-value |
|---|---|---|---|---|---|
| Model | 274.93 | 13 | 21.15 | 21.59 | <0.0001 Significant |
| *Linear mixture | 22.31 | 3 | 7.44 | 7.59 | 0.0062 |
| AB | 1.62 | 1 | 1.62 | 1.65 | 0.2277 |
| AC | 3.04 | 1 | 3.04 | 3.11 | 0.1084 |
| AD | 0.7975 | 1 | 0.7975 | 0.8140 | 0.3881 |
| BC | 8.74 | 1 | 8.74 | 8.92 | 0.0136 |
| BD | 10.38 | 1 | 10.38 | 10.60 | 0.0086 |
| CD | 5.50 | 1 | 5.50 | 5.62 | 0.0393 |
| ABC | 28.66 | 1 | 28.66 | 29.26 | 0.0003 |
| ABD | 24.04 | 1 | 24.04 | 24.53 | 0.0006 |
| ACD | 23.83 | 1 | 23.83 | 24.32 | 0.0006 |
| BCD | 16.51 | 1 | 16.51 | 16.86 | 0.0021 |
| Residual | 9.80 | 10 | 0.9798 | ||
| Lack of fit | 3.16 | 5 | 0.6327 | 0.4768 | 0.7822 Not significant |
| Pure error | 6.63 | 5 | 1.33 | ||
| Cor total | 284.73 | 23 |
*Inference for linear mixture uses type ? sums of squares.
 | Figure 5: The diagnostic chart of scavenging activity. (A) Normal plot of residuals, (B) residuals vs. run plot, and (C) predicted vs. actual plot. [Click here to view] |
 | Figure 6: Contour plot and 3D plots showing the effect of wheat, finger, barnyard, and foxtail millet composite flour on scavenging activity via DPPH. [Click here to view] |
3.4. Numerical Optimization
In Design-Expert software version 13, numerical optimization was done to determine the ideal composition of composite flours. All flours’ blend was kept in range while protein content and antioxidant activity were maximized, and the antinutrient contents were minimized [Table 6]. After optimization, eight solutions were obtained, of which the best composition was selected as shown in Table 7. The ideal composition obtained was 51.09 g wheat flour, 20 g finger flour, 8.91 g barnyard flour, and 20 g foxtail flour. The values of protein, antinutrient, and antioxidant activity at this composition predicted by the models were 23.19 mg g1, 9.07 mg g1, and 61.52%, respectively. The desirable value of selected optimized composite flour, along with the independent and dependent variables, is shown in Figure 7. The desirability value of optimized composite flour is 0.845. A desirability value > 0.7 is regarded as excellent [48]. A flour blend was prepared using an optimum composition to validate this optimum composition, which was given by the software after analysis. The values of protein, antinutrient, and antioxidant activity measured experimentally were 22.92 mg g1, 8.24 mg g1, and 63.68%. These actual response values are closely correlated with the predicted values of Design-Expert Software which validates the obtained model. There is no discernible difference between the predicted and actual value in the validation experiment. Figures 3, 4, 6, and 8 are 2D contour and 3D plots illustrating how variables affect the reactions of optimized composite flour. This best-optimized blended flour has been used for future experiments. In a similar study, D-optimal mixture design was used to optimize a composite flour (red lentil flour, pearl millet flour, and mung bean flour) for the production of gluten-free bread [30]. Similar to our study, Khan et al. [49] utilized a combination best (custom) design to learn more about the health advantages of millet–legume-based composite flour, viz., finger millet flour, foxtail millet flour, and Bengal gram for diabetes patients compared to refined flour.
Table 6: Constraints fixed for numerical optimization of protein, tannin, and scavenging activity, viz., DPPH assay.
| Name | Goal | Lower Limit | Upper Limit | Importance | Model |
|---|---|---|---|---|---|
| A: Wheat | Is in range | 40 | 85 | 3 | – |
| B: Finger | Is in range | 5 | 20 | 3 | – |
| C: Barnyard | Is in range | 5 | 20 | 3 | – |
| D: Foxtail | Is in range | 5 | 20 | 3 | – |
| Protein | Maximize | 18.91 | 23.58 | 4 | Special cubic |
| Antinutrient | Minimize | 7.5 | 12.05 | 3 | Special cubic |
| Antioxidant | Maximize | 46.02 | 63.01 | 4 | Special cubic |
Table 7: Numerical optimizing of composite flour with solutions.
| S. No. | Wheat | Finger Millet | Barnyard Millet | Foxtail Millet |
|---|---|---|---|---|
| 1 | 51.09 | 20.000 | 8.909 | 20.000 (optimized) |
| 2 | 54.77 | 19.99 | 5.22 | 20 |
| 3 | 65.14 | 5 | 9.85 | 20 |
| 4 | 52.36 | 15.88 | 11.76 | 20 |
| 5 | 55 | 15 | 10 | 20 |
| 6 | 66.32 | 6.84 | 6.84 | 20 |
| 7 | 58 | 11 | 11 | 20 |
| 8 | 70 | 20 | 5 | 5 |
 | Figure 7: The desirability value of selected optimized composite flour along with independent and dependent variables. [Click here to view] |
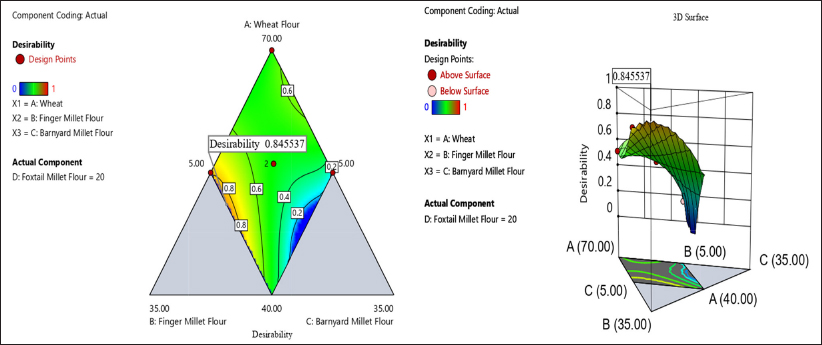 | Figure 8: Contour plot and 3D plots showing the effect of wheat, finger, barnyard, and foxtail millet composite flour on desirability value. [Click here to view] |
4. CONCLUSION AND FUTURE PERSPECTIVE
The combination of wheat and millet flour was successfully designed using an MRSM. The selected parameters and their response showed a significant impact. The calculated model appears to have been highly reliable based on conjecture. The special cubic model is significant in all three response variables. The model obtained using MRSM fit the actual response value as confirmed by their high value of R2, F-value, lack-of-fit value, and adjusted R2 value. The optimized composite flour had improved nutritional properties with high protein, low antinutrient, and high antioxidant activity. The optimum level was found to be a combination of wheat (50.09%), finger millet (20%), barnyard millet (8.909%), and foxtail millet (20%), resulting in protein (23.19 mg g–1), antinutrient (9.07 mg g–1), and antioxidant activity (61.52%), with the highest desirability of 0.845. Therefore, the current study recommends using millet effectively to improve nutritional quality for health advantages and solve issues related to malnutrition and celiac disease. The future perspective of this study is to produce a composite flour blend that improves nutritional quality, including fiber, minerals content, and protein content, which enhances the nutritional status of consumers and reduces the prevalence of malnutrition and food insecurity in society. Improved nutritional quality will also reduce the problems associated with the use of drugs to manage diseases, including costs and adverse effects of these drugs on consumers.
5. ACKNOWLEDGMENTS
The Department of Botany, Maharshi Dayanand University, Rohtak, and DST-FIST, New Delhi, are acknowledged for providing the requisite facilities for the preparation of this manuscript.
6. AUTHORS’ CONTRIBUTIONS
GC: Investigation, conceptualization, formal analysis, methodology, manuscript writing and proofreading. MK: Writing – review & editing, formal analysis, proofreading. ARS: practical supervision, validation, editing, proofreading. SK: Writing – review & editing. ST: Writing – review & editing.
7. FINANCIAL SUPPORT AND SPONSORSHIP
There is no funding to report.
8. CONFLICTS OF INTEREST
The authors report no financial or any other conflicts of interest in this work.
9. ETHICS APPROVALS
This study does not involve experiments on animals or human subjects.
10. DATA AVAILABILITY
All data generated and analyzed are included within this research article.
11. USE OF ARTIFICIAL INTELLIGENCE (AI)-ASSISTED TECHNOLOGY
The authors confirm that there was no use of artificial intelligence (AI)-assisted technology for assisting in the writing or editing of the manuscript and no images were manipulated using AI.
12. PUBLISHER’S NOTE
All claims expressed in this article are solely those of the authors and do not necessarily represent those of the publisher, the editors and the reviewers. This journal remains neutral with regard to jurisdictional claims in published institutional affiliation.
REFERENCES
1. Zhang H, Zhang W, Xu C, Zhou X. Morphological features and physicochemical properties of waxy wheat starch. Int J Biol Macromol. 2013:62:304–9. https://doi.org/10.1016/j.ijbiomac.2013.09.030
2. Oghbaei M, Prakash J. Nutritional quality of ‘Chapathis’ prepared with fiber enriched, mineral fortified whole and refined wheat flour. Int Food Res J. 2018;25(5):2204-10.
3. Davidson AGF, Bridges MA. Coeliac disease: a critical review of aetiology and pathogenesis. Clin Chim Acta. 1987;163(1):1–40. [CrossRef]
4. Stamnaes J, Sollid LM. Celiac disease: autoimmunity in response to food antigen. Semin Immunol. 2015;27(5):343–52. [CrossRef]
5. Nithiyanantham S, Kalaiselvi P, Mahomoodally MF, Zengin G, Abirami A, Srinivasan G. Nutritional and functional roles of millets—a review. J Food Biochem. 2019;43(7):e12859. [CrossRef]
6. Annor GA, Tyl C, Marcone M, Ragaee S, Marti, A. Why do millets have slower starch and protein digestibility than other cereals? Trends Food Sci Technol. 2017;66:73–83. [CrossRef]
7. Anitha S, Govindaraj M, Kane?Potaka J. Balanced amino acid and higher micronutrients in millets complements legumes for improved human dietary nutrition. Cereal Chem. 2020;97(1):74–84. [CrossRef]
8. Dayakar Rao B, Bhaskarachary K, Arlene Christina GD, Sudha Devi G, Vilas AT, Tonapi A. Nutritional and health benefits of millets. Hyderabad: ICAR_Indian Institute of Millets Research (IIMR); 2017.
9. Birania S, Rohilla P, Kumar R, Kumar N. Post-harvest processing of millets: a review on value added products. Int J Chem Stud. 2020;8(1):1824–9. [CrossRef]
10. Michaelraj PSJ, Shanmugam A. A study on millets-based cultivation and consumption in India. Int J Market Fin Serv Manage Res. 2013;2(4):49–58.
11. Chethan S, Malleshi NG. Finger millet polyphenols: optimization of extraction and the effect of pH on their stability. Food Chem. 2007;105(2):862–70. [CrossRef]
12. Devi PB, Vijayabharathi R, Sathyabama S, Malleshi NG, Priyadarisini VB. Health benefits of finger millet (Eleusine coracana L.) polyphenols and dietary fiber: a review. J Food Sci Technol. 2014;51(6):1021–40. [CrossRef]
13. Singh A, Sehrawat KD, Sehrawat A, Singh M, Sehrawat AR. Assessing the genetic diversity of finger millet (Eleusine coracana) germplasm for agronomic traits. Indian J Agricult Sci. 2023:93(5):489–94. [CrossRef]
14. Ambati K, Sucharitha KV. Millets-review on nutritional profiles and health benefits. Int J Recent Sci Res. 2019;10(7):33943–8.
15. Pradeep PM, Sreerama YN. Impact of processing on the phenolic profiles of small millets: evaluation of their antioxidant and enzyme inhibitory properties associated with hyperglycemia. Food Chem. 2015;169:455–63. [CrossRef]
16. Viswanath V, Urooj A, Malleshi NG. Evaluation of antioxidant and antimicrobial properties of finger millet polyphenols (Eleusine coracana). Food Chem. 2009;114(1):340–6. [CrossRef]
17. Sharma N, Niranjan K. Foxtail millet: properties, processing, health benefits, and uses. Food Rev Int. 2018;34(4):329–63. [CrossRef]
18. Mohan Aringalayan N, Singh R, Mishra S, Thangalakshmi S, Kaur BP, Bajpai VK, et al. Optimization and characterization of malted proso millet (Panicum miliaceum) based bread. eFood. 2022;3(5):e29. [CrossRef]
19. Benali A, En-Nahli Y, Noutfia Y, Elbaouchi A, Kabbour MR, Gaboun F, et al. Nutritional and technological optimization of wheat-chickpea- milk powder composite flour and its impact on rheological and sensorial properties of leavened flat bread. Foods. 2021;10(8):1843. [CrossRef]
20. Goos P, Jones B, Syafitri U. I-optimal design of mixture experiments. J Am Stat Assoc. 2016;111(514):899–911.
21. Lowry OH, Rosebrough NJ, Farr AL, Randall RJ. Protein estimation by Lowry’s method. J Biol Chem. 1951;193(265):52451–6.
22. Lakshmi S, Goudar G, Singh M, Dhaliwal HS, Sharma P, Longvah T. Variability in resistant starch, vitamins, carotenoids, phytochemicals and in-vitro antioxidant properties among diverse pigmented grains. J Food Meas Char. 2021;15(3):2774–89.
23. Sanchez?Moreno C, Larrauri JA, Saura?Calixto F. A procedure to measure the antiradical efficiency of polyphenols. J Sci Food Agricult. 1998;76(2):270–6.
24. Cornell JA. Experiments with mixtures: an update and bibliography. Technometrics. 1979;21(1):95–106.
25. Sarteshnizi RA, Hosseini H, Bondarianzadeh D, Colmenero FJ. Optimization of prebiotic sausage formulation: effect of using β-glucan and resistant starch by D-optimal mixture design approach. LWT-Food Sci Technol. 2015;62(1):704–10. [CrossRef]
26. Sin HN, Yusof S, Hamid NSA, Rahman RA. Optimization of enzymatic clarification of sapodilla juice using response surface methodology. J Food Eng. 2006;73(4):313–9. [CrossRef]
27. Myers RH, Montgomery DC, Anderson-Cook CM. Response surface methodology: process and product optimization using designed experiments. Hoboken (NJ): John Wiley & Sons; 2016.
28. Weng WL, Liu YC, Lin CW. Studies on the optimum models of the dairy product Kou Woan Lao using response surface methodology. Asian-Aust J Anim Sci. 2001;14(10):1470–6. [CrossRef]
29. Cornell JA. A comparison between two ten-point designs for studying three-component mixture systems. J Qual Technol. 1986;18(1):1–15. [CrossRef]
30. Amin NAS, Anggoro DD. Optimization of direct conversion of methane to liquid fuels over Cu loaded W/ZSM-5 catalyst. Fuel. 2004;83(4-5):487–94. [CrossRef]
31. Pradhan D, Hoque M, Singh SK, Dwivedi M. Application of D-optimal mixture design and artificial neural network in optimizing the composition of flours for preparation of gluten-free bread: optimization of ingredient for preparation of gluten free bread. J Microbiol Biotechnol Food Sci. 2021;11(2):e3294. [CrossRef]
32. Shad MA, Haq N, Tanzila R, Ahmad HB, Mazhar H. Optimization of extraction efficiency of tannins from Cichorium intybus L.: application of response surface methodology. J Med Plants Res. 2012;6(28):4467–74.
33. Dooshima IB, Julius A, Abah O. Quality evaluation of composite bread produced from wheat, defatted soy and banana flours. Int J Nutr Food Sci. 2014;3(5):471–6. [CrossRef]
34. Akinjayeju O, Fagbemi TN, Ijarotimi OS, Awolu OO. Optimization and evaluation of some physicochemical and nutritional properties of cereal-based soya-fortified flours for dough meal. J Adv Food Sci Technol. 2019;6(1):40-59.
35. Ajiwe VIE, Nwaigbo BI. Quality evaluation of weaning foods formulated from some local cereals and legume blends. Int J Pure Appl Biosci. 2013;2(4):75–81.
36. Ndife J, Abdulraheem LO, Zakari UM. Evaluation of the nutritional and sensory quality of functional breads produced from whole wheat and soya bean flour blends. Afr J Food Sci. 2011;5(8):466–72.
37. Satish Kumar D, Sudha Devi G, Joseph Raju P, Dayakar Rao B. Development and standardization for preparation of doughnut using millets (jowar, pearl, ragi, little, kodo, barnyard, proso and foxtail). Int J Curr Microbiol Appl Sci. 2018;7(1):990–9. [CrossRef]
38. Prasanna BM, Vasal SK, Kassahun B, Singh NN. Quality protein maize. Curr Sci. 2001;81:1308–19.
39. Mashayekh M, Mahmoodi MR, Entezari MH. Effect of fortification of defatted soy flour on sensory and rheological properties of wheat bread. Int J Food Sci Technol. 2008;43(9):1693–8. [CrossRef]
40. Saleh AS, Zhang Q, Chen J, Shen Q. Millet grains: nutritional quality, processing, and potential health benefits. Comp Rev Food Sci Food Safety. 2013;12(3):281–95. [CrossRef]
41. Okpala LC, Okoli EC. Optimization of composite flour biscuits by mixture response surface methodology. Food Sci Technol Int. 2013;19(4):343–50. [CrossRef]
42. Soetan KO, Oyewole OE. The need for adequate processing to reduce the anti-nutritional factors in plants used as human foods and animal feeds: a review. Afr J Food Sci. 2009;3(9):223–32.
43. Bora P. Anti-nutritional factors in foods and their effects. J Acad Indust Res. 2014;3(6):285–90.
44. Sreeramulu D, Reddy C, Raghunath M. Antioxidant activity of commonly consumed cereals, millets, pulses and legumes in India. Indian J Biochem Biophys. 2009;46(1):112–5.
45. Khan IT, Nadeem M, Imran M, Ullah R, Ajmal M, Jaspal MH. Antioxidant properties of milk and dairy products: a comprehensive review of the current knowledge. Lipids Health Dis. 2019;18:1–13. [CrossRef]
46. Cota-Gastélum AG, Salazar-García MG, Espinoza-López A, Perez-Perez LM, Cinco-Moroyoqui FJ, Martínez-Cruz O, et al. Characterization of pasta with the addition of Cicer arietinum and Salvia hispanica flours on quality and antioxidant parameters. Italian J Food Sci. 2019;31(3):626–43. [CrossRef]
47. Sharma P, Gujral HS. Antioxidant potential of wheat flour chapattis as affected by incorporating barley flour. LWT-Food Sci Technol. 2014;56(1):118–23. [CrossRef]
48. Carrera GF. Diseño y análisis de experimentos industriales. Mexico City: Universidad Iberoamericana; 1998.
49. Khan S, Rustagi S, Singh A, Devi P. Optimization of millet-legume based composite flour, its rheology and use as pro-health ingredient in bakery industry. Plant Arch. 2021;21(2):35–43.