
1. INTRODUCTION
The mining industry has long been a cornerstone of economic development in the Caraga Region, Philippines. Recognized as the country’s “mining capital,” Caraga is the leading producer of nickel ore, generating approximately PhP 40 billion in revenue and contributing 21.1% of the total income from the national mining and quarrying industry – the highest share among all regions [1]. In addition, Caraga, among other regions, had the highest number of workers employed in the mining sector. While mining has significantly boosted economic growth and employment, it has also caused severe environmental degradation. Extensive soil degradation caused by the disposal of mine tailings and other by-products has created long-term ecological challenges. The mining industry is a major generator of solid waste, raising serious environmental concerns.
In response, the Philippine government has implemented mitigation strategies, allocating PhP 2.64 billion through the Environmental Protection and Enhancement Program and the Forest Management and Rehabilitation/Development Program to support environmental rehabilitation and management. Building on these initiatives, this study aims to develop a science-based rehabilitation strategy for a mined-out nickel site operated by Kafugan Mining Incorporated in Carrascal, Surigao del Sur. The strategy focuses on improving the chemical properties of degraded soils and restoring plant productivity through the application of organic amendments and biofertilizers. These amendments are widely recognized for their ability to enhance soil fertility, increase nutrient retention, improve water-holding capacity, and stimulate microbial activity – key processes in revitalizing soil health and ensuring sustainable plant growth.
Organic fertilizers are solid or liquid products derived from the substantial decomposition of plant and animal materials. These residues are rich in organic matter (OM) and essential nutrients such as nitrogen (N), phosphorus (P), and potassium (K). They play an important role in improving soil fertility and supplying nutrients to crops. In the rehabilitation of mined-out areas, commonly used organic fertilizers include poultry manure, compost, green manure, biochar, and other organic wastes. However, their nutrient contents are highly variable, and nutrient release is often slow due to the slow decomposition process. Furthermore, mined-out soils are typically characterized by low OM content, extreme acidity, limited nutrient availability, and toxic concentrations of aluminum and iron (Fe). To overcome these constraints, the combined use of biofertilizers has been recommended to enhance nutrient availability.
Biofertilizers are carrier-based inoculants containing beneficial microorganisms such as Trichoderma harzianum, Bacillus subtilis, and arbuscular mycorrhizal fungi (AMF) [2]. These microbes promote plant growth by solubilizing and mobilizing soil nutrients, enhancing nutrient uptake, and protecting plants against pathogens. Some species also immobilize or sequester heavy metals, reducing their toxicity to plants and further contributing to soil rehabilitation [3].
To evaluate the effectiveness of integrating organic fertilizers and biofertilizers, this study used Centrosema pubescens, a fast-growing forage legume, as the test crop. Centrosema is well-suited for mining rehabilitation because it fixes atmospheric nitrogen, improves soil fertility, and prevents erosion by serving as a ground cover [4]. When combined with organic fertilizers and microbial inoculants, it can further enhance soil restoration by increasing biomass production, improving soil OM, and elevating soil pH.
By addressing both soil rehabilitation and vegetative restoration, this study aims to assess the effects of organic amendments and biofertilizers on the soil chemical properties of mined-out soil and the growth performance of C. pubescens. Specifically, the study evaluates changes in soil chemical properties after harvest, examines plant growth responses – including plant height, stem diameter, foliage/leaf number, biomass accumulation, and nodule production – and identifies the most effective soil amendment treatment for enhancing plant growth in mined-out soils. The findings are expected to provide a science-based framework for mined-out land reclamation and to guide future rehabilitation efforts across post-mining landscapes in the region, contributing to improved soil health, plant productivity, and ecosystem resilience.
2. MATERIALS AND METHODS
2.1. Soil Sample Preparation and Analysis
A bulk soil sample was collected from Kafugan Mining Inc. in Carrascal, Surigao del Sur. The soil was air-dried and sieved through a 4-mm mesh. A subsample was taken and analyzed to determine the initial chemical properties, while the remaining samples were used for the pot experiment. Based on chemical analysis, the soil was characterized as very mildly alkaline with a pH of 7.18, moderately high in OM (3.8%), but deficient in key nutrients. Total N (0.104%), available P (1 ppm), and exchangeable K (22 ppm) and calcium (182 ppm) were classified as low, while copper (Cu) (0.69 ppm) and zinc (Zn) (0.93 ppm) were within the medium range. In contrast, the exchangeable magnesium (525 ppm) and sodium (17.7 ppm), available Fe (32.1 ppm), manganese (Mn) (54.4 ppm), and nickel (Ni) (4179 ppm) were categorized as high.
2.2. Organic Amendments Collection, Preparation, and Analysis
Chicken manure (CM), vermicast (VC), and rice husk biochar (RHB) were the organic amendments used in the study. The dried CM was procured from an agricultural store in Brgy. Ampayon, Butuan City, while VC was obtained from the vermiculture facility of the College of Agriculture and Agri-Industries, Caraga State University. RHB was made by heating rice husks at 500°C for 2 h under anaerobic conditions using a muffle furnace. Before use, all organic materials were sieved through a 2 mm mesh and analyzed for pH, total organic carbon (OC), N, P, and K.
2.3. Pot Experiment
A pot experiment was conducted to evaluate the effects of organic amendments and biofertilizer application on the growth performance of C. pubescens. The study employed six treatment combinations derived from two inoculation levels (without and with biofertilizers) and three rates of organic amendments (0, 15, and 30 g/kg soil). Each treatment was replicated 3 times, with two pots per treatment per replication, resulting in a total of 36 experimental pots. A minimum of three replications was used to ensure adequate statistical reliability and provide a valid basis for analysis of variance (ANOVA), while the inclusion of two pots per replication enhanced the accuracy and representativeness of the treatment means by reducing within-treatment variability. The experiment was arranged in a randomized complete block design. Randomization of treatment pots within the block or replication was done using the statistical tool for agricultural research (STAR) software (version 2.0.1).
Plastic pots measuring 3 × 3 × 8 inches were filled with 1.5 kg of air-dried mined-out soil. Organic amendments – CM, VC, and RHB – were combined in a 2:1:1 ratio (v/v) and applied at rates of 15 and 30 g/kg soil (dry weight basis). The amendments were thoroughly mixed with the soil before placement in the pots. Each pot received 462 mL of tap water to raise the soil moisture to approximately 75% of field capacity, after which the pots were incubated for 30 days to allow partial decomposition of OM and nutrient mineralization. To ensure uniform decomposition, the soils were manually mixed every 5 days. The incubation was conducted under screenhouse conditions, where temperatures ranged from 25°C at 9:00 a.m. to 45°C at 12:00 p.m. This temperature pattern reflects the actual environmental conditions at the study site. The same temperature range was also observed during the Centrosema pot trial, ensuring consistency between the incubation setup and the experimental conditions.
After incubation, each pot was planted with 10 seeds of C. pubescens and thinned to five (5) seedlings per pot 1 week after emergence. Pure cultures of T. harzianum and B. subtilis were obtained from the National Institute of Molecular Biology and Biotechnology in the University of the Philippines, Los Baños, Laguna. Carrier formulation and biofertilizer production were conducted in the Biofertilizer Laboratory of the College of Agriculture and Agri-Industries, Caraga State University. B. subtilis was produced using a solid carrier medium composed of soil and biochar, while T. harzianum was produced using cracked corn and biochar. AMF, on the other hand, was produced using a soil–sand–biochar media, with Mycovam used as the starter inoculum. The B. subtilis inoculant, with an initial population of 5 × 10¹¹ CFU/g, and AMF, with 5 spores/g, were applied at a rate of 30 g/pot. The application was carried out by digging a small hole at the center of each pot and placing the inoculants inside. Seeds of C. pubescens were then sown directly above the biofertilizer to ensure close contact between the inoculants and the roots of seedlings after emergence. For T. harzianum, 100 g of inoculant with an initial population of 1 × 10¹⁰ CFU/g was suspended in 16 L of water, and 300 mL of this suspension was applied per pot. The T. harzianum suspension was applied during planting and subsequently at 15 and 30 days after transplanting.
The experiment was conducted inside the screen house of the Biofertilizer Laboratory. Plants were watered as needed, and weeds were manually removed after emergence. Insect pests were controlled by handpicking. Growth parameters such as monthly plant height, stem diameter, and number of leaves were recorded. Plant height was measured from 1 inch above the soil surface to the tip of the longest leaf. Stem diameter was measured at the stem base using a vernier caliper, while foliage count was done manually per pot. Leaf area was estimated by manually measuring the length and width of ten sample leaves per pot using a ruler. The measured length and width were multiplied by a correction factor of 0.68, which accounts for the ovate and unlobed leaf morphology of Centrosema.
2.4. Harvesting
Plants were harvested three (3) months after transplanting. Each plant was cut close to the soil surface, and adhering soil particles were carefully removed from the roots. Shoots and roots were thoroughly washed with tap water, rinsed with distilled water, and air-dried to remove surface moisture. The samples were then oven-dried at 70°C until they reached a constant weight. After drying, the shoots and roots were weighed separately. Root nodules, on the other hand, were carefully detached from the roots, then counted and weighed. Root length was measured with a ruler, while the root-to-shoot ratio was calculated as the dry weight of roots divided by that of the shoots.
Soil chemical analyses were performed to evaluate the impacts of organic and biofertilizer applications. Soil samples right after harvest were air-dried and sieved. The processed samples were then submitted to the Regional Soils Laboratory at Butuan City for pH, total OM, total N, available P, exchangeable K, available Fe, Mn, Cu, Zn, and total Ni.
2.5. Statistical Analysis
The significance of treatment effects was assessed through ANOVA using the STAR software. Treatment means were compared using Tukey’s honest significant difference test at a 5% level of significance (P < 0.05). Pearson’s correlation analysis was also conducted to determine the associations among the selected variables. A total of 36 observations were included in the analysis, with each observation representing a paired soil–plant measurement taken from the same pot. All soil and plant data were properly paired to ensure statistical validity.
3. RESULTS AND DISCUSSION
3.1. Chemical Properties of Different Organic Amendments
Table 1 shows the chemical properties of the three organic amendments used in the study. CM and RHB exhibited alkaline pH levels, while VC was slightly acidic. Both CM and RHB contained more than 30% total OC, while VC had <20%. CM recorded the highest total N and K contents, both exceeding 3%, compared with VC and RHB, which contained <2%. Similarly, CM had the highest total P content (2.33%), followed by VC (0.99%), with RHB having the lowest (0.34%).
Table 1: Chemical analysis of the different organic amendments used in the study.
| Properties | Chicken manure | Vermicast | Rice hull biochar |
|---|---|---|---|
| pH | 8.19 | 6.57 | 7.98 |
| Total OC (%) | 44.15 | 18.89 | 31.82 |
| Total N (%) | 3.94 | 1.27 | 0.62 |
| Total P (%) | 2.33 | 0.99 | 0.34 |
| Total K (%) | 3.93 | 1.29 | 0.89 |
OC: Organic carbon, N: Nitrogen, P: Phosphorus, K: Potassium.
These results suggest that CM is the most nutrient-rich among the three amendments, particularly in terms of N, P, and K content, which are essential for shoot formation, root development, and overall plant vigor. The high OC content of CM and RHB may also improve soil structure and microbial activity. Furthermore, the alkaline pH exhibited by both CM and RHB is ideal for neutralizing soil acidity and raising soil pH. Combining these organic amendments and applying them to mined-out soil would greatly improve the nutrient level of the soil, leading to better plant growth and establishment.
3.2. Soil Chemical Properties
Tables 2-4 present the effects of organic amendments, biofertilizers, and their interaction on the chemical properties of mined-out soil. Significant variations were observed across several soil chemical parameters following treatment application. For instance, soil pH decreased with the application of organic amendments, declining by 0.10 units at the 15 g/kg rate and by 0.12 units at the 30 g/kg rate compared to the control (0 g/kg) [Table 3]. Interestingly, when organic amendments were combined with biofertilizers, the 15 g/kg rate increased the soil pH relative to the control, whereas the 30 g/kg rate produced values comparable to those of the control. Despite these variations, soil pH across all treatments remained within the slightly alkaline range. The observed reductions in pH with organic amendments are likely attributed to the release of organic acids during the decomposition of OM [5].
Table 2: Effects of organic amendments, biofertilizers, and their interaction on soil chemical properties and plant growth parameters.
| Parameter | Organic amendment rates (Factor A) | Inoculation type (Factor B) | AXB |
|---|---|---|---|
| pH | 0.003* | <0.001** | 0.005* |
| Total OM | <0.001** | 0.209ns | 0.103ns |
| Total N | <0.001** | 0.941ns | 0.200ns |
| Available P | <0.001** | 0.014* | 0.708ns |
| Exchangeable K | <0.001** | 0.062ns | 0.090ns |
| Available Cu | 0.001* | <0.001** | 0.805ns |
| Available Fe | <0.001** | 0.382ns | 0.047* |
| Available Mn | 0.026* | <0.001** | 0.009* |
| Available Zn | 0.040* | 0.018* | 0.273ns |
| Total Ni | 0.250ns | 0.038* | 0.699ns |
| Height at 1 month | 0.031* | <0.001** | 0.318ns |
| Height at 2 months | 0.004* | <0.001** | 0.004* |
| Height at 3 months | 0.039* | <0.001** | 0.067ns |
| Number of leaves | <0.001** | <0.001** | <0.001** |
| Leaf area | 0.092ns | <0.001** | 0.019* |
| Stem diameter | 0.352ns | <0.001** | 0.915ns |
| Root dry weight | 0.011* | <0.001** | 0.418ns |
| Shoot dry weight | 0.008* | <0.001** | 0.006* |
| Root length | 0.357ns | 0.008* | 0.476ns |
| Root: Shoot ratio | <0.001** | <0.001** | 0.005* |
| Nodule number | <0.001** | <0.001** | <0.001** |
| Nodule weight | <0.001** | <0.001** | <0.001** |
ns: Not significant,
* Significant at P<0.05;
** Significant at<0.01. N: Nitrogen, P: Phosphorus, K: Potassium, OM: Organic matter, Cu: Copper, Zn: Zinc, Mn: Manganese, Fe: Iron, Ni: Nickel.
Table 3: Interaction effects of organic amendments and biofertilizer applications on selected soil chemical properties.
| Inoculation type | Levels of organic amendments (g/kg) | pH | Available Fe (ppm) | Available Mn (ppm) |
|---|---|---|---|---|
| Without biofertilizers | 0 | 7.34±0.02a | 17.97±1.37a | 10.10±0.91a |
| 15 | 7.24±0.02b | 16.33±0.53b | 6.71±0.36b | |
| 30 | 7.22±0.01b | 15.63±0.88b | 6.22±0.47b | |
| With biofertilizers | 0 | 7.40±0.02b | 19.63±0.74a | 10.93±0.27a |
| 15 | 7.49±0.00a | 15.67±0.84b | 10.79±0.59a | |
| 30 | 7.34±0.04b | 15.57±0.87b | 11.61±1.06a | |
| F-values | 9.45 | 4.23 | 7.72 | |
| df | 2 | 2 | 2 | |
| Error MS | 0.002 | 0.52 | 1.07 | |
| SE | 0.03 | 0.59 | 0.84 |
Means in a column followed by the same letters are not significantly different at 5% level of significance. Mn: Manganese, Fe: Iron, df: Degrees of freedom, Error MS: Mean square error, SE: Standard error.
Table 4: Effects of organic amendments and biofertilizer applications on selected soil chemical properties.
| Treatments | OM (%) | Total N (%) | Available P (ppm) | Exchangeable K (ppm) | Available Cu (ppm) | Available Zn (ppm) | Total Ni (ppm) |
|---|---|---|---|---|---|---|---|
| Levels of organic amendments (g/kg) | |||||||
| 0 | 3.07±0.08c | 0.07±0.00c | 0.67±0.21c | 31.83±5.38c | 0.50±0.03b | 0.56±0.12b | 3,927.33±120.31 |
| 15 | 3.48±0.07b | 0.10±0.01b | 1.83±0.17b | 213.83±6.11b | 0.53±0.04b | 0.63±0.03ab | 3,766.83±70.84 |
| 30 | 3.97±0.10a | 0.13±0.00a | 3.67±0.21a | 406.67±17.39a | 0.58±0.04a | 0.83±0.05a | 3,706.33±88.57 |
| F-values | 32.70 | 54.21 | 88.21 | 447.08 | 13.93 | 4.51 | 1.60 |
| df | 2 | 2 | 2 | 2 | 2 | 2 | 2 |
| Error MS | 0.04 | 0.00 | 0.16 | 471.52 | 0.00 | 0.03 | 49025.07 |
| SE | 0.11 | 0.01 | 0.23 | 12.54 | 0.02 | 0.09 | 127.83 |
| Inoculation type | |||||||
| Without biofertilizers | 3.44±0.10 | 0.10±0.01 | 1.78±0.46b | 206.67±52.12 | 0.46±0.01b | 0.56±0.06b | 3,925.00±64.91a |
| With biofertilizers | 3.57±0.18 | 0.10±0.01 | 2.33±0.44a | 228.22±57.13 | 0.61±0.02a | 0.78±0.07a | 3,675.33±73.86b |
| F-values | 1.81 | 0.01 | 8.93 | 4.43 | 139.72 | 8.05 | 5.72 |
| df | 1 | 1 | 1 | 1 | 1 | 1 | 1 |
| Error MS | 0.04 | 0.00 | 0.16 | 471.52 | 0.00 | 0.03 | 49025.07 |
| SE | 0.09 | 0.00 | 0.19 | 10.24 | 0.01 | 0.08 | 104.38 |
Means in a column followed by the same letters are not significantly different at 5% level of significance. N: Nitrogen, P: Phosphorus, K: Potassium, Cu: Copper, Zn: Zinc, Ni: Nickel, df: Degrees of freedom, Error MS: Mean square error, SE: Standard error.
Table 5: Pearson correlation matrix of selected variables.
| Variable | Height @ 3 months | Shoot Dry Wt. | Root Dry Wt. | Nodule Number | Nodule Wt. | pH | OM | Total N | Available Cu | Available Fe | Available Mn | Available Zn | Available P | Available K | Total Ni | |
|---|---|---|---|---|---|---|---|---|---|---|---|---|---|---|---|---|
| Height 3 months | Pearson’s r | — | ||||||||||||||
| P-value | — | |||||||||||||||
| Shoot Dry Wt. | Pearson’s r | 0.962 | — | |||||||||||||
| P-value | < 0.001 | — | ||||||||||||||
| Root Dry Wt. | Pearson’s r | 0.972 | 0.948 | — | ||||||||||||
| P-value | < 0.001 | < 0.001 | — | |||||||||||||
| Nodule Number | Pearson’s r | 0.655 | 0.507 | 0.718 | — | |||||||||||
| P-value | 0.003 | 0.032 | < 0.001 | — | ||||||||||||
| Nodule Wt. | Pearson’s r | 0.654 | 0.494 | 0.686 | 0.973 | — | ||||||||||
| P-value | 0.003 | 0.037 | 0.002 | < 0.001 | — | |||||||||||
| pH | Pearson’s r | 0.782 | 0.718 | 0.795 | 0.548 | 0.446 | — | |||||||||
| P-value | < 0.001 | < 0.001 | < 0.001 | 0.018 | 0.064 | — | ||||||||||
| OM | Pearson’s r | 0.132 | 0.318 | 0.043 | -0.459 | -0.384 | -0.237 | — | ||||||||
| P-value | 0.602 | 0.199 | 0.864 | 0.056 | 0.116 | 0.344 | — | |||||||||
| Total N | Pearson’s r | -0.039 | 0.126 | -0.134 | -0.444 | -0.368 | -0.400 | 0.809 | — | |||||||
| P-value | 0.879 | 0.618 | 0.596 | 0.065 | 0.132 | 0.100 | < 0.001 | — | ||||||||
| Available Cu | Pearson’s r | 0.836 | 0.909 | 0.787 | 0.373 | 0.388 | 0.471 | 0.544 | 0.374 | — | ||||||
| P-value | < 0.001 | < 0.001 | < 0.001 | 0.128 | 0.111 | 0.049 | 0.020 | 0.126 | — | |||||||
| Available Fe | Pearson’s r | 0.144 | -0.025 | 0.155 | 0.529 | 0.544 | 0.156 | -0.502 | -0.474 | -0.004 | — | |||||
| P-value | 0.568 | 0.921 | 0.539 | 0.024 | 0.019 | 0.538 | 0.034 | 0.047 | 0.989 | — | ||||||
| Available Mn | Pearson’s r | 0.777 | 0.733 | 0.787 | 0.467 | 0.455 | 0.651 | 0.010 | -0.235 | 0.630 | 0.377 | — | ||||
| P-value | < 0.001 | < 0.001 | < 0.001 | 0.051 | 0.058 | 0.003 | 0.968 | 0.347 | 0.005 | 0.123 | — | |||||
| Available Zn | Pearson’s r | 0.476 | 0.531 | 0.443 | 0.268 | 0.327 | -0.005 | 0.532 | 0.450 | 0.621 | -0.249 | 0.232 | — | |||
| P-value | 0.046 | 0.023 | 0.066 | 0.282 | 0.185 | 0.985 | 0.023 | 0.061 | 0.006 | 0.318 | 0.355 | — | ||||
| Available P | Pearson’s r | 0.175 | 0.321 | 0.071 | -0.293 | -0.221 | -0.226 | 0.876 | 0.907 | 0.555 | -0.538 | -0.079 | 0.652 | — | ||
| P-value | 0.487 | 0.194 | 0.780 | 0.237 | 0.379 | 0.366 | <0.001 | <0.001 | 0.017 | 0.021 | 0.755 | 0.003 | — | |||
| Available K | Pearson’s r | 0.013 | 0.201 | -0.070 | -0.448 | -0.385 | -0.389 | 0.896 | 0.928 | 0.451 | -0.614 | -0.180 | 0.569 | 0.950 | — | |
| P-value | 0.960 | 0.424 | 0.784 | 0.062 | 0.114 | 0.111 | <0.001 | <0.001 | 0.060 | 0.007 | 0.476 | 0.014 | < 0.001 | — | ||
| Total Ni | Pearson’s r | -0.504 | -0.605 | -0.473 | -0.026 | -0.036 | -0.274 | -0.369 | -0.460 | -0.587 | 0.244 | -0.305 | -0.122 | -0.387 | -0.430 | — |
| P-value | 0.033 | 0.008 | 0.047 | 0.920 | 0.887 | 0.271 | 0.132 | 0.054 | 0.010 | 0.329 | 0.219 | 0.631 | 0.112 | 00.075 | — |
A similar interaction was observed for available Fe, where increasing rates of organic amendments reduced Fe content regardless of inoculation. In the absence of biofertilizers, Fe content decreased by 11%, whereas with biofertilizer application, the reduction reached 20%. This pronounced decline in Fe following organic amendment application may be attributed to its sorption onto OM surfaces, which restricts its mobility and availability in the soil [6]. Furthermore, the application of organic amendments significantly altered soil Mn concentration. At a 15 g/kg rate without biofertilizer, Mn levels decreased by 34%, while at 30 g/kg, the reduction reached 38%. This decline may be attributed to the formation of stable complexes between OM and Mn, which reduces its availability for plant uptake [7]. In contrast, the combined application of biofertilizers and organic amendments, regardless of rate, did not significantly affect soil Mn content.
Soil OM content increased substantially with the application of organic amendments [Table 4]. From 3.07% in the control, OM levels rose to 3.48% at 15 g/kg and 3.97% at 30 g/kg, representing 13% and 29% increases, respectively. In contrast, no significant variations were observed between inoculation types. Manure application increases OM by directly supplying OC and N to the soil [8]. Furthermore, a substantial increase in soil N, P, and K was observed after applying organic amendments. At 15 g/kg, N increased by 43%, while at 30 g/kg, it nearly doubled (86%) relative to the control. Phosphorus rose sharply, reaching 173% at 15 g/kg and 448% at 30 g/kg. Likewise, K content increased by 572% and 1,178% at the respective rates. Regardless of amendment rate, biofertilizer application increased soil P by 31% compared to the uninoculated treatments but had no significant effect on N and K, aside from slight increases. These marked improvements in nutrient concentrations can be attributed primarily to the direct nutrient inputs supplied by manure. The analysis shows that manures are rich in N, P, and K, and their application undoubtedly enhances soil nutrient concentrations [Table 1].
Significant variations in Cu, Zn, and Ni were observed with the application of organic amendments and biofertilizers [Table 4]. At 30 g/kg, organic amendments increased Cu content by 16%, while the 15 g/kg rate resulted in only a 6% increase, which was statistically comparable to the control. Additionally, soil Zn content increased with the application of manure. The highest concentration (0.83 ppm) was recorded in the 30 g/kg rate, representing a 48% increase relative to the control (0.56 ppm). This was followed by the 15 g/kg rate with 0.63 ppm Zn, an increase equivalent to 13% against the control. In contrast, Ni content did not significantly differ across amendment rates. Biofertilizer inoculation further increased Cu and Zn concentrations by 33% and 39%, respectively, while reducing Ni concentration by 6%. The observed increase in Cu and Zn may be attributed to improved nutrient solubility and mobility facilitated by biofertilizer activity.
Overall, the analysis showed that the application of organic amendments substantially improved most of the soil chemical parameters examined. The greatest improvement was observed at the 30 g/kg application rate, followed by the 15 g/kg rate, while the control treatment (0 g/kg) recorded the lowest values. Moreover, the effects of biofertilizer application were limited to certain soil chemical properties. Furthermore, the rise in nutrient concentrations observed in the study was attributed to the increase in soil OM. Correlation analysis showed that soil total N (r = 0.81**), available P (r = 0.88**), and K (r = 0.90**) were strongly and positively correlated with OM content [Table 5]. Likewise, a positive and moderate correlation between available Cu (r = 0.54*) and Zn (r = 0.53*) and OM content was observed. The observed increase in nutrient concentrations highlights the potential of organic amendments in rehabilitating degraded soils and promoting sustainable land restoration. Similar findings have been reported by [9,10].
Table 6: Interaction effects of organic amendments and biofertilizer applications on leaf production, biomass, root-to-shoot ratio, and nodule production of Centrosema.
| Inoculation type | Levels of organic amendments (g/kg) | Leaf number pot-1 | Leaf area (cm2) | Shoot dry weight (g/pot) | Root: shoot ratio | Nodule number pot-1 | Nodule weight (mg/pot) |
|---|---|---|---|---|---|---|---|
| Without biofertilizers | 0 | 12.50±0.58 | 1.17±0.18 | 0.36±0.02 | 0.80±0.02a | 0.00±0.00 | 0.00±0.00 |
| 15 | 11.67±1.09 | 0.90±0.20 | 0.32±0.02 | 0.68±0.05b | 0.00±0.00 | 0.00±0.00 | |
| 30 | 15.67±1.96 | 0.89±0.21 | 0.34±0.02 | 0.51±0.03c | 0.00±0.00 | 0.00±0.00 | |
| With biofertilizers | 0 | 51.17±0.60b | 5.93±0.54b | 3.09±0.07b | 0.26±0.00a | 13.33±0.60a | 301.33±14.80a |
| 15 | 79.67±5.64a | 6.01±0.32b | 4.13±0.20a | 0.20±0.01ab | 4.50±0.29b | 54.67±3.92b | |
| 30 | 76.00±3.40a | 6.86±0.05a | 4.29±0.33a | 0.18±0.01b | 1.67±0.17c | 69.33±8.45b | |
| F-values | 17.20 | 6.00 | 8.93 | 9.51 | 215.00 | 170.81 | |
| df | 2 | 2 | 2 | 2 | 2 | 2 | |
| Error MS | 20.18 | 0.10 | 0.07 | 0.00 | 0.26 | 168.15 | |
| SE | 3.67 | 0.25 | 0.22 | 0.03 | 0.42 | 10.59 |
Means in a column followed by the same letters are not significantly different at 5% level of significance. df: Degrees of freedom, Error MS: Mean square error, SE: Standard error.
3.3. Plant Height
Figures 1 and 2 present the effects of organic amendments and biofertilizer applications on the height of C. pubescens 3 months after planting. Plant height differed significantly between biofertilizer-treated and untreated plants. At 1 month after planting, uninoculated plants (without biofertilizers) were shorter, averaging 19.11 cm. In contrast, biofertilizer application, regardless of the organic amendment rate, significantly increased plant height to 34.83 cm – an 82% improvement compared to the uninoculated plants.
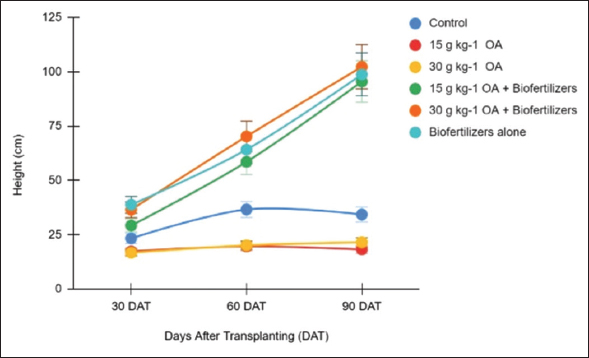 | Figure 1: Monthly plant height of Centrosema applied with organic amendments and biofertilizers. [Click here to view] |
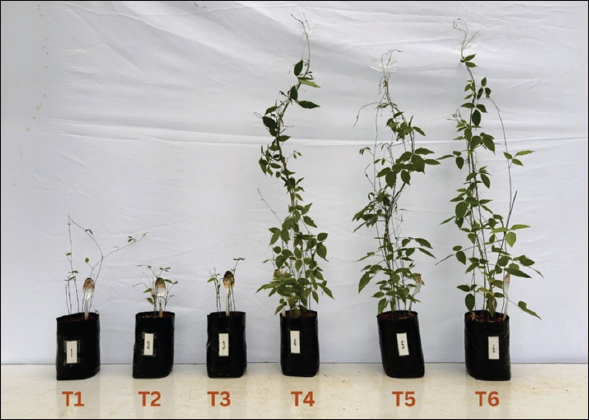 | Figure 2: Plant height of Centrosema at 3 months as affected by organic amendments and biofertilizers. T1 - 0 g/kg (Control), T2 - 15 g/kg organic amendments, T3 - 30 g/kg, T4 - 15 g/kg organic amendments+biofertilizers, T5 - 30 g/kg organic amendments+biofertilizers, T6 - Biofertilizers alone. [Click here to view] |
At 2 months, the growth-promoting effects of biofertilizers became more pronounced. Biofertilizer-treated plants reached an average height of 64.33 cm, significantly taller than uninoculated plants (25.43 cm), representing a 153% increase. After 3 months, visible growth differences continued, with biofertilizer-inoculated plants attaining an average height of 98.88 cm, compared to only 24.64 cm in the uninoculated treatments – a remarkable 301% increase. The tallest plants were recorded in the treatment with 30 g/kg organic amendments plus biofertilizers (102.32 cm), followed by biofertilizers alone (98.88 cm), and 15 g/kg organic amendments plus biofertilizers (95.52 cm).
Correlation analysis further revealed that plant height was strongly and positively associated with soil pH (r = 0.78**), Cu (r = 0.84**), and Mn (r = 0.78**), and moderately correlated with Zn (r = 0.48*) [Table 5]. Conversely, a significant negative correlation was observed with Ni (r = –0.50*). These results suggest that soil chemical properties, particularly pH and the availability of certain micronutrients, may play a crucial role in influencing the growth performance of Centrosema in mined-out soils.
Overall, these findings clearly indicate that biofertilizer application substantially enhances the growth of Centrosema. Conversely, organic amendments applied without biofertilizers did not result in significant plant height improvements. These results highlight the crucial role of biofertilizers in promoting plant development, especially under suboptimal soil conditions. A similar study by Gao et al. [11] demonstrated that biofertilizers integrated with organic fertilizers significantly enhanced plant growth parameters. This positive effect is likely due to the ability of biofertilizers to produce substantial amounts of growth-promoting hormones and to mobilize essential nutrients such as P and K in the soil, thereby improving nutrient uptake and overall plant development.
3.4. Foliage Number, Leaf Area, and Stem Diameter
Table 6 shows the foliage count of Centrosema in response to organic amendments and biofertilizer applications. In the absence of biofertilizers, the application of organic amendments, regardless of rate, did not significantly increase leaf number, with an average of 13.28 leaves. In contrast, biofertilizer application markedly enhanced foliage production, raising leaf number to 68.95, equivalent to a 419% increase compared to uninoculated plants. The highest leaf number was recorded in the combined biofertilizer and 15 g/kg organic amendment (79.67), followed by the 30 g/kg rate (76.00). These findings align with Siswanti and Riesty [12], who similarly reported significant improvements in leaf growth of spinach with biofertilizer application.
Leaf area also increased significantly with the combined application of organic amendments and biofertilizers. Without biofertilizers, organic amendments alone did not result in any significant increase compared to the unamended control (0 g/kg), with an average leaf area of only 0.90 cm2. However, when biofertilizers were applied, leaf area markedly increased to 5.93 cm2, even without organic amendments. The combined applications further enhanced leaf area, reaching 6.01 cm2 at 15 g/kg and 6.86 cm2 at 30 g/kg. On average, biofertilizer application increased leaf area by 533% compared to uninoculated treatments, regardless of organic amendment rate. The positive effects of biofertilizer application on leaf count and area may be attributed to enhanced nutrient availability. Moreover, the greater leaf area observed under the combined application of organic amendments and biofertilizers is likely attributed to the increase in soil pH and the greater availability of Mn.
A significant variation in stem diameter was observed between plants with and without biofertilizer application [Table 7]. Regardless of organic amendment rates, biofertilizers increased stem diameter by 58%. In contrast, organic amendments alone had no significant effect, and no interaction between organic amendments and biofertilizers was detected. These findings demonstrate the effectiveness of biofertilizers in promoting stem growth, even under nutrient-deficient mined-out soils. Biofertilizers such as T. harzianum, B. subtilis, and AMF support plant growth and development by producing growth hormones, solubilizing P and other nutrients, and enhancing root architecture [13-15]. Improved root systems increase the plant’s capacity to absorb water and nutrients, thereby boosting overall growth. Moreover, these biofertilizers stimulate systemic resistance and suppress soil-borne pathogens, contributing to improved plant health and resilience.
Table 7: Effects of organic amendments and biofertilizer applications on stem diameter, root dry weight, and root length of Centrosema.
| Treatments | Stem diameter (cm) | Root dry weight (g/pot) | Root length (cm) |
|---|---|---|---|
| Levels of organic amendments (g/kg) | |||
| 0 | 1.48±0.15 | 0.54±0.12a | 20.04±1.18 |
| 15 | 1.36±0.15 | 0.51±0.13a | 18.50±0.85 |
| 30 | 1.44±0.15 | 0.45±0.12b | 18.31±1.26 |
| F-values | 1.16 | 7.37 | 1.14 |
| df | 2 | 2 | 2 |
| Error MS | 0.02 | 0.00 | 4.67 |
| SE | 0.08 | 0.02 | 1.25 |
| Inoculation type | |||
| Without biofertilizers | 1.11±0.04b | 0.22±0.02b | 17.28±0.76b |
| With biofertilizers | 1.75±0.04a | 0.78±0.02a | 20.62±0.64a |
| F-values | 100.03 | 708.16 | 10.70 |
| Df | 1 | 1 | 1 |
| Error MS | 0.02 | 0.00 | 4.67 |
| SE | 0.06 | 0.02 | 1.02 |
Means in a column followed by the same letters are not significantly different at 5% level of significance. df: Degrees of freedom, Error MS: Mean square error, SE: Standard error.
3.5. Root and Shoot Dry Weight
Centrosema shoot weight was significantly affected by the interaction between biofertilizers and organic amendments [Table 6]. Without biofertilizers, shoot weight averaged only 0.34 g. However, when biofertilizer was applied, shoot weight increased to 3.84 g – a remarkable 1,029% improvement. Biofertilizer alone enhanced shoot weight by 758%, while the combined application with 15 g/kg and 30 g/kg organic amendments further increased shoot weight by 1,191% and 1,162%, respectively.
Furthermore, the application of organic amendments or biofertilizers significantly influenced root biomass production in Centrosema [Table 7]. Organic amendments alone, regardless of inoculation, slightly reduced root weight from 0.54 g/plant at 0 g/kg to 0.45 g/plant. In contrast, biofertilizer application markedly enhanced root biomass, increasing root weight from 0.22 g/plant (without biofertilizer) to 0.78 g/plant (with biofertilizer), representing a 254% improvement. However, no significant interaction effects were observed between organic amendments and biofertilizers. These improvements are likely due to enhanced nutrient availability and uptake facilitated by biofertilizer application. Correlation analysis further revealed that plant dry weight was strongly and positively correlated with soil pH (r = 0.80**), Cu (r = 0.79**), and Mn (r = 0.79**) [Table 5]. Soil pH regulates the availability of nutrients such as Cu and Mn, which play crucial roles in photosynthesis, enzyme activity, and antioxidant defense [16,17]. A significant increase in shoot and root weights of seedlings treated with biofertilizer was also reported by Tancic-Živanov et al. [18]. Microbial inoculants secrete organic acids that help solubilize bound nutrients in the soil, making them more available for plant uptake [19]. Additionally, these beneficial microbes produce phytohormones such as auxins, cytokinins, and gibberellins, which stimulate root development and enhance overall root architecture [13,20,21].
3.6. Root: Shoot Ratio and Root Length
The root-shoot ratio is defined as the proportion of root biomass to shoot biomass, reflecting the balance between the absorbing surface and the transpiring surface in plants. This ratio is important, as an adequate root-shoot balance helps prevent water and nutrient deficits and supports plant survival under nutrient-poor conditions [22]. In this study, the application of organic amendments without biofertilizers reduced the root-to-shoot ratio from 0.80 in the control (0 g/kg) to 0.51 at the 30 g/kg rate [Table 6]. A further decline was observed when biofertilizers were combined with organic amendments. On average, the root-to-shoot ratio in treatments without biofertilizers was 0.66, whereas with biofertilizer application, it dropped to 0.21. This represents a 68% reduction in the root-to-shoot ratio under inoculated treatments compared to uninoculated ones. A high root-shoot ratio generally indicates low soil fertility or other limiting conditions, as plants allocate more resources to root growth to optimize nutrient and water uptake. Conversely, a low root-shoot ratio suggests favorable soil fertility and resource availability, allowing plants to allocate more biomass to shoots to maximize photosynthesis [23]. Thus, the root-shoot ratio serves as an adaptive response to environmental conditions, enabling plants to balance resource acquisition and overall growth.
Moreover, root length increased with biofertilizer application [Table 7]. In uninoculated plants, root length averaged 17.28 cm, whereas with biofertilizer application, it increased to 20.62 cm, representing a 19% improvement. Biofertilizers enhance root length by producing phytohormones such as auxins, improving nutrient availability through solubilization, enhancing nutrient uptake, stimulating carbohydrate metabolism, and increasing tolerance to stresses such as drought and salinity, all of which collectively promote root development. Longer roots enhance plant access to vital soil resources such as water and nutrients, improving tolerance to drought and nutrient deficiencies, allowing them to grow taller and bigger.
3.7. Root Nodules
The root nodule count and weight of Centrosema are presented in Table 6. Nodules were formed only in treatments that received biofertilizers. In contrast, organic amendments alone did not induce nodule formation. The highest nodule count (13.33 nodules) was recorded in the sole biofertilizer treatment (without organic amendments), followed by 4.50 nodules at the 15 g/kg rate and 1.67 nodules at the 30 g/kg rate, both of which were combined with biofertilizers. A similar trend was observed for nodule weight, where the sole biofertilizer treatment produced the highest value (301.33 mg), while the 15 g/kg and 30 g/kg + biofertilizer treatments yielded 54.67 mg and 69.33 mg, respectively. Furthermore, both nodule count (r = 0.53*) and nodule weight (r = 0.54*) showed a positive and significant correlation with soil Fe content, indicating that higher Fe concentrations may have promoted greater root nodule formation [Table 5].
Root nodules are structures in leguminous plants, such as Centrosema, formed through symbiosis with N-fixing bacteria, including Rhizobium [24,25]. Interestingly, nodulation in this study may have been stimulated by the application of biofertilizers. Bacillus and Trichoderma are known to produce plant hormones, such as cytokinins and auxins, which stimulate cell division and root growth [26,27]. While they do not fix N directly, their hormone production may have created a more favorable root environment, enhancing the establishment of nodules by native symbiotic N-fixing bacteria. Moreover, AMF may have enhanced P acquisition, which plays a vital role in supporting plant growth and promoting nodulation [28].