
1. INTRODUCTION
Multiple pneumonia cases with unknown reasons appeared in Wuhan, Hubei, China, in late December 2019. Clinical presentations that were comparable to flu symptoms and viral pneumonia were among the cases. After virus isolation and viral genome analysis, the causative agent was discovered as a new coronavirus (CoV) on January 7, 2020, and was later called COVID-19 by WHO [1,2]. Due to the virus’s rapid human-to-human transfer, it soon spread throughout China and, eventually, the rest of the world. The CoV is a wide family of viruses, three of which have caused enormous outbreaks in the previous two decades, causing major health problems and economic burden. CoVs have been on the rise since the outbreaks of SARS-CoV and MERS-CoV in 2003 and 2012, respectively [2,3].
Signs and symptoms of COVID-19 disease vary from person to person and can fall into four categories: systemic, respiratory, gastrointestinal, and cardiovascular. The most popular symptoms include: cough, sore throat, fever, myalgia or arthralgia, fatigue, and headache, most of which have low sensitivity and high specificity [4]. The most widely used method for detecting COVID-19 cases is nucleic acid detection tests [5,6]. The current standard laboratory diagnosis method is real-time polymerase chain reaction, various protocols of which have been proposed globally. However, there are many considerable disadvantages to applying real-time PCR on a large scale in hospitals and laboratories. These drawbacks include high costs, turnaround time, restrictions on sample transportation, the need for infrastructure, and qualified personnel. Moreover, false negatives can result from poor sensitivity, low viral load, incorrect sampling techniques, incorrect sampling location, incorrect sampling time, inadequate conservation, and the presence of amplification inhibitors or mutations in the target regions [7,8].
The dynamics of the immune response against SARS-CoV-2 in COVID-19 patients is not fully understood. Recent reports showed that the presence of IgM, IgA, and IgG against SARS-CoV-2 in serum has been observed 3–10 days after illness onset [9-11]. The strongest response to IgA was observed at days 16–20 after symptom onset, while days 21–25 were for IgG response [9]. The enzyme-linked immune assay (ELISA) detection in the previous reports showed a positive rate for IgA of 88.2–92.7% at 3–10 days after symptoms onset, IgM of 76.5–85.4% at 3–10 days, and IgG of 64.7–100% at 4–20 days [9,12,13]. The presence of anti-SARS-CoV-2 antibodies was 60% among patients within the 1st week of onset, but rapidly increased to 100% by day 15 after symptoms onset [9,13,14]. Several reports showed that the positive rate for IgG was higher than that of IgM during early infection time (the first weak) [10,11,13,15,16]. However, other reports indicated that the positive rate for IgM was higher than that of IgG [9]. These observations indicate that IgA, IgM, and IgG against SARS-CoV-2 can be detected in the early stages of infection. The simultaneous detection of anti-SARS-CoV-2 IgA, IgM, and IgG antibodies has been considered to improve the sensitivity and accuracy of diagnosis [16].
Therefore, indirect diagnosis of SARS-CoV-2 based on the detection of antibodies can be developed to satisfy the need for a quick and low-cost test for emergency situations and on-site testing. The most common indirect tests are based on the rapid lateral flow assay (LFA), auto chemiluminescence immunoassay, and ELISA. Furthermore, the combination of genetic and antibody detection has shown a significant improvement in the sensitivity for COVID-19 diagnosis, particularly at the early stage of infection [14]. The LFA is an attractive technique for point-of-care detection. The LFA strip consists of four components: sample pad, conjugate pad, analytical membrane, and absorbent pad [17,18].
Here, we present the development of a LFA format for rapid simultaneous detection of the IgA/IgM/IgG antibodies against the SARS-CoV-2 virus, making use of the lateral flow test’s efficiency in giving quick, simple, and inexpensive analysis. Protein A has been shown to bind to the Fc region of IgG between the CH2 and CH3 domains, as well as F(ab)2 fragments of IgG from the human VH3 gene family. In addition, protein A can bind to the Fc portion of human IgA, IgM, and IgG [19,20]. Therefore, in this study, the LFA was established using protein A conjugated with gold nanoparticles (AuNPs) as a detector reagent.
Our test only requires about 10 μL of sample and just 15 min to complete. Test properties such as accuracy, sensitivity, specificity, stability, cross-reactivity, and anti-coagulant effect were evaluated by testing clinical specimens from positive COVID-19 patients and negative controls confirmed by real-time PCR. In this article, we also present the appearance of anti-protein N IgM and IgG antibodies in COVID-19 patients in Vietnam in periods after symptoms onset that provides further information about antibody responses to SARS-CoV-2 in COVID-19 patients.
2. MATERIALS AND METHODS
2.1. Materials
Gold (III) chloride trihydrate (HAuCl4.3H2O) and sodium tetraborate decahydrate were purchased from Sigma-Aldrich (St. Louis, MO, USA). Trisodium citrate, conjugate pad, and sample pad were purchased from Merck (Merck Millipore, MA, USA). The nitrocellulose membrane was purchased from Pall (USA). Absorption pad, PVC adhesive backing card, and housing case for strips were purchased from Shanghai JieYi Biotech Co. Ltd., (Shanghai, China). Protein A was purchased from Abcam (USA). The recombinant SARS-CoV-2 nucleocapsid protein (rNP-BK) was prepared and purified by our own research group. Monoclonal antibodies against SARS-CoV-2 nucleocapsid protein were purchased from MyBiosource (San Diego, USA). Gene encoding SARS-CoV-2 NP was optimized and chemically synthesized by Genscript (Piscataway, NJ, USA). ELISA kits (IVD.CoV-2 IgG and IVD.CoV-2 IgM) were approved by Vietnam Ministry of Health and supplied by POLYVAC. SARS-CoV-2 positive and negative serum/plasma samples were obtained from the National Hospital for Tropical Diseases, Vietnam. Other reagents are analytical quality and purchased from Sigma Aldrich, Merck Millipore (USA).
2.2. Cloning and Expression of the SARS-CoV-2 Nucleocapsid Protein
The full gene sequence encoding the SARS-CoV-2 nucleocapsid protein was optimized for Escherichia coli expression host using the Genscript’ OptimumGene™ algorithm (https://www.genscript.com/codon-opt.html). An optimized gene sequence was chemically synthesized by Gensrcript’s service. The recombinant SARS-CoV-2 nucleocapsid protein was expressed using the method described by Sambrook and Russell, 2001 [21] and purified following the manufacturer’s instructions.
2.3. ELISA
The SARS-CoV-2 nucleocapsid protein specific binding antibodies were analyzed by an ELISA kit according to the manufacturer’s instructions.
The activity of recombinant SARS-CoV-2 nucleocapsid protein (rNP-BK) was determined by the ELISA method. Briefly, 300 ng of rNP-BK or commercial SARS-CoV-2 N protein was coated on each well of the microtiter plate at 37°C for 1 h. The wells were blocked at 37°C for 1 h with 200 μL of 5% non-fat milk in phosphate buffered saline (PBS). After five washes with 1X PBS-T (1X PBS + 0.05% Tween), the corresponding wells were incubated with monoclonal antibodies (1 μg/mL) or serum (1/1000 dilution) for 1 h at 37°C. The wells were, then, washed and incubated with HRP-conjugated anti-human IgG antibody (1/1000 dilution) for 1 h at room temperature. After incubating with secondary antibody, the wells were washed with 1X PBS-T and developed with TMB substrate (0.01% of 3,3′,5,5′-Tetramethylbenzidine in 0.1 M citrate buffer, pH 5.0 and 0.0003% H2O2). Finally, the reaction was quenched by adding 1M H2SO4 and the signal intensity was measured at 450 nm.
2.4. Synthesis of Colloidal AuNPs
Synthesis of AuNPs of 20 nm was carried out according to the method described by Zhang et al. [18] with proper modifications. In brief, 100 mL of HAuCl4 (0.01%) was boiled for 5 min on a stirring hot plate; then, 2 mL of trisodium citrate was quickly added. The color of the solution will change from blue to dark red. After the color changed to dark red, the solution was boiled for a further 10 min. The solution was cooled down to room temperature and the optical density of the solution was scanned at a wavelength of 500–800 nm. The colloidal gold solution was stored at 4°C in dark condition.
2.5. Conjugation of Protein A to AuNP
Conjugation of protein A to AuNP was carried out according to the method described by Zhang et al. [18]. The colloidal AuNP solution (10 mL) was adjusted to the optimal pH by adding an appropriate amount of 0.2M K2CO3. Then, 0.1 mg of protein A was added into the AuNP solution and the mixture was incubated at room temperature for 1 h. The empty space on the AuNPs was blocked by adding 1/10 volume of 10% BSA and incubating for 15 min. The conjugate was collected by centrifugation at 8000 rpm for 50 min. The pellet was washed twice with 1% BSA in sodium borate. Finally, the conjugate pellet was resuspended in 1 mL of 20 mM sodium borate containing 1% BSA to generate the conjugate product of AuNP-Protein A.
2.6. Construction of the Lateral Flow Test Strip
The construction of the lateral flow test strip is composed of a sample pad (1.3 × 0.4 cm), a conjugate pad (0.6 × 0.4 cm), a nitrocellulose membrane (2.5 × 0.4 cm), and an absorbent pad (1.7 × 0.4 cm) [18]. The conjugate pad was generated by submerging the glass fiber pad in the conjugate solution and then drying at 37°C for 30 min. The recombinant SARS-CoV-2 nucleocapsid protein and protein A were immobilized on the nitrocellulose membrane at the T-line (0.9 μg/cm) and C-line (0.3 μg/cm) positions, respectively. These components were laminated on the PVC adhesive backing card [Figure 1]. Finally, the complete strip was assembled into a plastic housing case and stored in an aluminum bag containing a silica gel desiccant.
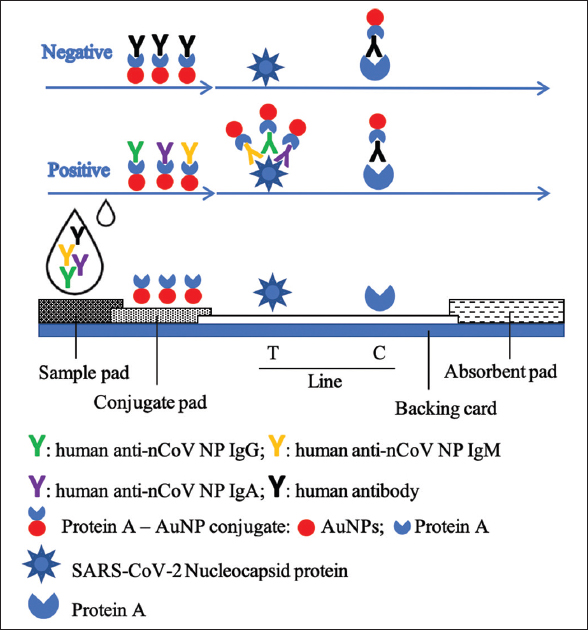 | Figure 1: The construction and operation of the lateral flow test strip for simultaneous detection of anti-SARS-CoV-2 IgA/IgM/IgG antibodies. [Click here to view] |
2.7. Test Procedure for the LFA Test Strip
Before the assay, test components (strip, buffer, and sample) were brought to room temperature. The test strip was placed on a clean, flat surface. Ten microliters of the specimen (serum/plasma) were dispensed into the center of the sample port (S label) of the strip without air bubbles, and then, 90–100 μL of the sample buffer (1X PBS, pH 7.4, containing 0.2% Tween-20) were added into the sample well. The liquid moved toward the absorbent pad under capillary force. During the movement, antibody (IgM/IgG/IgA) in the specimen reacts with the protein A-AuNP conjugate on the conjugate pad to form the complex of antibody-protein A-AuNP. This complex further moved to the nitrocellulose membrane part of the strip and was captured by the SARS-CoV-2 nucleocapsid protein immobilized at the test line (T-line) if anti-SARS-CoV-2 antibodies are present in the specimen to form a red T-line. This complex was also captured by protein A immobilized at the control line (C-line) to form a red band. The result was observed by the naked eye at the show window of the strip and recorded within 15 min. If both the T-line and C-line turn red, the sample is recorded as positive, indicating the presence of SARS-CoV-2 antibodies in the specimen. When the signal band appears at the only C-line, it is considered as negative. In the case of no colored band appearing at both T-line and the C-line on the nitrocellulose or only at T-line, this implicates an improper testing procedure or deterioration of the strip.
2.8. Specification of the Generated LFA Strip
Specifications of the generated LFA strip have been evaluated, including repeatability, reproducibility, sample volume, read time, effect of anticoagulants, stability, and cross-reactivity. For each test, three types of samples were used: negative, weak positive, and strong positive. The test results were recorded by naked-eye observation of the signal intensity of the T-line. The repeatability of the strip was determined by testing ten strips in the same batch with each type of sample. Reproducibility was determined by duplicate testing of the strips from three separate batches. For stability evaluation, the strips were stored in dry condition at an accelerated temperature (55 ± 1°C) for 4 weeks. For the effect of anticoagulants, Trisodium Citrate (TSC), Heparin, and EDTA were spiked to negative, weak positive, and strong positive samples at commonly used concentration, which were then tested with the generated LFA strip.
Serum/plasma specimens of several different diseases caused by other pathogens were used to evaluate the cross-reactivity of the generated LFA strip.
2.9. Clinical Evaluation
Six hundred and thirty-three clinical specimens were tested with the generated LFA strips, including 302 positive serum/plasma samples collected from people who tested positive for SARS-CoV-2 infection using a real-time PCR method and 331 negative serum/plasma samples collected from people who tested negative for COVID-19 (confirmed by real-time PCR and clinical signs).
2.10. Statistical Analysis
Sensitivity and specificity for the LFA test strip were calculated according to the following formulas:
Sensitivity (%) = (True positive/[True positive + False Negative]) * 100.
Specificity (%) = (True negative/[True negative + False Positive]) * 100.
Statistical analysis was performed using a tool in https://www.socscistatistics.com. P < 0.05 was considered statistically significant. The results were presented as mean ± standard deviation. The degree of agreement between the test strip and real-time PCR was measured using the Cohen’s Kappa test.
3. RESULTS AND DISCUSSION
3.1. The Presence of Anti-protein N IgM and IgG in COVID-19 Patients
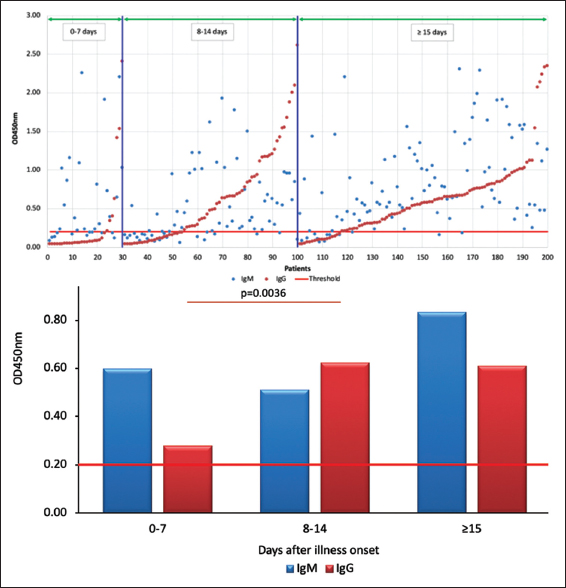
To understand the trends of anti-protein N IgM and IgG antibody responses during COVID-19 pathogenesis, serum/plasma samples from 200 individual patients were analyzed using an ELISA kit. The absorption intensity at 450 nm was plotted against periods after the onset of symptoms. The obtained results [Table 1] showed that at the early state of infection (0–7 days after illness onset), the presence of anti-protein N IgM (aN-IgM) was observed in 63.33% (19/30) of patients, while only 23.33% (7/30) of patients were positive for anti-protein N IgG (aN-IgG). The seropositive rate of aN-IgM and aN-IgG reached 70% (21/30). The observation rate in this study is higher than that observed by Sun 2020 [10] for non-ICU patients (58.3%). In the later phase after infection (8–14 days after illness onset), the presence of IgM and IgG in patients was similar (65.71%) and increased compared to the early state. After more than 15 days of illness onset, 88% and 83% of patients showed positive for anti-protein N IgM and IgG antibodies, respectively. Overall, among antiserum positive patients, 75% (124/165) of patients showed positive for both anti-protein N IgM and IgG antibodies. The previous report showed that the detection of IgM and IgG during the 8–13 days after onset had a positive rate of 65.1% and 77.18%, respectively. The positive rate reached 84.3% for IgM and 94.7% for IgG after more than 14 days of symptom onset [13]. The positive rate of IgG is higher than that in our report, but that of IgM is similar.
Table 1: The positive rates of protein N-specific IgM and IgG in serum samples obtained at different periods after illness onset.
| Days after illness onset | IgM | IgG | ||
|---|---|---|---|---|
| n | % | n | % | |
| 0–7 | 19/30 | 63.33 | 7/30 | 23.33 |
| 8–14 | 46/70 | 65.71 | 46/70 | 65.71 |
| ≥15 | 88/100 | 88.00 | 83/100 | 83.00 |
In terms of the appearance of IgM and IgG antibodies against SARS-CoV-2 during the period of 0–7 days after the onset of symptoms, IgM was mainly detected in our analysis (86.7% of patients had higher IgM than IgG titers, P < 0.05), which is also consistent with the mode of immune response to pathogens in general. However, it is also noted that, at this stage, some patients also have an earlier and higher IgG titer than IgM titer (13.3%), which is similar to the report by Long et al. [13]. In addition, our analysis exhibited an equal prevalence of IgM and IgG from day 8 to 14 (48.6% of patients had higher IgM than IgG and conversely, 41.4% for IgG). However, the analysis conducted at the period of 15 days after illness onset indicated that 71% of patients had higher IgM antibody titers than IgG (P < 0.005). In principle, the level of IgM will decrease and the level of IgG will increase after a period of infection. However, the analysis of 100 patients positive for COVID-19 15 days after the onset of symptoms showed that IgM continues to increase, but IgG tends to remain unchanged [Figure 2].
 | Figure 2: The positive rates and levels of anti-protein N IgM and IgG antibodies in COVID-19 patients in periods after symptoms onset (0–7 days, 8–14 days, and more than 15 days). [Click here to view] |
3.2. Production of SARS-CoV-2 Nucleocapsid Protein
The full length sequence encoding SARS-CoV-2 nucleoprotein was optimized to be compatible with the E. coli host strain and maximize the efficiency of gene expression [Figure S1 and Figure S2]. The optimized sequence was presented in the supporting information. The recombinant SARS-CoV-2 nucleocapsid protein (rNP-BK) was expressed in E. coli BL21(DE3) and purified using the Ni-NTA kit. The result is shown in Figure S3. The activity of rNP-BK was checked by the ELISA method using commercial monoclonal antibodies against SARS-CoV-2 and positive serum from COVID-19 patients as the primary antibody. The result showed that rNP-BK reacted with both commercial monoclonal antibodies (clones 2B3 and 9B3 from MyBiosource). The rNP-BK also strongly reacted with antibodies in the serum of COVID-19 patients and is comparable to commercial NP [Figure 3]. These results indicated that the rNP-BK produced in this study was active and suitable for further application.
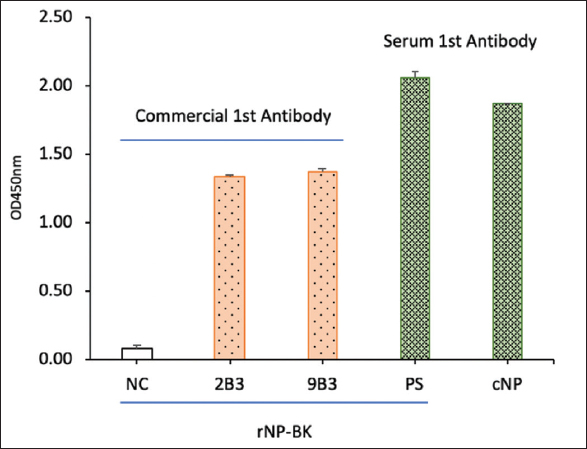 | Figure 3: Activity of recombinant SARS-CoV-2 nucleocapsid protein (rNP-BK) was checked by ELISA. NC, negative control; 2B3 and 9B3, two monoclonal antibodies against SARS-CoV-2 NP. PS: Positive serum from COVID-19 patient, cNP: Commercial NP from MyBiosource. [Click here to view] |
3.3. Generation of Lateral Flow Test Strip
The lateral flow test strip is composed of a sample pad, a conjugate pad, a nitrocellulose membrane, and an absorbent pad. The capture reagents were immobilized on the nitrocellulose membrane at the test line (T-line) and control line (C-line), respectively. All these components are attached to a PVC backing card. The test performance of the lateral flow test strip for detection of antibodies against virus the SARS-CoV-2 is significantly influenced by two critical components: AuNP-protein A conjugate and protein N-immobilized nitrocellulose membrane, both of which need to be controlled under optimal conditions in the generation of the test strip and will be addressed in this study.
The optimal pH for protein absorption on the AuNPs should be around or a little higher than the isoelectric point of the particular protein, at which point hydrophobic interactions dominate as electrostatic interactions subside [17,18]. The conjugation reaction was carried out at different pH conditions (7.0, 7.5, 8.0, 8.5, 9.0, 9.5, and 10.0). As shown in Figure 4, the conjugation reactions that happened at pH values of 7, 7.5, 8, 9.5, and 10 all led to false positive results. At pH values of 8.5 and 9.0, no false positive results were observed, while the color intensity of the test lines was the most significant. Hence, a pH value of 8.5–9.0 was chosen as the optimal level and used for further study.
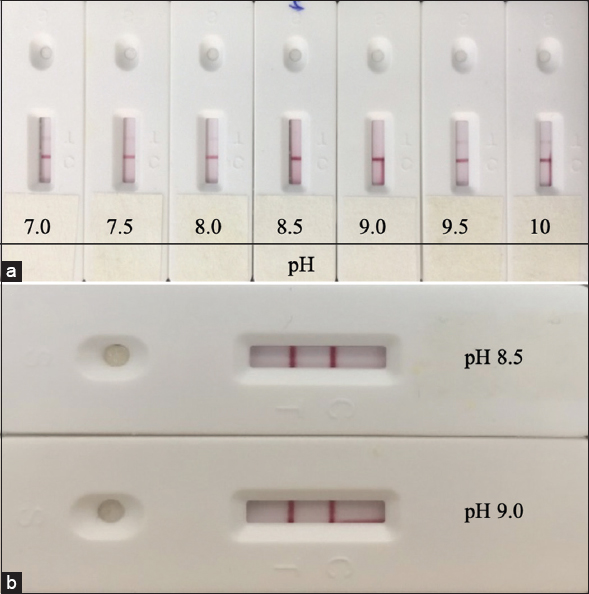 | Figure 4: The performance of LFA with conjugate preparation at various pH values was evaluated using a negative (a) and positive (b) sample. [Click here to view] |
As high concentration of protein on the T line can result in false negative and increase material cost, while low concentration can lead to low sensitivity and false negative, different concentrations of the protein N on the T line were investigated. The LFA test strips were generated with a range of protein N concentrations (0.3, 0.9, 1.5, and 3.0 μg/cm) and tested with both positive and negative samples. False negative results can be seen when the protein N concentration is 3.0 μg/cm or above [Figure 5]. When testing COVID-19 positive serum samples, though the color intensity of the T line increased as the concentration of protein N increased from 0.3 to 0.9 μg/cm, there was no significant change in the positive signal of the T line when the concentration jumped from 0.9 to 1.5 μg/cm. Therefore, 0.9 μg/cm was chosen for the generation of the LFA test strip.
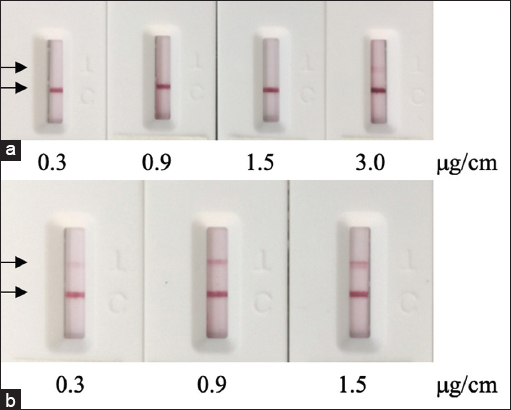 | Figure 5: Performance of the LFA strip with different amounts of immobilized recombinant SARS-CoV-2 nucleocapsid protein was tested with a negative sample (a) and a positive sample (b). [Click here to view] |
3.4. Characterization of the LFA Test Strip for Detection of Antibodies against the SARS-CoV-2 Virus
3.4.1. Repeatability and reproducibility of the LFA test strip
Repeatability and reproducibility are of important practical value in point-of-care testing strips. These parameters present the precision of a test strip [17].
While repeatability can be used to estimate within-run variability, reproducibility can be used to evaluate variability between lots. Following the guidelines of the WHO for in vitro diagnostics detecting antibodies to the SARS-CoV-2 virus, both the repeatability and reproducibility of the test strip were tested with one negative specimen, one low-reactive specimen (weak positive) and one moderately positive specimen (strong positive). For the repeatability examination, each type of sample was repeated with ten test strips from the same lot [Figure 6], while for the reproducibility examination, each type of sample was tested with three different lots [Figure 7]. No false positive results or any significant changes in the intensity of the T line between different test strips of the same lot or between different lots were observed. These results demonstrated that the LFA test strip has satisfactory repeatability and reproducibility.
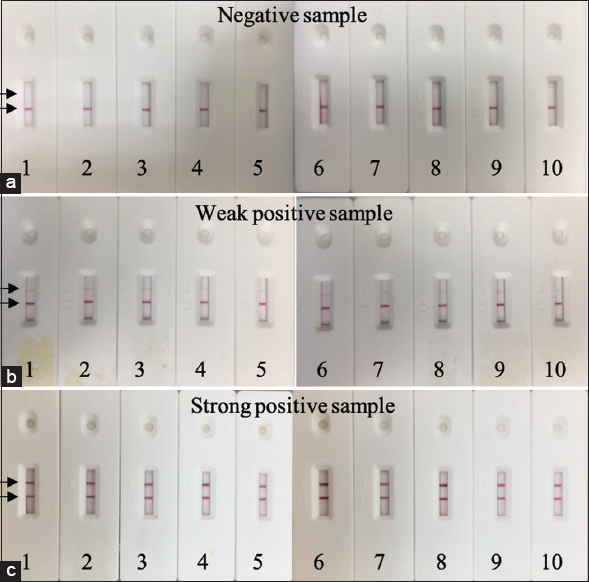 | Figure 6: Repeatability of the LFA test strip with negative samples (a), weak positive samples (b) and strong positive samples (c). Each type of sample was tested consecutively 10 times. [Click here to view] |
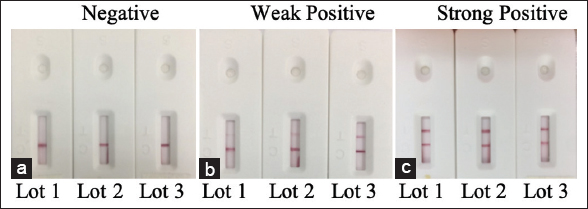 | Figure 7: Reproducibility of the LFA test strip with a negative sample (a), a weak positive sample (b), and a strong positive sample (c). Each type of sample was tested with three different lots. [Click here to view] |
3.4.2. Sample volume for the LFA test strip
The changes in sample volume used on the test strip can greatly affect the signal intensity of the test line. A small volume of sample may negatively influence the sensitivity of the test trip, while a large volume may result in a higher content of contaminants that can cause blockages or inhibit reaction at the T line. To determine the suitable sample volume for our assay, different sample volumes (1, 5, 10, and 20 μL) were tested with negative, weakly positive, and strongly positive samples. As shown in Figure 8, the color intensity of T line did not increase proportionally to the increase in sample volume. When the sample volume was changed from 10 to 20 μL, the intensity of both the T-line and C-line decreased. Previously, the decrease in signal intensity with increasing sample volume has been observed by Xia et al. [22]. This phenomenon may be due to other components in serum preventing interaction between the conjugated protein A and antibody or specific antibody and immobilized protein N. A loading sample of 5 or 10 μL is shown to result in the most significant color intensity at both the T and C lines. Therefore, this volume of sample is recommended for clinical use.
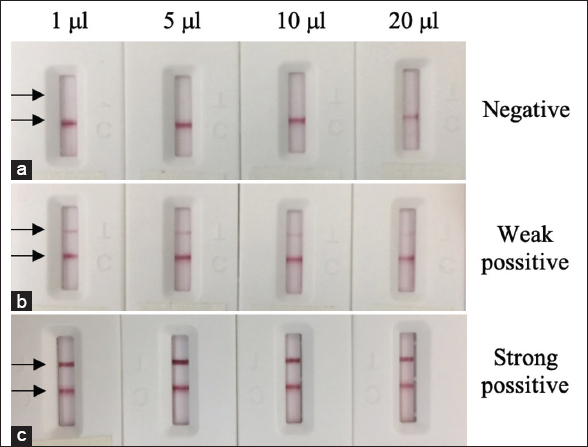 | Figure 8: Performance of the LFA test strip with different sample volumes of 1, 5, 10, and 20 µL. The assay was taken with negative (a), weak positive (b) and strong positive (c). [Click here to view] |
3.4.3. Read time for the LFA test strip
It is important to note that the sensitivity and specificity of the assay may change as time passes from the moment of sample loading. Therefore, read time is essential in determining the result of the test strip. While early reading may be subjected to high background and unsaturated signals, prolonged reading time may lead to false negative results. To determine the optimal read time, the generated FLA was tested with negative, weak positive, and strong positive samples and read at five different time points of 5, 10, 15, 20, and 30 min. The T-line can be seen clearly with the naked eye from as early as 5 min, while no false positives were observed for up to 30 min. However, after 10 min of loading, the result is still not conclusive due to the high background. At the 15-min mark, a clear background and the most significant intensity of the T line can be observed [Figure 9]. Thus, the optimal reading time was chosen to be 15 min.
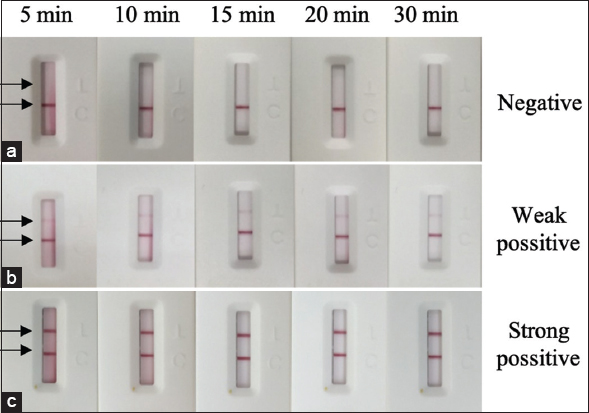 | Figure 9: Performance of the generated LFA strip with different reading time of 5, 10, 15, 20, and 30 min. The assay was taken with negative (a), weak positive (b), and strong positive (c). [Click here to view] |
3.4.4. Effect of anticoagulants on the LFA test strip
LFA can be used for various sample types, such as blood, saliva, urine, and extracts. In this study, the test strip was designed to detect SARS-CoV-2 antibodies in whole blood, serum, and plasma. In the case of plasma, as anticoagulants are often used in preserving patient’s plasma samples, it is important to test their possible effects on the performance of the test strip. In this study, the anticoagulants TSC, Heparin, and EDTA were spiked to negative, weak positive, and strong positive samples at commonly used concentrations, which were then tested with the test strip. No significant changes were observed in the test lines of the tested strips [Figure 10]. Hence, the performance of the LFA test strip was not affected by these anticoagulants.
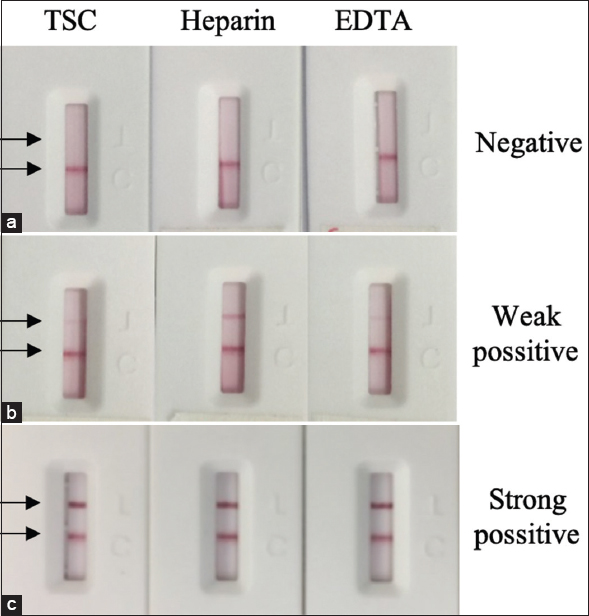 | Figure 10: The effect of anticoagulants (Trisodium citrate – TSC, Heparin, EDTA) on the LFA test strip performance. The assay was taken with negative (a), weak positive (b) and strong positive (c). [Click here to view] |
3.4.5. Stability of the test strip
An accelerated study should be performed to guarantee the stability at higher temperatures that may easily occur during transportation and to extrapolate findings to projected real-time stability. In this study, the stability of the test strip was investigated at an accelerated temperature (55 ± 1°C) for 4 weeks. The result showed that there was no change in the signal intensity at the T and C lines after 4 weeks of storage [Figure 11]. The obtained results indicated that the LFA strips are stable for at least 4 weeks when stored unopened in an accelerated temperature condition. This property of the test strip is very valuable for its on-site application.
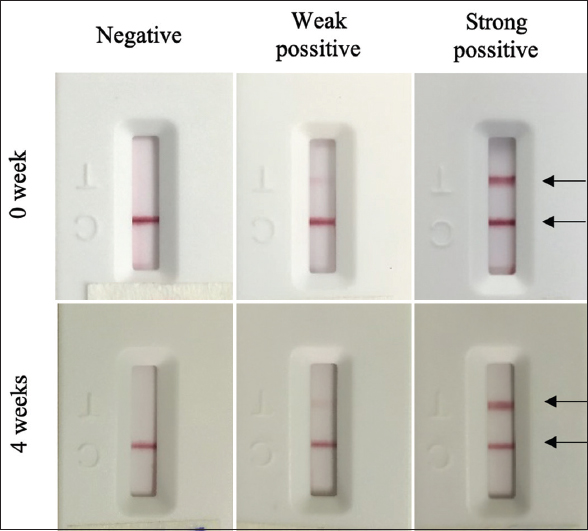 | Figure 11: Stability of the LFA test strip. [Click here to view] |
3.4.6. Cross-reactivity of the LFA test strip
In practical application, samples containing high-titer antibodies to microorganisms of similar structure to SARS-CoV-2 could potentially result in false positives. Following the guidelines of WHO for in vitro diagnostics detecting antibodies to the SARS-CoV-2 virus, the cross-reactivity of the generated LFA strip was evaluated by testing serum/plasma containing antibodies against the following microorgansims: influenza A virus (5 samples), Rubella (four samples), Respiratory syncytial virus (three samples), Mycobacterium tuberculosis (three samples), Hepatovirus A (three samples), Hepatovirus B (19 samples), Hepatovirus C (13 samples), Hepatovirus E (one sample), Streptococcus pyogenes (three samples), Streptococcus pneumoniae – (two samples), Human Immunodeficiency virus (one sample), Dengue virus (three samples), Mycoplasma (one sample), Bordetella pertussis (one sample), and Measles virus (one sample). No tested strips showed visible T lines [Figure 12], which indicated the test’s satisfactory specificity.
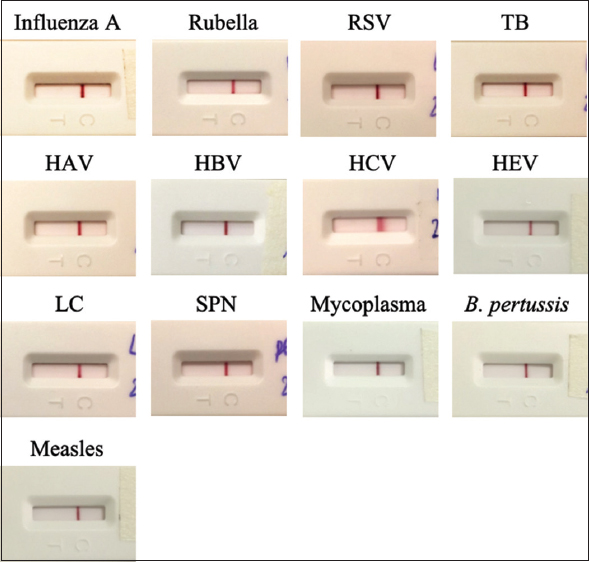 | Figure 12: Cross-reactivity of the LFA test strip with interfering microorganisms: influenza A virus, Rubella virus, Respiratory syncytial virus - RSV, Mycobacterium tuberculosis - TB, Hepatovirus A - HAV, Hepatovirus B - HBV, Hepatovirus C - HCV, Hepatovirus E - HEV, Streptococcus pyogenes, Streptococcus pneumoniae - SPN, Human Immunodeficiency virus - HIV, Dengue virus, Mycoplasma, Bordetella pertussis, Measles virus. [Click here to view] |
3.5. Clinical Evaluation of the LFA Test Strip
To confirm the performance of the FLA test strip in practical use, this section provides the necessary clinical data and analysis to verify and quantify the sensitivity and specificity of the test. In this study, clinical specimens were confirmed to be positive and negative with the SARS-CoV-2 virus by a real-time PCR reference method. Clinical evaluation of the generated LFA strip was determined by testing 302 positive and 331 negative specimens with SARS-CoV-2. According to Table 2, the test has a sensitivity of 91.06% (95% CI: 87.31–93.78%) and a specificity of 98.79% (95% CI: 96.93–99.53%). This result is comparable to some commercial test kits such as COVID-19 IgG/IgM Rapid Test Cassette (https://www.fda.gov/media/138438/download), QuickStripe™ SARS CoV-2 IgG/IgM from Savyon Diagnostics (https://www.savyondiagnostics.com/product/quickstripe-sars-cov-2-igg-igm-2/), Megna Health Rapid COVID-19 IgM/IgG combo test kit (https://www.fda.gov/media/140297/download). Overall percent agreement of the generated LFA strip with the real-time PCR method was 95.10% (95% CI: 93.13–96.53) [Table 2]. The sensitivity of the LFA strip was 73.17% (95% CI: 58.07–84.30%) with specimens collected within a week of symptom onset, 87.50% (95% CI: 78.99–92.87%) with samples collected 8–14 days later, and 97.97% (95% CI: 94.21–99.31%) with samples collected after 15 days. The study utilized the calculation of the weighted Kappa statistics (K test) to compare the LFA test strip with real-time PCR results. The K value of 0.902 indicates almost perfect agreement and correlation. The ultimate goal of the study is to create a quick and reliable method to detect antibodies against SAR-CoV-2 directly with the naked eye. This result demonstrated that the generated LFA strip could be used to diagnose patients’ positivity with COVID-19 at an early stage with high accuracy.
Table 2: Statistical analysis of the testing results of the LFA test strip with clinical samples.
| Real-time PCR test result | ||||
|---|---|---|---|---|
| Positive | Negative | Total | ||
| LFA test result | Positive | 275 | 4 | 279 |
| Negative | 27 | 327 | 354 | |
| Total | 302 | 331 | 633 | |
| Sensitivity | 91.06% (275/302) 95% CI: 87.31–93.78% | |||
| Specificity | 98.79% (327/331) 95% CI: 96.93–99.53% | |||
| Overall Percent Agreement | 95.10 (602/633) 95% CI: 93.13–96.53 | |||
4. CONCLUSIONS
COVID-19 is probably one of the biggest pandemics in the last 100 years on a global scale. COVID-19 has affected 220 countries and territories in terms of health, life, and the economy. The epidemic situation is still increasing in several countries. Rapid and accurate diagnosis could help control the disease better. Molecular and immunological methods have been simultaneously applied to effectively diagnose COVID-19. The simultaneous serological IgA, IgM, and IgG detection could provide a security strategy to prevent virus spreading. The rapid test strip is suitable for massive testing, which could help in identifying and promptly isolating COVID-19 patients and ultimately contributing to the shared global efforts to combat COVID-19.
Our research has provided preliminary data on the humoral immune responses of COVID-19 patients in Vietnam. Consistent with the previous reports, anti-SARS-CoV-2 IgM and IgG antibodies were present simultaneously in the majority of COVID-19 patients. We have successfully developed a test strip for the simultaneous detection of anti-SARS-CoV-2 IgA, IgM, and IgG antibodies in COVID-19 patients. The test strip has several advantages, such as simple and rapid use, fewer sample requirements, cost-effectiveness, high sensitivity, and specificity. The specifications of the test could mainly meet the WHO requirement for a test that could be used for diagnostic testing. The test strip is considered a point-of-care device for the effective diagnosis of COVID-19 patients.
5. ACKNOWLEDMENT
The authors would like to thank Dr. Pham Ngoc Thach, Dr. Van Dinh Trang and staff from the National Hospital for Tropical Diseases, Vietnam for your support.
6. AUTHORS’ CONTRIBUTIONS
All authors made substantial contributions to conception and design, acquisition of data, or analysis and interpretation of data; took part in drafting the article or revising it critically for important intellectual content; agreed to submit to the current journal; gave final approval of the version to be published; and agree to be accountable for all aspects of the work. All the authors are eligible to be an author as per the international committee of medical journal editors (ICMJE) requirements/guidelines.
7. FUNDING
There is no funding to report.
8. CONFLICTS OF INTEREST
The authors declare that they have no conflicts of interest in relation to this article.
9. ETHICAL APPROVALS
This study was approved by the Research Ethical Committee of the National Hospital for Tropical Diseases, Vietnam.
10. DATA AVAILABILITY
All data generated and analyzed are included within this research article.
11. PUBLISHER’S NOTE
This journal remains neutral with regard to jurisdictional claims in published institutional affiliation.
12. SUPPORTING INFORMATION
Optimization of gene sequence encoding SARS-CoV-2 nucleocapsid protein (S1).
The optimized sequence encoding SARS-CoV-2 nucleocapsid protein compatible for expression in Escherichia coli host (S2).
Expression and Purification of rNP-BK (S3).
REFERENCES
1. Biswas A, Bhattacharjee U, Chakrabarti AK, Tewari DN, Banu H, Dutta S. Emergence of novel coronavirus and COVID-19:Whether to stay or die out?Crit Rev Microbiol 2020;46:182-93. [CrossRef]
2. Keni R, Alexander A, Nayak PG, Mudgal J, Nandakumar K. COVID-19:Emergence, spread, possible treatments, and global burden. Front Public Health 2020;8:216. [CrossRef]
3. Guarner J. Three emerging coronaviruses in two decades. Am J Clin Pathol
4. Struyf T, Deeks JJ, Dinnes J, Takwoingi Y, Davenport C, Leeflang MM,
5. Hanson KE, Caliendo AM, Arias CA, Englund JA, Lee MJ, Loeb M,
6. Hong KH, Lee SW, Kim TS, Huh HJ, Lee J, Kim SY,
7. Russo A, Minichini C, Starace M, Astorri R, CalòF, Coppola N,
8. Rahbaria R, Moradib N, Abdi M. rRT-PCR for SARS-CoV-2:Analytical considerations. Clin Chim Acta 2021;516:1-7. [CrossRef]
9. Ma H, Zeng W, He H, Zhao D, Jiang D, Zhou P,
10. Sun B, Feng Y, Mo X, Zheng P, Wang Q, Li P,
11. Hou H, Wang T, Zhang B, Luo Y, Mao L, Wang F,
12. Guo L, Ren L, Yang S, Xiao M, Chang D, Yang F,
13. Long QX, Liu BZ, Deng HJ, Wu GC, Deng K, Chen YK,
14. Zhao J, Yuan Q, Wang H, Liu W, Liao X, Su Y,
15. Pieri M, Nuccetelli M, Nicolai E, Sarubbi S, Grelli S, Bernardini S. Clinical validation of a second generation anti-SARS-CoV-2 IgG and IgM automated chemiluminescent immunoassay. J Med Virol2021;93:25238. [CrossRef]
16. Nuccetelli M, Pieri M, Gisone F, Bernardini S. Combined anti-SARS-CoV-2 IgA, IgG, and IgM detection as a better strategy to prevent second infection spreading waves. Immunol Invest 2022;51:233-45. [CrossRef]
17. Ching KH. Lateral flow immunoassay. Methods Mol Biol2015;1318:127-37. [CrossRef]
18. Zhang G, Guo J, Wang X. Immunochromatographic lateral flow strip tests. Methods Mol Biol 2009;504:169-83. [CrossRef]
19. Deisenhofer J. Crystallographic refinement and atomic models of a human Fc fragment and its complex with fragment B of protein A from
20. Sasso EH, Silverman GJ, Mannik M. Human IgA and IgG F(ab')2 that bind to staphylococcal protein A belong to the VHIII subgroup. J Immunol 1991;147:1877-83.
21. Sambrook JF, Russell DW. Molecular cloning:a laboratory manual. 3rd ed. New York:Cold Spring Harbor Laboratory Press;2001.
22. Xia G, Wang J, Liu Z, Bai L, Ma L. Effect of sample volume on the sensitivity of lateral flow assays through computational modeling. Anal Biochem 2021;619:114130. [CrossRef]
SUPPLEMENTARY FIGURE LEGENDS
Supporting Information
Optimization of gene encoding SARS-CoV-2 nuceloprotein
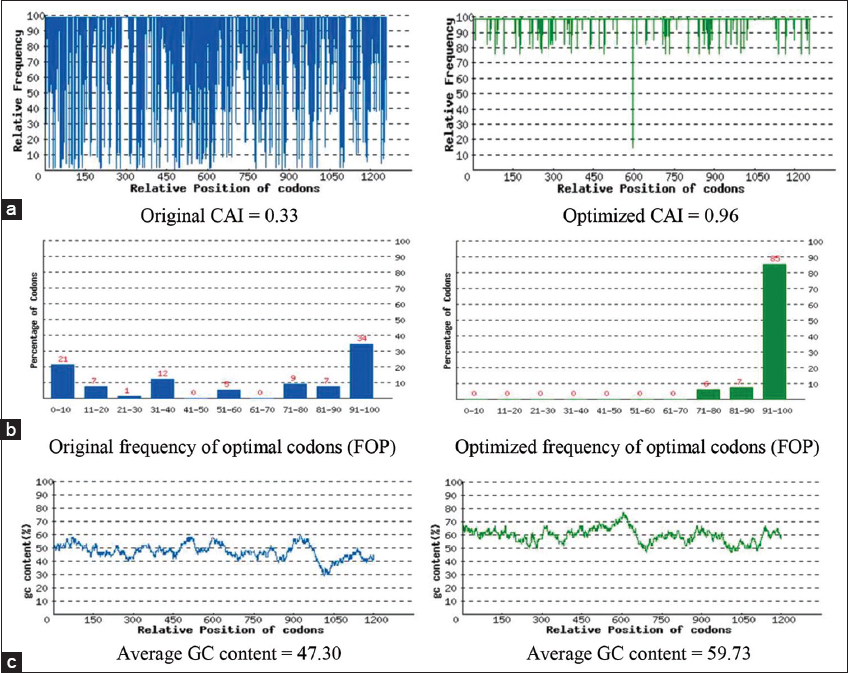 | Figure S1: (a) The distribution of codon usage frequency along the length of the gene sequence. A Codon Adaptation Index (CAI) of 1.0 is considered to be perfect in the desired expression organism, and a CAI > 0.8 is regarded as good, in terms of high expression level. (b) The percentage distribution of codons in computed codon quality group. The value of 100 is set for the codon with the highest usage frequency for a given amino acid in the desired expression organism. (c) The GC content adjustment. The ideal percentage range of GC content is between 30% and 70%. Peaks of %GC content in a 60 bp window have been removed. [Click here to view] |
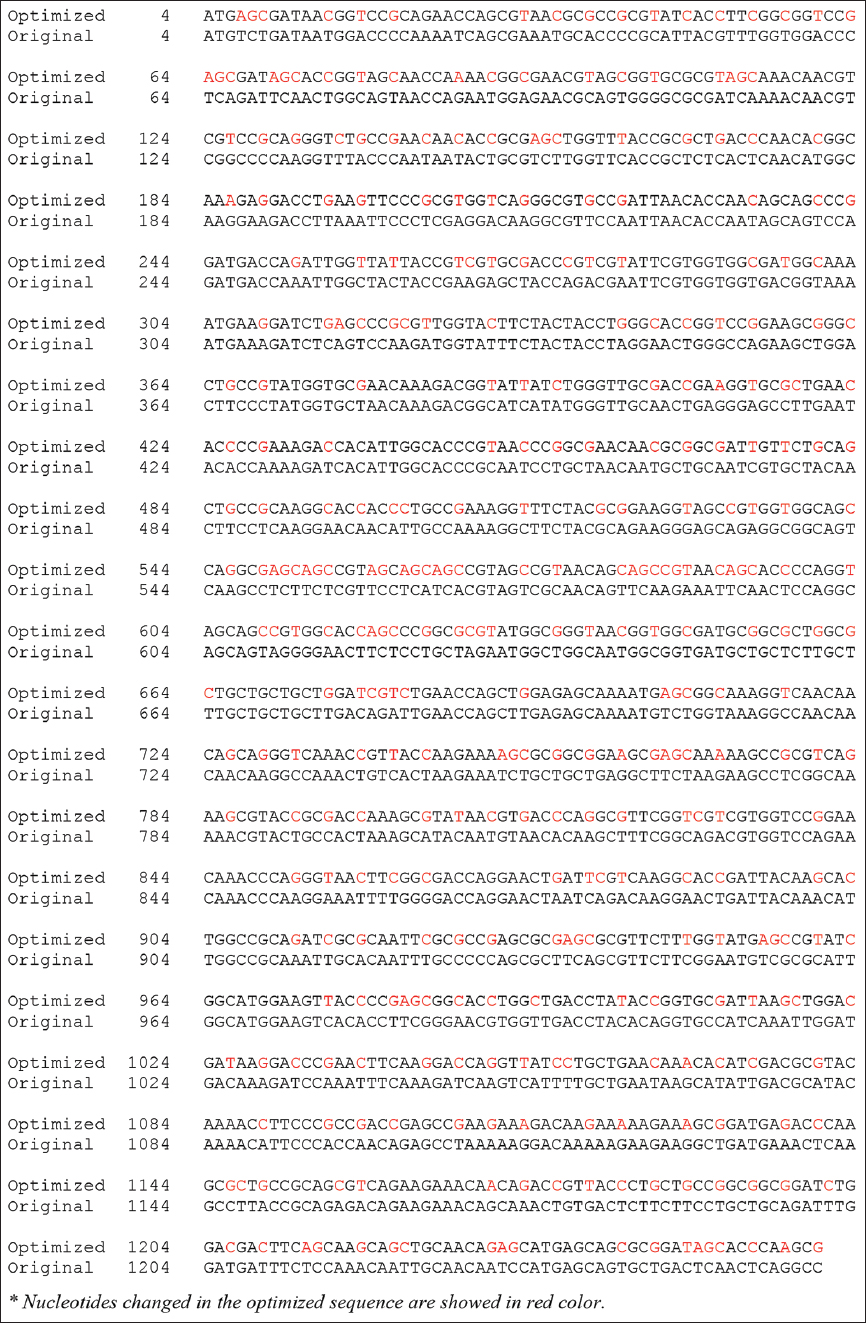 | Figure S2: The optimized gene sequence encoding SARS-CoV-2 nucleoprotein. [Click here to view] |
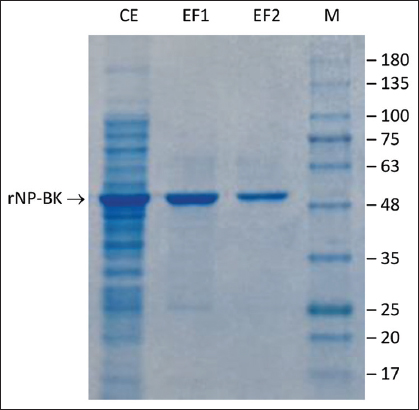 | Figure S3: SDS-PAGE of recombinant SARS-CoV-2 nucleoprotein (rNP-BK). CE, crude extract from recombinant Escherichia coli BL21 (DE3) after induction; EF1 and EF2, Eluted Fractions before and after imidazole removal; M, GangNam-STAIN Prestained Protein Ladder (iNtRON Biotechnology, Korea). [Click here to view] |