
1. INTRODUCTION
Rubella is a mild infectious disease caused by a virus that is usually harmless in children and adults but can lead to serious complications in pregnant women. The rubella virus is a member of the family Matonaviridae and is classified as an RNA virus [1]. It is spread primarily through airborne respiratory droplets when an infected person coughs or sneezes. Symptoms of rubella include mild fever, a skin rash, swollen lymph nodes, conjunctivitis, headache, and postnasal drip. Symptoms appear 2 to 3 weeks after exposure and last about 1 week. Rubella virus can be detected in the nasopharynx from 7 days before to 14 days after the rash onset and found in the blood at days 7–9 after exposure [2]. After infection, rubella virus is significantly found in the throat [3]. The titer of rubella virus in the throat is higher than that in serum/plasma, urine, and PBMCs. Rubella viral load remains high level in the throat 2 days after rash onset [2]. Therefore, a throat swab could be considered a suitable clinical specimen for the early detection of rubella. Rubella virus can also be found in several organs of infected individuals, such as the heart, liver, spleen, lung, eye, urine, stool, skin, conjunctival sacs, and synovial fluid. [4].
There is no specific treatment, but acetaminophen and hydration can help relieve symptoms. Global health agencies aim to eliminate rubella worldwide through vaccination, surveillance, and outbreak response. Rubella can be prevented by vaccines; however, the rubella disease is still endemic in many developing countries and has the potential to threaten maternal and child health. Outbreaks can easily lead to new epidemics in susceptible populations. For pregnant women, infection with the rubella virus can seriously affect the fetus and lead to congenital rubella syndrome. This can result in severe birth defects, including deafness, cataracts, heart problems, and intellectual disability [5].
Rubella is typically diagnosed based on symptoms, exposure history, and blood tests to detect antibodies. Early detection of rubella through screening and rapid diagnostics is crucial to reduce public transmission, control the circulation of the virus, and mitigate the illness caused by this virus. A timely and accurate diagnosis helps doctors determine the optimal management and treatment course for patients with rubella infection.
Some methods were applied to detect rubella virus in patients, such as virus isolation, immunoassay, and molecular biology [6]. Virus isolation is time-consuming and difficult to isolate in some specimens [2]. For immunoassay, the detection of rubella virus-specific immunoglobulin (Ig) M is not feasible until 4–5 days after the onset of typical symptoms [7]. The detection of viral RNA by molecular biology techniques such as reverse transcription-polymerase chain reaction (RT-PCR) [8], RT-PCR plus hybridization [3], nested RT-PCR, and real-time RT-PCR will provide reliable evidence of rubella virus infection and evenly quantitate virus titers in specimens [9-11]. Currently, the detection of rubella virus usually uses molecular biological methods. However, the application of these methods requires a well-equipped laboratory, professional staff, and a high cost. These conditions make it difficult to be widely applied, especially in medical units that are not well equipped. The lateral flow immunochromatographic assay is a suitable technique for point-of-care diagnosis. The test strip has several advantages, such as fast results, easy implementation, no required equipment, and being inexpensive. Currently, there are no commercial diagnostic products for the detection of rubella virus antigen using immunochromatographic methods worldwide [12], so developing such an assay has tremendous practical importance. In this report, we present the development and characterization of a lateral flow immunochromatographic assay test strip for rapid detection of rubella virus antigen. This is the first report on the development of an immunochromatographic assay for rapid detection of rubella virus antigen.
2. MATERIALS AND METHODS
2.1. Materials
Hydrogen tetrachloroaurate (III) trihydrate (HAuCl4.3H2O), 4-(2-hydroxyethyl)piperazine-1-ethanesulfonic acid (HEPES), bovine serum albumin (BSA), sodium borate, sucrose, and Tween-20 were purchased from Sigma-Aldrich (St. Louis, MO, USA). Protein A was purchased from Abcam (USA). Materials for the test strips were purchased from Pall (USA) and Shanghai JieYi Biotech Co. Ltd. (Shanghai, China). Commercial anti-rubella virus antibody was purchased from Fitzgerald (USA). Other reagents were also purchased from Merck Millipore, Sigma Aldrich (USA). Rubella virus was supplied by POLYVAC, Vietnam.
2.2. Generation of Anti-rubella Polyclonal Antibody
Three specific pathogen-free rabbits (1.5–2.5 kg) were used to produce polyclonal antibodies against rubella virus. Rabbits were also checked for free with anti-rubella virus antibodies. Rabbits were immunized biweekly with the rubella virus for six injection doses. For the first immunization dose, complete Freund’s adjuvant (1.0 mL) was mixed with the rubella virus solution (1.0 mL of 7.0 lg PFU/0.5 mL) and injected intradermally. From the second injection, incomplete Freund’s adjuvant was mixed with the rubella virus solution (7.0 lg PFU/0.5 mL) in an equal volume ratio and injected into the thigh muscle. Two milliliters of the mixture were used for the second and third doses, while 4 mL were used for the subsequent doses. Each rabbit was completely bled 2 weeks after the final injection dose (the sixth dose). Serum was harvested and stored at −20°C.
2.3. Purification of Polyclonal Antibody
Purification was performed on an AKTA Avant 150 automated purification system (Cytiva, Sweden) using a Protein A Sepharose gel column. The column was equilibrated with 50 mM Tris-HCl buffer at pH 7.2. After equilibration, the serum containing anti-rubella virus antibodies was applied to the column. The column was then washed 5 times with 50 mM Tris-HCl buffer, pH 7.2, and then, the IgG proteins were eluted from the column with 0.1M glycine buffer at pH 2.7. The collected IgG solution was immediately neutralized with 1M Tris-HCl buffer at pH 9.0 and buffer was exchanged with 1X PBS buffer, pH 7.4. The purified IgG was checked by SDS-PAGE and stored at −20°C.
2.4. Enzyme-linked Immunosorbent Assay (ELISA)
The activity of purified IgG antibodies was determined by the ELISA method [13]. Briefly, 1 μg protein of rubella virus in 50 mM carbonate buffer pH 9.6 was coated on each well of the microtiter plate at 4°C overnight. After washing with PBS-T (1X PBS buffer + 0.05% Tween-20), the wells were blocked with 5% non-fat milk for 1 h at 37°C. After five washes, the corresponding wells were incubated with purified IgG solution or commercial anti-rubella virus antibody (200 ng/well) for 1 h at 37°C. The microtiter plate was then washed and incubated with the corresponding HRP-conjugated secondary antibodies. After washing, the signal was developed by adding the substrate containing 3,3′,5,5′-tetramethylbenzidine in 0.1 M citrate buffer, pH 5.0 and H2O2 and quenched by adding 1M H2SO4. Finally, the signal intensity was captured at a wavelength of 450 nm.
2.5. Synthesis of Star-shaped Gold Nanoparticles (SGN)
The synthesis of SGNs of 70 nm was carried out according to the procedure described by Zhu et al. [14]. The HAuCl4 solution was added at 5 mM final to 10 mM HEPES, pH 7.2. The reaction was carried out at room temperature for 20 min. The color of the reaction changed to a dark blue. The optical density of the solution was measured at wavelengths of 500–800 nm.
2.6. Conjugation of Polyclonal Antibody to SGN
The conjugation of antibodies to SGN was carried out in the following steps: (1) The SGN solution was adjusted to an optical density of 0.9 by adding an appropriate amount of H2O. Then, 0.1 mg of antibody was added to 100 mL of the prepared SGN solution and incubated at room temperature for 30 min. (2) The SGN was blocked by adding a 1% BSA solution and further incubation for 30 minutes. (3) The solution was centrifuged at 7000 rpm for 25–30 min to collect the pellet and followed by washing twice with sodium borate buffer containing 0.1% BSA. (4) The pellet was dissolved in 5 mL of sodium borate buffer containing BSA, sucrose to form an Ab-SGN conjugate solution.
2.7. Construction of the Lateral Flow Immunochromatographic Assay Test Strip
The lateral flow immunochromatographic test strip is constructed by assembling several sections of a nitrocellulose membrane (0.4 × 2.5 cm), a sample pad (0.4 × 1.3 cm), a conjugate pad (0.4 × 0.6 cm), and an absorbent pad (0.4 × 1.7 cm) [15]. The glass fiber pad (0.6 × 30 cm) was submerged in the prepared conjugate solution and then dried at 37°C for 60 min. The purified anti-rubella virus antibody was dispensed onto the nitrocellulose membrane at the test line (4.5 μg.cm-1), while Protein A was immobilized at the control-line position (1.2 μg.cm-1), using a Linomat V dispenser (Camag, Muttenz, Switzerland). The nitrocellulose membrane was incubated at 37°C for 1 h.
The sample pad and conjugate pad were adhered to the prepared nitrocellulose membrane at one end, while the absorbent pad was adhered to the opposite end [Figure 1]. The complete test strip was cut out to a width of 0.4 cm and placed in a plastic housing case. Finally, the test strip was packaged in a foil pouch along with a silica gel desiccant.
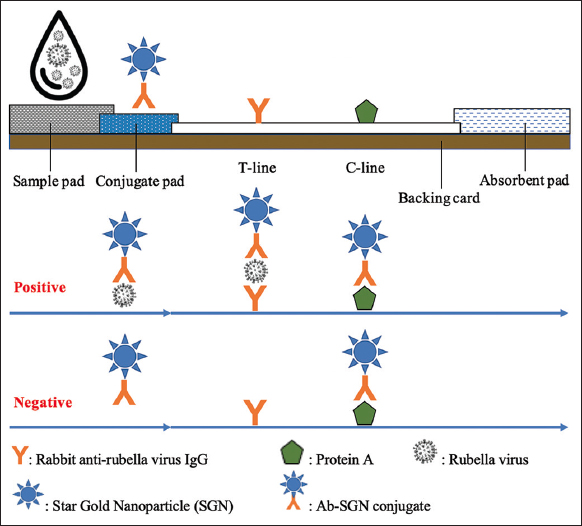 | Figure 1: The format of the lateral flow immunochromatographic assay test strip for detection of rubella virus antigen. [Click here to view] |
2.8. Sample Preparation
To evaluate the practicability of the assay in natural conditions, nasopharyngeal swabs were collected from asymptomatic healthy individuals and suspended in the assay running buffer to prepare mock clinical samples. Whole live-attenuated rubella viruses were spiked into the diluted normal nasopharyngeal specimens to mimic actual samples. Negative and positive samples were checked by RT-PCR for confirmation of the presence of viruses in the samples.
2.9. Test Procedure
Allow all components (test strip and buffer) to reach room temperature before testing. The test strip was removed from the foil pouch and placed on a flat, horizontal surface. Three drops (approximately 100 μL) of the prepared specimen were dispensed into the loading well on the strip. The signal was read by the naked eye within 20 min. If the signal appears in both test and control positions, it indicates that the specimen is positive for rubella virus. In case, the signal appears only in the control position, the sample is considered as negative. For statistical analysis of optimization experiments, the signal intensities of test line and control line were measured by a trip reader TSR-100 (Hangzhou Allsheng Instruments Co., Ltd, China).
2.10. Properties of the Generated Test Strip
Some properties of the generated test strip including repeatability, reproducibility, limit of detection (LOD), reading time, cross-reactivity, sensitivity, and specificity were evaluated. The repeatability of the assay was determined by testing each positive and negative sample with 10 test strips in one production batch while reproducibility was evaluated by testing positive sample with the test strips from five different batches. For LOD, the test strips were tested in serial dilutions of rubella virus samples in a range of 107–5.0 × 10⁴ virus particles.mL-1. The appropriate reading time for the test was determined by measuring the signal intensity of the T-line continuously over a period of 30 min. For cross-reactivity, the test strips were checked with spiked specimens of some different pathogens.
2.11. Clinical Evaluation
The generated test strips were clinically evaluated by testing with four hundred mock clinical specimens, including 200 positive samples and 200 negative samples.
2.12. Statistical Analysis
The sensitivity of the generated test strips was calculated by dividing the number of true positives by the sum of true positives and false negatives, while the specificity was calculated by dividing the number of true negatives by the sum of true negatives and false positives.
Data were statistically analyzed using a tool in https://www.socscistatistics.com [16]. The results were presented as mean ± standard deviation (SD). A P < 0.05 was considered statistically significant. The similarity between the generated test strip and real-time PCR was measured by the Kappa statistic.
3. RESULTS AND DISCUSSION
3.1. Production of Rabbit Polyclonal Antibody Against Rubella Virus
Previous studies showed that polyclonal antibodies were utilized to develop the lateral flow immunoassay [17,18]. Rabbit polyclonal antibodies were commonly used. In this study, rabbit polyclonal antibodies against rubella virus were also generated for application in the development of test strip.
The result of immunization showed that antibodies to rubella virus were present with a high titer in rabbit serum at day 70 post-injection (data not shown). However, serum is a rich-protein solution with a protein concentration of up to 80 mg/mL. The main protein components that are present in serum are albumins, accounting for about 60%, and IgMs, mainly IgG, accounting for approximately 20% [19]. Therefore, IgG antibodies were purified from rubella virus-immunized rabbit serum using Protein A gel affinity chromatography to provide the required antibodies for the generation of test strips. It has been shown that Protein A can bind specifically to the Fc region of IgG; therefore, it has been applied for the purification of IgG [20]. The result showed that there were two peaks in the chromatogram [Figure 2]. The first peak appeared immediately after sample loading was completed, indicating that this fraction contains non-binding proteins. After adding the eluent solution (0.1 M glycine, pH 2.7), a second peak appeared, indicating that this fraction contains protein A-specific binding proteins. As mentioned above, the IgG antibody was bound to protein A on the column and was separated out at this fraction. The presence of IgG molecules in the eluted fraction was checked by SDS-PAGE [Figure 2b]. The result showed the presence of two bands of approximately 25 kDa and 50 kDa on the SDS-PAGE pattern for the eluted fraction [Figure 2b, lane 3]. The sizes of these two bands correspond to the sizes of the light and heavy chains of the IgG, respectively. The purity of the rabbit anti-rubella virus IgG was 95% by SDS-PAGE determination. The obtained results indicated that IgG was successfully purified from the serum of rabbits immunized with rubella virus using Protein A affinity chromatography.
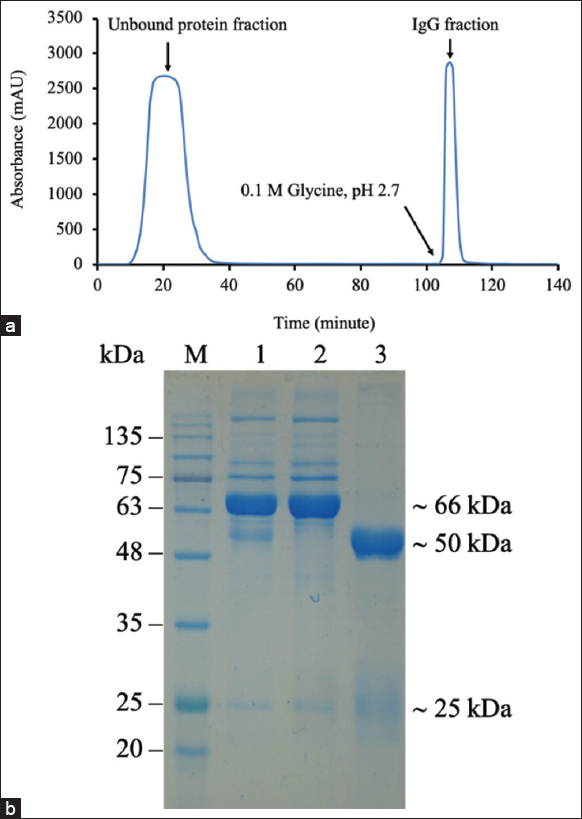 | Figure 2: Purification of rabbit polyclonal antibody against rubella virus. Chromatogram of IgG using Protein A Sepharose affinity column (a) SDS-PAGE of purified IgG fraction (b) Lane 1, whole serum; lane 2, flow-through; lane 3, eluted fraction. [Click here to view] |
The activity of purified antibodies was evaluated by the ELISA method. Rubella virus was coated on the bottom surface of a 96-well microtiter plate, acting as a capture agent. Purified IgG and a commercial anti-rubella virus antibody (Fitzgerald, USA) were used as the primary antibodies. The results showed that the purified IgG antibody strongly reacted with rubella virus and was comparable to a commercial anti-rubella virus antibody [Figure 3]. The obtained results indicated that the purified IgG antibody was suitable for the development of test kits.
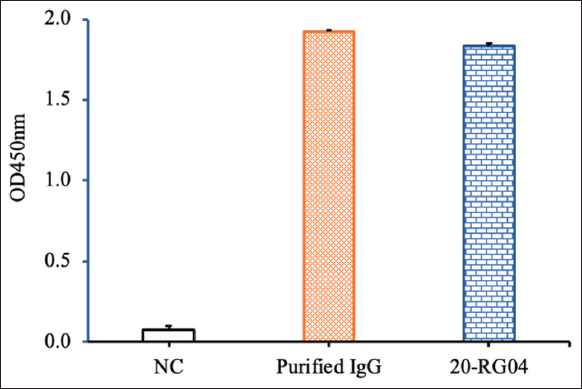 | Figure 3: The activity of purified immunoglobulin (Ig) G antibodies was checked by enzyme-linked immunosorbent assay. NC, negative control. Purified IgG antibodies were purified from the serum of rabbits immunized with rubella virus; 20-RG04, a commercial antibody against rubella virus from Fitzgerald, USA. [Click here to view] |
3.2. Generation of a Rapid Test Strip
3.2.1. Principle of a rapid test strip for detection of rubella
Laboratory diagnostics of rubella could be performed by virus detection or IgM/IgG detection. For virus detection, the RNA of rubella virus could be directly amplified from a clinical specimen (throat swab, oral fluid, or nasopharyngeal secretion) using molecular biological methods (RT-PCR, real-time RT-PCR, nested RT-PCR), and amplification of viral RNA is considered the most common diagnostic test [5]. Currently, no rapid test for rubella virus antigen has been developed. The development of a rapid test strip is based on the principle of the immunochromatographic method [21].
In the present study, a lateral flow immunochromatographic test strip was constructed to detect rubella virus antigen. Therefore, the format of the test strip includes the following components: A sample pad, a conjugate pad, a nitrocellulose membrane card, and an absorbent pad [Figure 1]. The capture antibody was immobilized at the test line (T-line), while the detection antibody was conjugated to SGN and placed on the conjugate pad. The assay was carried out by adding the prepared sample to the loading site of the test strip. During the movement under capillary force through the conjugate pad, rubella virus particles or free rubella antigens from the specimen react with the Ab-SGN conjugates to form a complex of antigen-Ab-SGN. The antigen-Ab-SGN complex further moved to the T-line and C-line regions of the test strip and resulted in the appearance of a blue signal in both the T-line and C-line positions.
Several factors can influence the preparation and performance of an LFA test strip. Of which, two critical components that significantly affect the quality of the test are the conjugate pad and the test line. Conditions for the generation of these components need to be optimized. For the conjugation of antibodies with SGN, concentration of antibody, reaction time, and reaction temperature were considered to be determined. The amount of detection and capture antibody on a conjugate pad and a test line, respectively, were also optimized.
3.2.2. Concentration of conjugation antibody and amount of antibody on a conjugate pad
Bioconjugation of proteins and gold nanoparticles can be carried out in two main ways: Physical adsorption and covalent binding. The physical adsorption of proteins onto the gold nanoparticles is based on two mechanisms: (1) Ionic interaction between the negatively charged surface of the gold nanoparticles and positively charged groups of proteins and (2) hydrophobic interaction between the hydrophobic part of the gold nanoparticles and the hydrophobic domains of the proteins. Covalent linkage between the proteins and the gold nanoparticles is formed in different manners: (1) Chemisorption through thiol derivatives; (2) linkers (EDC/NHS); (3) adapters (biotin/streptavidin); and (4) dative binding between the amino acid sulfur atoms of the antibody and the gold conducting electrons [22]. Previous studies demonstrated that the physical adsorption conjugation resulted in higher efficiency of antibody binding on the gold nanoparticles [23]. In this study, the immobilization of antibodies to the surface of gold nanoparticles was carried out by physical adsorption. In principle, a higher amount of antibody attaching to the surface of gold nanoparticles gives a greater number of antigen-recognizing sites per gold nanoparticle, resulting in a significant signal [24]. However, antibody crowding on the surface of gold nanoparticles may cause adverse problems such as competition for antigens, restriction of access to the antigens, and increased aggregation of gold nanoparticles [25]. Therefore, some key conditions for conjugation were considered to be optimized including the concentration of antibody in the conjugation reaction, reaction time, and reaction temperature.
Firstly, a range of antibody concentrations of 0.1, 0.25, 0.5, 0.75, and 1.0 μg/mL had been conjugated with SGNs. After conjugation, the antibody-SGN conjugate solution was applied onto the pad with the same amount of antibody (0.1 μg/pad) at each conjugation concentration [Figure 4a] to generate the conjugate pad. The result showed that the signal intensity of the test line increased when increasing the concentration of antibody and reached its highest at a concentration of 0.5 μg/mL. Increasing the amount of conjugated antibody on the conjugate pad resulted in increasing the signal intensity of the test line [Figure 4b]. With this approach, the increase in the amount of antibodies was due to the increase in the volume of the antibody-SGN conjugate solution. However, a false-positive signal appeared when the amount of conjugated antibody was higher than 0.15 μg/pad. Another strategy was applied to increase the amount of antibody on the conjugate pad by increasing the antibody concentration while keeping the same volume of the antibody-SGN conjugate solution. A significant signal of the test line was observed at the antibody concentration of 1.0 μg/ml in the conjugation reaction and 0.2 μg/pad without a false positive [Figure 4c]. The findings suggested that suitable concentration of antibodies for conjugation reaction and amount of antibodies for conjugate pad were 1.0 μg/mL and 0.2 μg/pad, respectively.
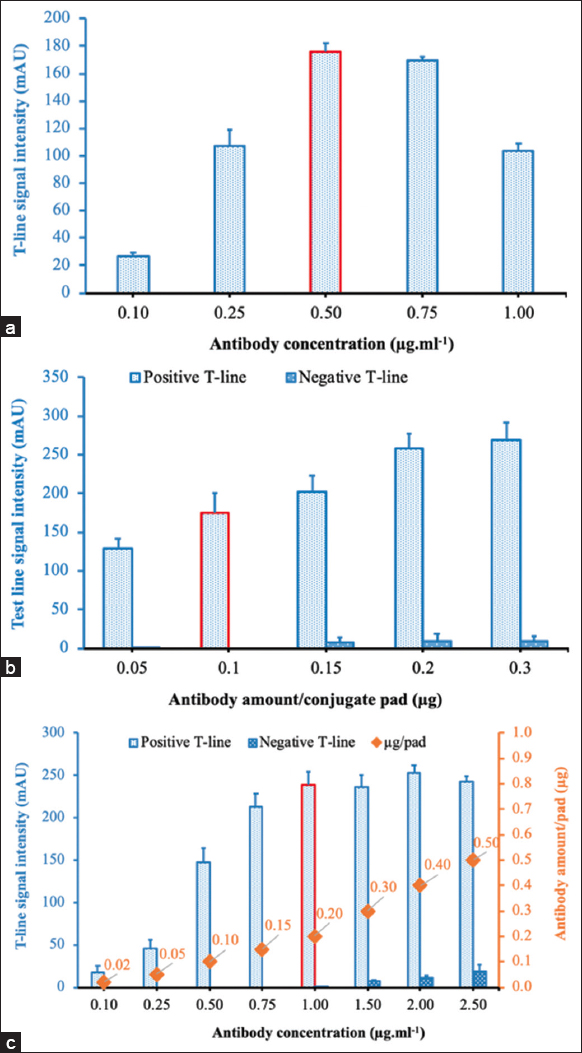 | Figure 4: (a-c) Optimization of the concentration of antibody in the conjugation reaction and the amount of detection antibody to be added to a conjugate pad. [Click here to view] |
3.2.3. The temperature for the conjugation
The mobility of the gold nanoparticles depends on the temperature of the solution. At elevated temperature, the gold nanoparticles are more mobile, and the bounds become less stable, which leads to a lower percentage of protein binding to the gold nanoparticles. For this condition, the conjugation reactions were carried out at three different temperatures (4°C, 25°C, and 37°C). The highest signal intensity was obtained when the conjugation reaction was carried out at 25°C [Figure 5]. This condition was used for the coupling reaction in the next experiments.
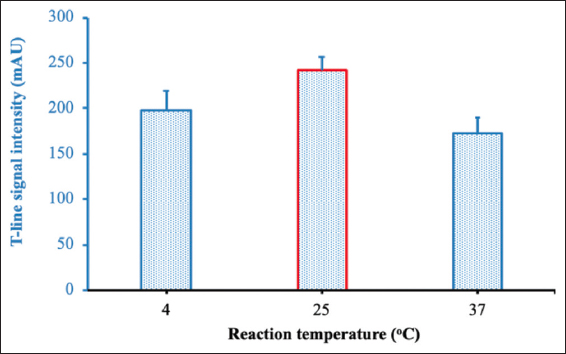 | Figure 5: Optimization of reaction temperature. [Click here to view] |
3.2.4. Reaction time
Reaction time is also an important factor affecting reaction efficiency. In the present study, the coupling reactions between antibodies and SGN were carried out with different reaction times of 10, 20, 30, 40, 50, and 60 min. The signal intensity of the test line increased when the reaction time was prolonged to 40 min and decreased when the reaction time exceeded 40 min [Figure 6].
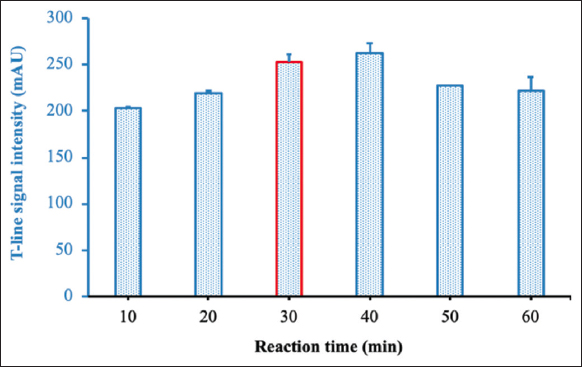 | Figure 6: Optimization of reaction time. [Click here to view] |
3.2.5. Amount of immobilized antibody
The signal intensity of a test line also depended on the amount of captured antibody. Therefore, the amount of captured antibody was optimized for immobilization at the test position. Results showed that the signal intensity of the test line increased with increasing amounts of immobilized antibody and reached the highest level at 4.5 μg/cm. However, the signal intensity was slightly decreased when higher amounts of immobilized antibody were used [Figure 7]. This decrease may be explained by the fact that too many proteins in a certain space cause steric hindrances to the interaction between immobilized antibodies and antigens.
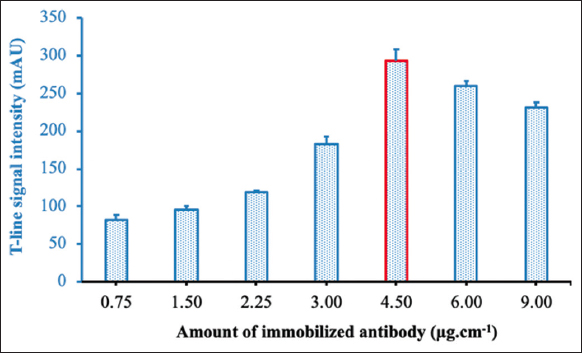 | Figure 7: Optimization of the amount of capture antibody at the test line. [Click here to view] |
3.3. Characterization of the Generated Test Strip for Detection of Rubella Virus
3.3.1. Repeatability and reproducibility of the generated test strip
Repeatability and reproducibility are parameters that represent the accuracy of an assay. Repeatability evaluates the variation in the results under the same condition, while reproducibility determines the variation between the production batches. For repeatability, ten generated test strips from the same lot were tested with one positive sample or one negative sample, respectively [Figure 8]. No false-positive result was observed for the negative sample. The coefficient of variation (CV) of signal intensities at the T-line for the positive sample was 7.1. This value was considered very good. The reproducibility of the generated test strips was carried out by checking five different production lots with the same sample; each lot was triplicated [Figure 9]. The CV of signal intensities at the T-line was also 7.1. The obtained results indicated that there was no significant difference between test strips or production batches. The findings concluded that the generated test strip has high accuracy.
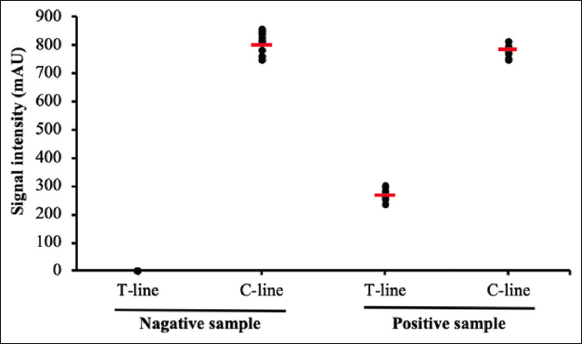 | Figure 8: Repeatability of the generated test strip with negative samples and positive samples. Each type of samples was tested consecutively ten times. [Click here to view] |
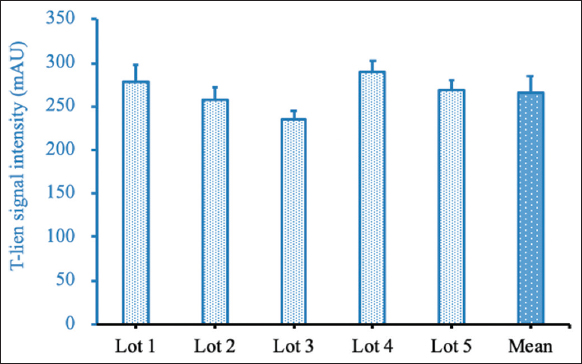 | Figure 9: Repeatability of the generated test strip. The sample was tested with five different lots. Each lot was replicated three times. [Click here to view] |
3.3.2. Reading time of the result
The reading time of the result will strongly affect the sensitivity and specificity of the lateral flow immunochromatographic assay. A high background will be observed at the early stage of testing, which may lead to a false negative for a weakly positive sample, whereas, if reading time is prolonged, it can give a false-positive result. Therefore, it is necessary to determine a suitable reading time for each assay. In this study, the signal intensity of the test line of the prepared test strip was measured continuously for 30 min with a 1-min interval using a strip reader. With a positive sample, the test line signal can be observed by visual inspection as early as 3 min. The signal intensity was significantly increased from 5 to 10 min. The signal continuously increased from 10 to 20 min, but at a slower rate. This signal very slowly increased after the 20-min mark [Figure 10a]. For a negative sample, there was no false-positive result after 30 min of testing. The most signal intensity with a clear background was observed after 15–20 min of testing [Figure 10b]. From the results, the suitable reading time of the result for the generated test strip should be 15–20 minutes after loading the sample.
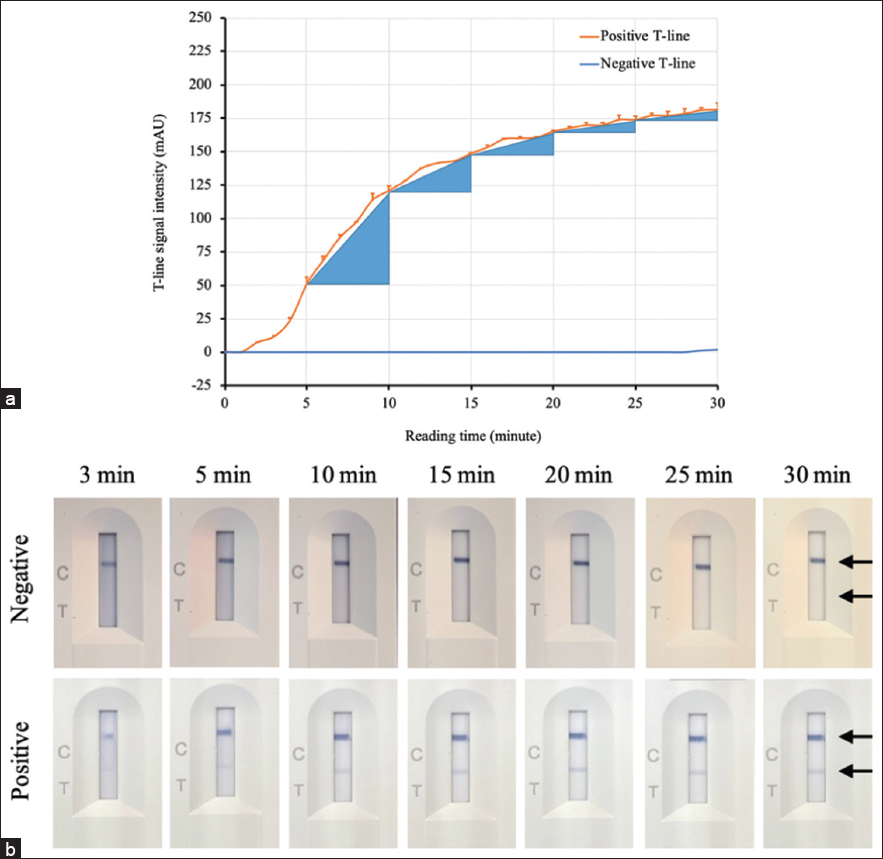 | Figure 10: Determination of the reading time of the result for the generated test strip. (a) The changes in the signal intensity of the test line with time were recorded by a strip reader. (b) Visual inspection of the test strip during testing. The height of the blue triangles indicates the level of change in the signal of the test line. [Click here to view] |
3.3.3. LOD for the Generated Test Strip
Detection limit refers to the lowest concentration of a substance (in this case, the rubella virus) that can be reliably detected by the test strip. In this study, nasopharyngeal samples from healthy individuals spiked with serious dilutions of rubella virus were applied to the test strip to determine the LOD. The results showed that the LOD observable by the naked eye was 5.0 × 10⁵ virus particles/mL of rubella virus [Figure 11a]. The LOD of the generated test strip was also determined by a strip reader TSR-100 (Hangzhou Allsheng Instruments Co., Ltd, China) and showed that a faint signal of the test line was still recorded at 5.0 × 10⁴–2.5 × 10⁵ virus particles/ml [Figure 11b]. Therefore, the LOD of the generated LFA test strip was defined as low as 5.0 × 10⁵ virus particles/mL when read by the naked eye. A previous report indicated that rubella virus load in throat swab of patients ranged from 5 × 10³ to 106 copies/ml at day 0–2 post-rash onset. The rubella virus was present in the patient’s throat until days 8–9 after symptom onset and persisted longer than in other sites such as serum/plasma, PBMCs, and urine [2]. Besides, rubella virus was found in the throat or nasopharynx a few days before the onset of the rash [3]. Therefore, these data supported that the prepared test strip could be employed for the detection of the rubella virus in the nasopharynx or throat of patients at an early stage of infection.
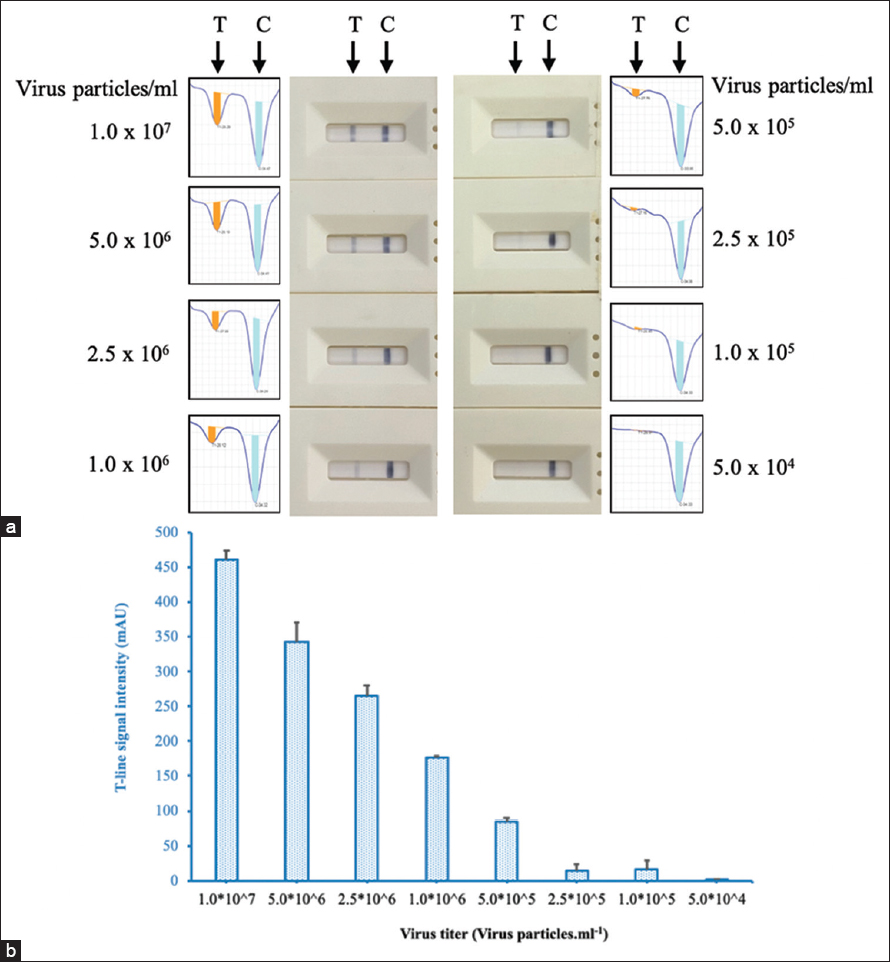 | Figure 11: Determination of the limit of detection of the generated LFA test strip by visual inspection (a) and strip reader (b). Nasopharyngeal samples from healthy individuals were spiked with serious dilutions of rubella virus. [Click here to view] |
3.3.4. Determination of the cross-reactivity of the test strip
In the present study, the test strip was prepared to test for rubella virus infection in the throat and nasopharynx. The testing sample could be contaminated by several microorganisms. Evaluation of the analytical specificity of the generated test strip was carried out with some interfering pathogens, including Staphylococcus aureus, Staphylococcus pyogenes, Candida albicans, Influenza, Adenovirus, and Measles virus. These pathogens were spiked into nasopharyngeal samples from healthy individuals at a concentration of 106 pfu/mL for virus or cfu/ml for bacteria. The results showed that no signal was observed when testing the test strip with the prepared contaminating microorganisms [Figure 12].
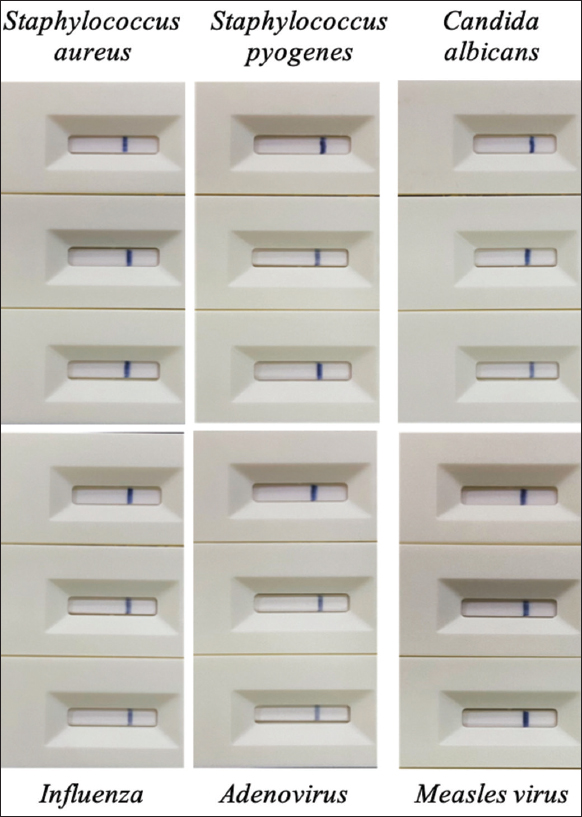 | Figure 12: Cross-reactivity of the test strip with potential interfering microorganisms: Staphylococcus aureus, Staphylococcus pyogenes, Candida albicans, Influenza, Adenovirus, and Measles virus. [Click here to view] |
3.4. Clinical evaluation of the generated test strip
In this study, mock clinical samples were utilized to determine the diagnostic specificity and diagnostic sensitivity. Rubella virus from cultivation was spiked into the nasopharyngeal samples of healthy volunteers at a titer of 106 virus particles/mL to generate the mock clinical samples. The generated test strips were examined with 200 negative samples and 200 positive samples that were confirmed by real-time PCR. The results showed that the diagnostic sensitivity of the prepared test strip reached 99.5% (95% CI: 97.22–99.91 %) and the specificity was 98.5% (95% CI: 95.68–99.49 %). Overall similarity of the generated test strip with the real-time PCR method was 99.00% (95% CI: 97.46–99.61) [Table 1]. The similarity between the generated test strip and real-time PCR was measured by the Kappa statistic. The result showed that the K value reached 0.98. This value implicated the very high similarity between two methods. These achieved parameters indicated that the generated test strip had good quality for application.
Table 1: Statistical analysis of the testing results of the generated test strip with Mock clinical samples.
| LFA test result | RT PCR test result | ||
|---|---|---|---|
| Positive | Negative | Total | |
| Positive | 199 | 3 | 202 |
| Negative | 1 | 197 | 198 |
| Total | 200 | 200 | 400 |
| Sensitivity | 99.5% (199/200) | ||
| 95% CI: 97.22–99.91 % | |||
| Specificity | 98.5% (197/200) | ||
| 95% CI: 95.68–99.49 % | |||
| Overall percent agreement | 99.00 (396/400) | ||
| 95% CI: 97.46–99.61 | |||
4. CONCLUSIONS
A rapid test strip based on the immunochromatographic assay for the detection of rubella virus antigen was successfully developed using SGN and rubella virus-specific polyclonal antibodies. The optimal conditions for generation of the test strip were determined: The conjugation reaction was carried out at 25°C for 30 min; the amounts of detection antibody and capture antibody were 0.2 μg/pad and 4.5 μg/cm, respectively. The test strip has high sensitivity and specificity, along with some advantages such as cost-effectiveness, rapidity, and ease of use. The sensitivity and specificity of the test strip reached 99.5% and 98.5%, respectively. The test strip could detect the virus at a level of 5 × 10⁵ virus particles/ml and did not cross-react with some potential interfering pathogens. This is the first report on the generation of a rapid test strip for the recognition of rubella virus antigen. The test strip could be used for point-of-care early diagnosis of Rubella patients.
5. ACKNOWLEDGMENT
We would like to thank the volunteers for providing their nasopharyngeal samples.
6. AUTHOR CONTRIBUTIONS
All authors have made substantial contributions to the conception or design of the work, collection of the study samples, performing all the analysis and laboratory tests, interpretation of data for the work, preparation of the draft, revision of the article, and final approval of the version to be published.
7. FUNDING
This study was supported by the Ministry of Health, Vietnam, under the project of “the production of anti-rubella sera for application in vaccine testing and the development of diagnostic products”.
8. CONFLICTS OF INTEREST
The authors declare that they have no conflicts of interest in relation to this article.
9. ETHICAL APPROVALS
All mock clinical samples used in this study were received from healthy volunteers. The study was carried out according to the research protocol approved by the Scientific Council of the Ministry of Health certificate no. IRB-VN01057/IORG00008555/ No. NIHE IRB-14/2023.
10. DATA AVAILABILITY
All data generated and analyzed are included within this research article.
11. PUBLISHER’S NOTE
This journal remains neutral with regard to jurisdictional claims in published institutional affiliation.
REFERENCES
1. Mankertz A, Chen MH, Goldberg TL, Hübschen JM, Pfaff F, Ulrich RG, et al. ICTV virus taxonomy profile:Matonaviridae 2022. J Gen Virol 2022;103:001817.
2. Kanbayashi D, Kurata T, Kaida A, Kubo H, Yamamoto SP, Egawa K, et al. Shedding of rubella virus in postsymptomatic individuals;viral RNA load is a potential indicator to estimate candidate patients excreting infectious rubella virus. J Clin Virol 2023;160:105377. [CrossRef]
3. Zhu Z, Xu W, Abernathy ES, Chen MH, Zheng Q, Wang T, et al. Comparison of four methods using throat swabs to confirm rubella virus infection. J Clin Microbiol 2007;45:2847-52. [CrossRef]
4. Remington JS, Klein JO, Wilson CB, Nizet V, Maldonado YA. Infectious Diseases of the Fetus and Newborn:Expert Consult - Online and Print. Philadelphia, PA:Saunders;2010. 1-1260.
5. Lambert N, Strebel P, Orenstein W, Icenogle J, Poland GA. Rubella. Lancet 2015;385:2297-307. [CrossRef]
6. Uchino K, Miyoshi T, Mori Y, Komase K, Okayama F, Shibata Y, et al. Comparison of virological and serological methods for laboratory confirmation of rubella. J Clin Virol 2020;123:104257. [CrossRef]
7. Abernathy E, Cabezas C, Sun H, Zheng Q, Chen MH, Castillo-Solorzano C, et al. Confirmation of rubella within 4 days of rash onset:Comparison of rubella virus RNA detection in oral fluid with immunoglobulin M detection in serum or oral fluid. J Clin Microbiol 2009;47:182-8. [CrossRef]
8. Bosma TJ, Corbett KM, O'Shea S, Banatvala JE, Best JM. PCR for detection of rubella virus RNA in clinical samples. J Clin Microbiol 1995;33:1075-9. [CrossRef]
9. Okamoto K, Fujii K, Komase K. Development of a novel TaqMan real-time PCR assay for detecting rubella virus RNA. J Virol Methods 2010;168:267-71. [CrossRef]
10. Claus C, Bergs S, Emmrich NC, Hübschen JM, Mankertz A, Liebert UG. A sensitive one-step TaqMan amplification approach for detection of rubella virus clade I and II genotypes in clinical samples. Arch Virol 2017;162:477-86. [CrossRef]
11. Schulz H, Neale M, Zubach V, Severini A, Hiebert J. Development of a rapid, internally controlled, two target, real-time RT-PCR for detection of rubella virus. J Virol Methods 2022;303:114500. [CrossRef]
12. da Silva JO, Dos Santos M, Silva AA, Ferreira AV, Nogueira LM, Gandra IB, et al. Abiotechnological review on patents applied to rubella diagnosis. Recent Pat Biotechnol 2023;17:332-45. [CrossRef]
13. Ngo HT, Tran SV, Nguyen HD, Truong PQ. Humoral immune response in COVID-19 patients and novel design of lateral flow assay strip for simultaneous rapid detection of IgA/IgM/IgG antibodies against the SARS-CoV-2 virus. J Appl Biol Biotechnol 2023;11:102-13. [CrossRef]
14. Zhu M, Zhang J, Cao J, Ma J, Li X, Shi F. Ultrasensitive dual-color rapid lateral flow immunoassay via gold nanoparticles with two different morphologies for the serodiagnosis of human brucellosis. Anal Bioanal Chem 2019;411:8033-42. [CrossRef]
15. Zhang G, Guo J, Wang X. Immunochromatographic lateral flow strip tests. Methods Mol Biol 2009;504:169-83. [CrossRef]
16. Social Science Statistics. Available from:https://www.socscistatistics.com [Last accessed on 2023 Aug 02].
17. Wu S, Jiang J. Development of a Polyclonal Antibody Based Strip Assay for Detection of Cadmium Residue. In:Proceedings of 2011 International Conference on Computer Science and Network Technology. Vol. 2. ICCSNT;2011. 1037-40.
18. Ariffin N, Yusof NA, Abdullah J, Abd R, Rahman SF, Raston NH, et al. Lateral flow immunoassay for naked eye detection of Mycobacterium tuberculosis. J Sensors 2020;2020:1365983. [CrossRef]
19. Leeman M, Choi J, Hansson S, Storm MU, Nilsson L. Proteins and antibodies in serum, plasma, and whole blood-size characterization using asymmetrical flow field-flow fractionation (AF4). Anal Bioanal Chem 2018;410:4867-73. [CrossRef]
20. Fishman JB, Berg EA. Protein A and Protein G purification of antibodies. Cold Spring Harb Protoc 2019;2019:82-4. [CrossRef]
21. Mirica AC, Stan D, Chelcea IC, Mihailescu CM, Ofiteru A, Bocancia-Mateescu LA. Latest trends in lateral flow immunoassay (LFIA) detection labels and conjugation process. Front Bioeng Biotechnol 2022;10:922772. [CrossRef]
22. Jazayeri MH, Amani H, Pourfatollah AA, Pazoki-Toroudi H, Sedighimoghaddam B. Various methods of gold nanoparticles (GNPs) conjugation to antibodies. Sens Bio Sens Res 2016;9:17-22. [CrossRef]
23. Oliveira JP, Prado AR, Keijok WJ, Antunes PW, Yapuchura ER, Guimarães MC. Impact of conjugation strategies for targeting of antibodies in gold nanoparticles for ultrasensitive detection of 17β-estradiol. Sci Rep 2019;9:13859. [CrossRef]
24. Kozlowski R, Ragupathi A, Dyer RB. Characterizing the surface coverage of protein-gold nanoparticle bioconjugates. Bioconjug Chem 2018;29:2691-700. [CrossRef]
25. Mateos H, Mallardi A, Serrano-Pertierra E, Blanco-López MC, Izzi M, Cioffi N, et al. Unusual gold nanoparticle-antibody interactions. JCIS Open 2023;11:100089. [CrossRef]