
1. INTRODUCTION
The field that looks for the plant’s ornamental values by sequencing and resequencing the genome of ornamental plants is known as ornamental plant genomics [1]. The continuous emergence of sequencing and bioinformatics technologies evolved the field of ornamental plant genomics [2-4]. Zhang et al. [4], in 2012, pioneered genome sequencing of the “ornamental plant, Prunus mume.” In the past 10 years, the “whole genome sequences” of nearly 65 “ornamental plants” representing the families Asteraceae, Orchidaceae, and Rosaceae were sequenced [1]. The whole-genome analysis of these plants’ species established ornamental traits such as abiotic stress resistance, disease resistance, dormancy, flower color formation, floral development, floral scent, plant architecture, and self-incompatibility [1].
Phoenix roebelenii (pygmy date palm) is a popular “ornamental plant” and is associated with the family “Arecaceae” [5]. “Pygmy date palm” is a miniature palm tree having slim trunks and a beautiful crown of feathery leaves, small yellow flowers, and small edible black fruits [5]. “Pygmy date palm” is a variety of date palms indigenous to southwestern China and northern Vietnam and is grown well in warm, tropical, and subtropical gardens [5]. The British royal horticultural society marked P. roebelenii with the Award of Garden Merit for its performance under UK growing conditions [6,7]. Pygmy date palm is resistant to pests, tolerant to soil variation, and moderately tolerant to drought. The NASA Clean Air Study established that this plant effectively removed regular domestic air pollutants benzene and formaldehyde [8]. Therefore, this study aims to report the draft nuclear and complete organelle genome sequences of P. roebelenii along with important ornamental traits.
2. MATERIALS AND METHODS
The raw genome sequence data (reads) of P. roebelenii was downloaded from NCBI (BioProject ID: PRJNA629103), evaluated, and checked. AdapterRemoval version 2.3.2 was employed to remove contaminated adapter sequences and bases of low-quality (with Q20) from reads to provide high-quality clean data [9]. The de novo assembly for nuclear genome is generated based on high-quality clean data. KmerGenie version 1.7051 [10] is employed to estimate the genome size, and MaSurCa version 3.3.2 [11] generated de novo assembly. BUSCO version 4.1.2 [12] is used to check the de novo assembly and was considered for downstream analysis to check the completeness and quality of the genome assembly. The plant dataset embryophyta_odb10 is provided as a model. RepeatModeler version 2.0.1 [13] and RepeatMasker version 4.0.9 [14] are employed to identify repeats and mask the genome, respectively. AUGUSTUS version 3.3.2 [15] is employed to predict genes with Arabidopsis as the model. tRNAscan-SE version 2.0.6 [16] is utilized to identify tRNAs. UniProt protein database [17] is employed to process functional annotation of the predicted genes based on homology. The topHits in the homology search are used to assign a function to the genes in the functional annotation. Transcription factor analysis was performed using Plant TFDB version 4.0 [18]. The orthologous analysis was performed for predicted protein sequences of P. roebelenii by considering protein sequences of six model species, that is, Arabidopsis thaliana, Oryza sativa, Phoenix dactylifera, Sorghum bicolor, Triticum aestivum, and Zea mays. OrthoFinder version 2.2.7 [19] is employed for orthologous analysis. The simple sequence repeats markers were identified using MISA version 2.1 [20], and primers were designed using primer 3 version 2.5.0 [21]. The mitochondria and chloroplast assembly were generated using GetOrganelle version 1.6.4 [22], and the annotation of chloroplast was made using CPGAVAS2 version 1 [23]. The mitochondrial genome annotation was performed using AGORA version 1 [24], considering Y08501.2 as a model.
3. RESULTS AND DISCUSSION
3.1. Genome Assembly (Nuclear and Organelle) of Pygmy Date Palm
The whole-genome sequence data of 32.2 GBs from NCBI Bio project PRJNA629103 is retrieved. There were 214,907,072 reads with GC content of 42.43% and 93.885% data ≥Q30 with read length of 2 × 150 bp. The adapter removal and quality trimming resulted in 214, 767, 420 reads with a GC content of 41.88%. The quality of the bases with ≥Q30 is 94.265%, and the genome size was 584,473,888 bps [Figure 1]. The de novo assembly generated 7019 scaffolds with an assembly size of 462,152,837 bps. The longest scaffold is 6,464,272 bps, and the shortest scaffold is 411 bps [Table 1]. The assembled genome’s GC content and scaffold length distribution were calculated and are shown in Figure 2 and 3, respectively. The GC content of the assembled genome is ~41.88%. BUSCO version 4.1.2 evaluated the assembled genome, and the assembly was 84.2% complete [Table 2].
 | Figure 1: The K-mer histogram for estimation of genome size in pygmy date palm. The figure shows K-mers size in the genome of pygmy date palm, that are predicted using KmerGenie version 1.7051. A graph was plotted with K-mer size on the X-axis and the number of genomic K-mers on the Y-axis and from the graph the K-mer size of 84 is selected for the genome assembly. The predicted genome assembly size of pygmy date palm is 584,473,888 bp. [Click here to view] |
Table 1: The summary of genome assembly on pygmy date palm.
| S. No. | Assembly Statistics | Count |
|---|---|---|
| 1. | Number of scaffolds | 7019 |
| 2. | Total size of scaffolds | 462152837 |
| 3. | Longest scaffold | 6464272 |
| 4. | Shortest scaffold | 411 |
| 5. | Number of scaffolds>1K nt | 7015 |
| 6. | Percentage of scaffolds>1K nt | 99.9 |
| 7. | Number of scaffolds>10K nt | 2706 |
| 8. | Percentage of scaffolds>10K nt | 38.6 |
| 9. | Number of scaffolds>100K nt | 803 |
| 10. | Percentage of scaffolds>100K nt | 11.4 |
| 11. | Number of scaffolds>1M nt | 83 |
| 12. | Percentage of scaffolds>1M nt | 1.2 |
| 13. | Mean scaffold size | 65843 |
| 14. | Median scaffold size | 5546 |
| 15. | N50 scaffold length | 569782 |
| 16. | L50 scaffold count | 181 |
| 17. | Scaffold %A | 27.87 |
| 18. | Scaffold %C | 18.09 |
| 19. | Scaffold %G | 18.07 |
| 20. | Scaffold %T | 27.83 |
| 21. | Scaffold %N | 8.14 |
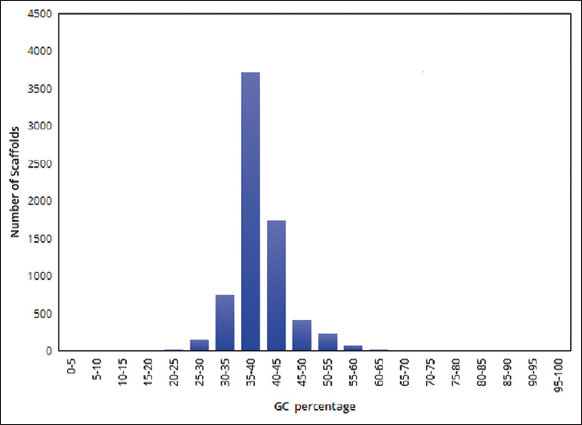 | Figure 2: The distribution of GC percentage in the assembled genome of pygmy date palm. The figure shows the distribution of GC percentage in the assembled genome of pygmy date palm. A graph was plotted with GC percentage range (GC%) on the X-axis and the number of scaffolds on the Y-axis. The GC percentage in the assembled genome of pygmy date palm is ~ 41.88%. [Click here to view] |
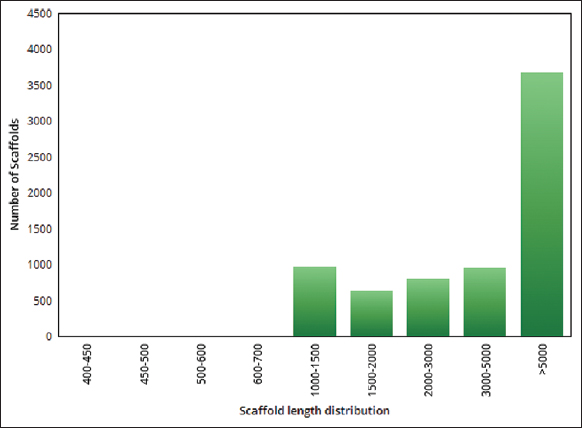 | Figure 3: The scaffold length distribution of the assembled genome in pygmy date palm. The figure shows distribution of scaffold length distribution in the assembled genome of pygmy date palm. A graph was plotted with scaffold length range on the X-axis and the number of scaffolds on the Y-axis. [Click here to view] |
Table 2: The summary of BUSCO score parameters to evaluate the completeness of pygmy date palm
| S. No. | BUSCO Statistics | Count | Percentage |
|---|---|---|---|
| 1. | Complete BUSCOs (C) | 1360 | 84.20% |
| 2. | Complete and single-copy BUSCOs (S) | 1290 | 79.90% |
| 3. | Complete and duplicated BUSCOs (D) | 70 | 4.30% |
| 4. | Fragmented BUSCOs (F) | 91 | 5.60% |
| 5. | Missing BUSCOs (M) | 163 | 10.20% |
| 6. | Total BUSCO groups searched | 1614 | 100.00% |
The repeat analysis masked 162,247,645 bps, nearly 35.11 %. The repeat classification revealed 2.44% of LINEs, 10.19% of LTR elements, 1.66% of DNA elements, and unclassified repeats of 19.70%. The analysis revealed 89860, 32272, 11399, 2545, 458, 193, and 18504 mononucleotide repeats, dinucleotide repeats, trinucleotide repeats, tetranucleotide repeats, pentanucleotide repeats, hexanucleotide repeats, and complex type repeats, respectively [Table 3]. Out of the simple repeats predicted, the primers were designed successfully for 27,364 mononucleotides, 9901 dinucleotides, 3599 trinucleotides, 801 tetranucleotides, 146 pentanucleotides, 58 hexanucleotides, and 5742 complex type repeats [Table 4]. There were 480 tRNAs identified in the assembly of pygmy date palm.
Table 3: The summary of repeats predicted in the genome of pygmy date palm
| S. No. | Repeats | Subtypes of repeats | Number of elements | Length occupied | Percentage of sequence |
|---|---|---|---|---|---|
| 1. | LINEs | 28905 | 11272985 bp | 2.44% | |
| LINE1 | 24362 | 9932191 bp | 2.15% | ||
| 2. | LTR elements | 98074 | 47094466 bp | 10.19% | |
| 3. | ERV_classII | 2016 | 592501 bp | 0.13% | |
| 4. | DNA elements | 30020 | 7649566 bp | 1.66% | |
| 5. | Unclassified | 402134 | 91031581 p | 19.70% | |
| 6. | Total interspersed repeats | 157048598 bp | 33.98% | ||
| 7. | Small RNA | 738 | 103556 bp | 0.02% | |
| 8. | Satellites | 7455 | 978757 bp | 0.21% | |
| 9. | Simple repeats | 97657 | 3707134 bp | 0.80% | |
| 10. | Low complexity | 18778 | 960747 bp | 0.21% |
Table 4: The summary of primers designed successfully for SSRs repeats in pygmy date palm.
| S. No. | Type of simple repeats | Count of simple repeat | Count of primers designed |
|---|---|---|---|
| 1. | p1 | 89860 | 21405 |
| 2. | p2 | 32272 | 6895 |
| 3. | p3 | 11399 | 3029 |
| 4. | p4 | 2545 | 605 |
| 5. | p5 | 458 | 107 |
| 6. | p6 | 193 | 45 |
| 7. | c | 17613 | 4151 |
| 8. | c* | 891 | 202 |
The gene prediction revealed 42,388 genes; out of them, 30,140 genes were annotated based on the best hit with the UniProt protein database, and 24,629 genes were annotated explicitly with P. dactylifera genes available at NCBI [Table 5]. InterproScan was used to annotate genes, resulting in the annotation of 33,645 genes. Transcription factors are identified for 1850 genes in the study, out of which transcription factors of 150 genes (highest) belong to bHLH transcription factors. In contrast, the transcription factor of one gene (lowest) belongs to HRT-like transcription factors. PMN analysis identified 8357 genes associated with metabolic pathways. KEGG analysis also identified the genes taking part in different pathways. The GO categorization identified 1397 genes related to biological processes [Figure 4], 393 genes associated with cellular components [Figure 5], and 1268 genes linked to molecular function [Figure 6]. The Mapman analysis identified 46.33% of genes having a significant role in metabolic pathways [Figure 7]. The orthologous study considered 485,739 genes; out of them 364,435 (75%) genes were present in the orthogroups. The orthogroups in the model plants were compared to identify the common orthogroups between the model species and P. roebelenii, as shown in Figure 8. The linear dendrogram was generated using the maximum likelihood method [19,25] and viewed in Figtree [26] to understand the phylogenetic relationship between the models and P. roebelenii, as shown in Figure 9. The number of orthogroups identified in this study is 22,689 [Table 6].
Table 5: The summary of gene prediction and annotation on pygmy date palm
| S. No | Annotations | Count |
|---|---|---|
| 1 | Number of CDS predicted | 42388 |
| 2 | Number of CDS got annotated with UniProt protein db | 30140 |
| 3 | Number of CDS got annotated with Phoenix dactylifera genes | 24629 |
| 4 | Number of CDS got annotation with INTERPRO | 33645 |
| 5 | Number of CDS got annotation with plant metabolic network | 8358 |
| 6 | Number of CDS got annotation with transcription factor | 1849 |
 | Figure 4: The gene ontologies related to biological process observed in pygmy date palm. The figure shows gene ontologies related to biological process observed in pygmy date palm. A graph is plotted with gene ontologies of biological process on X-axis and number of genes on Y axis. [Click here to view] |
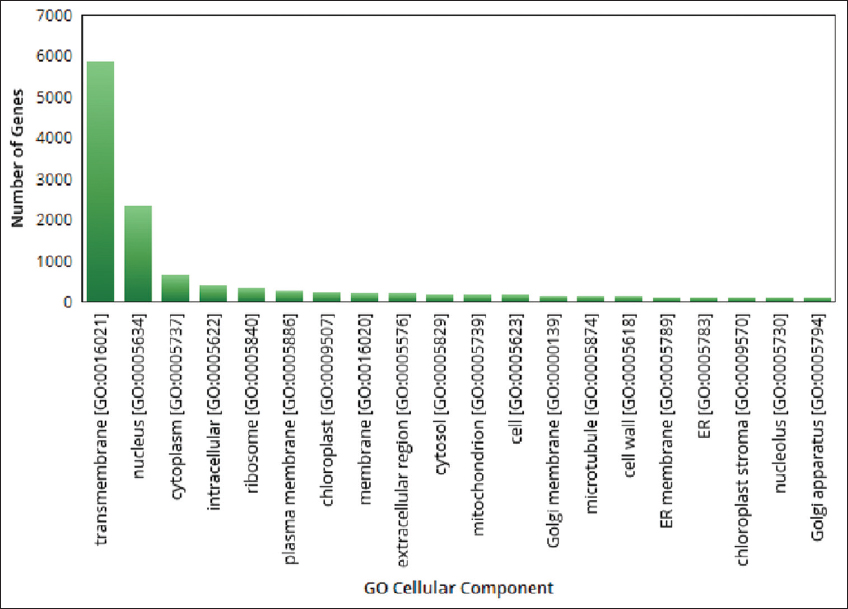 | Figure 5: The gene ontologies related to cellular component observed in pygmy date palm. The figure shows gene ontologies related to cellular components observed in pygmy date palm. A graph is plotted with gene ontologies of cellular components on X-axis and number of genes on Y axis. [Click here to view] |
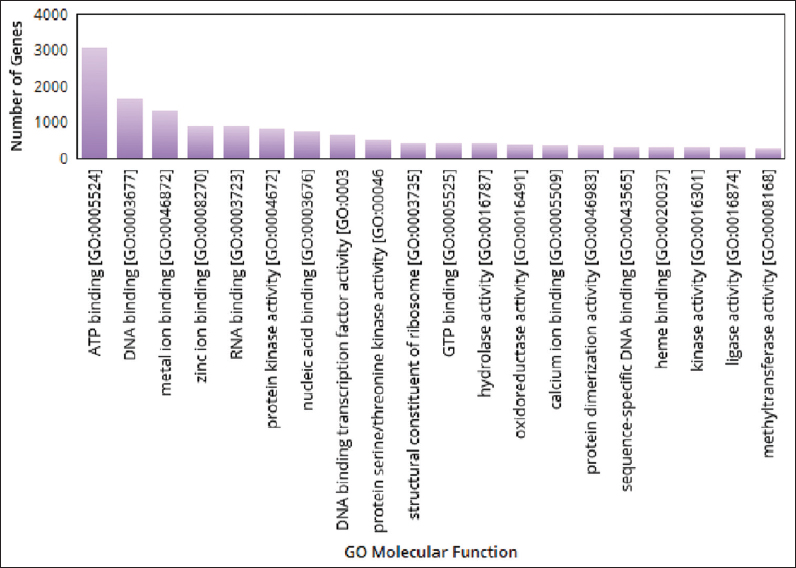 | Figure 6: The gene ontologies related to molecular function observed in pygmy date palm. The figure shows gene ontologies related to molecular functions observed in pygmy date palm. A graph is plotted with gene ontologies of molecular functions on X-axis and number of genes on Y axis. [Click here to view] |
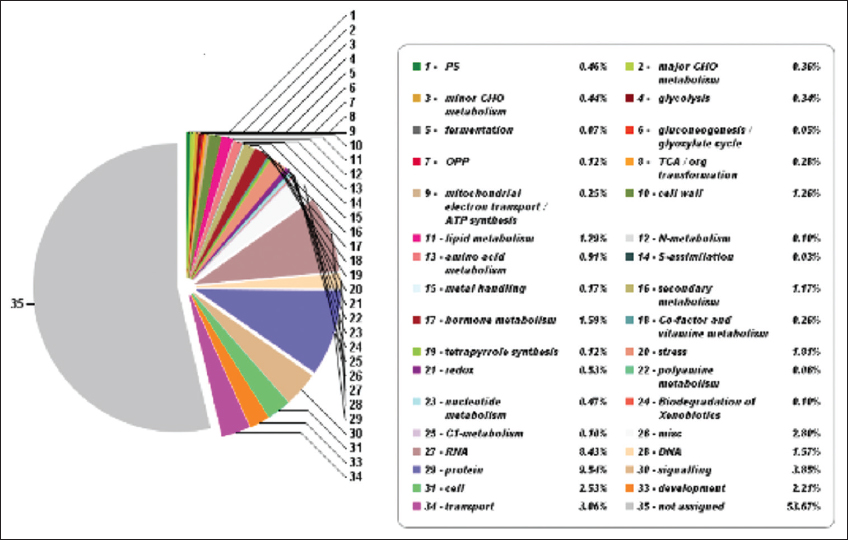 | Figure 7: The pathway summary predicted with Mapman. This figure shows thirty-four metabolic categories along with the participating percentage of genes having a significant role in metabolic pathways of pygmy date palm. Mapman analysis identified 46.33% genes having a significant role in metabolic pathways. [Click here to view] |
 | Figure 8: The summary of genes in orthogroups between model plants Phoenix dactylifera and Phoenix roebelenii. This figure shows summary of genes in orthogroups as revealed by orthologous analysis between Arabidopsis thaliana, Oryza sativa, Phoenix dactylifera, Sorghum bicolor, Triticum aestivum, Zea mays and Phoenix roebelenii. [Click here to view] |
 | Figure 9: The linear tree generated between model plants Phoenix dactylifera and Phoenix roebelenii. This [Click here to view] |
Table 6: The summary of orthogroups and genes in pygmy date palm as revealed by the orthologous analysis
| S. No. | Summary of orthogroups and genes | Counts |
|---|---|---|
| 1. | Number of genes | 485739 |
| 2. | Number of genes in orthogroups | 364435 |
| 3. | Number of unassigned genes | 121304 |
| 4. | Percentage of genes in orthogroups | 75 |
| 5. | Percentage of unassigned genes | 25 |
| 6. | Number of orthogroups | 22689 |
| 7. | Number of species-specific orthogroups | 749 |
| 8. | Number of genes in species-specific orthogroups | 4630 |
| 9. | Percentage of genes in species-specific orthogroups | 1 |
| 10. | Mean orthogroup size | 16.1 |
| 11. | Median orthogroup size | 12 |
| 12. | G50 (assigned genes) | 25 |
| 13. | G50 (all genes) | 18 |
| 14. | O50 (assigned genes) | 4284 |
| 15. | O50 (all genes) | 7169 |
| 16. | Number of orthogroups with all species present | 9446 |
| 17. | Number of single-copy orthogroups | 8 |
A complete circular chloroplast genome of 125,222 bps was generated and annotated without any gap [Figure 10]. The repeat analysis revealed 91 tandem repeats and 45 simple repeats. Out of 45 simple repeats, 36 were mononucleotide simples, three were dinucleotide repeats, and six were complex-type repeats. A total of 108 genes with 79 coding sequences, 26 tRNA genes, and four unique rRNA sequences were detected in the chloroplast genome of pygmy date palm.
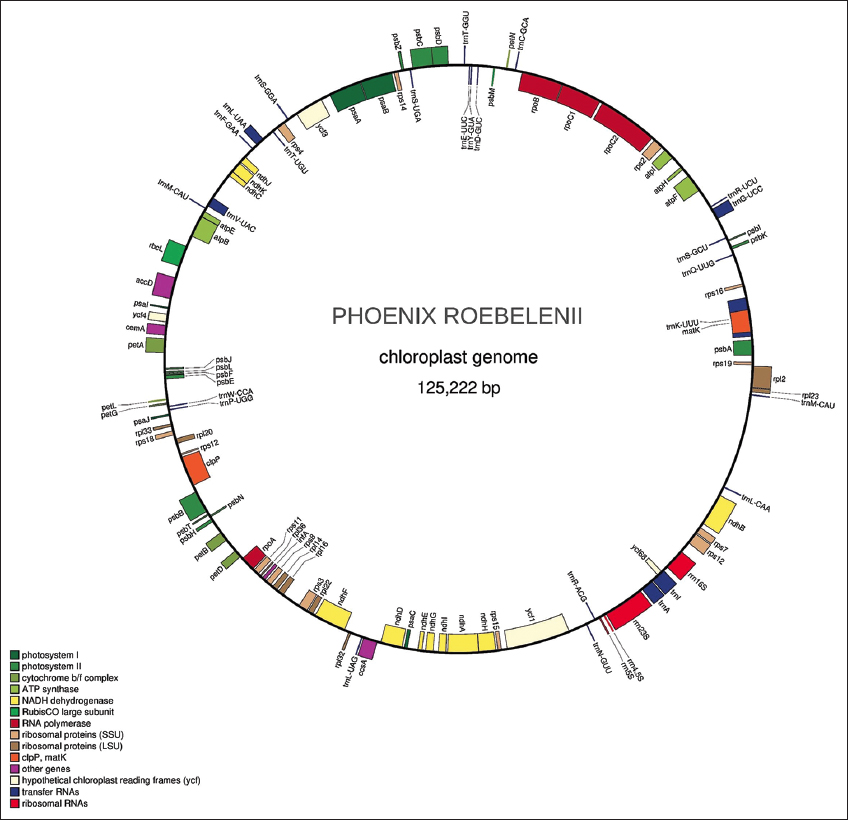 | Figure 10: The Chloroplast genome and annotation of pygmy date palm. This figure shows a circular chloroplast genome of 125,222 bps generated without any gap using GetOrganelle version 1.6.4. This figure also shows chloroplast genome annotation predicted using CPGAVAS2 version 1. [Click here to view] |
A complete circular mitochondrial genome of 482,735 bps was generated and annotated without any gap [Figure 11]. A. thaliana ecotype Col-0 mitochondrion, complete genome (NC_037304.1), is a reference for genome annotation in the mitochondria. The repeat analysis revealed 29 tandem repeats and 61 simple repeats. Out of 61 simple repeats, 44 were mononucleotide simples, eight were dinucleotide repeats, seven were trinucleotide repeats, and two were complex-type repeats. A total of 65 genes, six tRNA genes, and six unique rRNA sequences were recognized in the mitochondrial genome of pygmy date palm.
 | Figure 11: The mitochondrial genome and annotation of pygmy date palm. This figure shows a circular mitochondrial genome of 482,735 bps generated without any gap using GetOrganelle version 1.6.4. This figure also shows mitochondrial genome annotation predicted using AGORA version 1. [Click here to view] |
3.2. The Genes Associated with Important Ornamental Traits in Pygmy Date Palm
The genes associated with the important ornamental traits such as “fruit development and ripening,” “floral development,” “anthocyanin synthesis,” “floral scent biosynthesis,” “plant architecture,” “dormancy release,” “self-incompatibility,” “disease resistance,” and “drought” were discovered. The “carbohydrate metabolism” is the extreme pathway in fruit development and ripening of fruit. “Energy metabolism” is the next metabolic pathway which is expressed highly followed by “metabolism of other amino acids.” The number of genes identified in sugar, energy, and pyruvate metabolisms is 322, 9, and 11, respectively. The number of genes identified in association with controlling “floral development,” “anthocyanin synthesis,” “floral scent biosynthesis,” “plant architecture,” “dormancy release,” “self-compatibility,” “disease resistance,” and “drought” are 2101, 9, 6, 58, 207, 49, 1948, and 1425, respectively. The criteria used to identify the genes related to ornamental traits are homology identity cutoff of 80% and query coverage cutoff of 80%. The summary of gene count and genes associated with ornamental traits is presented in Table 7 and Supplementary Tables 1-11, respectively.
Table 7: The summary of gene count associated with ornamental traits in pygmy date palm
| S. No. | Traits | Gene count |
|---|---|---|
| 1. | Sugar metabolism | 322 |
| 2. | Energy metabolism | 9 |
| 3. | Pyruvate metabolism | 11 |
| 4. | Floral development | 2101 |
| 5. | Anthocyanin synthesis | 9 |
| 6. | Floral scent biosynthesis | 6 |
| 7. | Plant architecture | 58 |
| 8. | Dormancy release | 207 |
| 9. | Self-incompatibility | 49 |
| 10. | Disease resistance | 1948 |
| 11. | Drought | 1425 |
4. CONCLUSION
This study presents the first draft genome assembly of P. roebelenii. The de novo assembly was constructed using the sequenced data available. Therefore, a scaffold-level assembly was generated with gaps. Still, we are forwarding this draft assembly and the annotation as a valuable resource for the scientific community to get access to their future research.
5. ACKNOWLEDGMENTS
NC and NNNR are grateful to the management of GITAM (Deemed to be University) for providing the necessary facilities to carry out the research work and extending constant support. The authors are grateful to Dr. Stacy Pirro, Iridian Genomes Inc, USA, for allowing us to use their public data sets for whole-genome or organelle assembly and/or annotation; and submit genome assemblies to NCBI GenBank as TPA.
6. AUTHORS’ CONTRIBUTIONS
All authors made substantial contributions to conception and design, acquisition of data, or analysis and interpretation of data; took part in drafting the article or revising it critically for important intellectual content; agreed to submit to the current journal; gave final approval of the version to be published; and agreed to be accountable for all aspects of the work. All the authors are eligible to be an author as per the International Committee of Medical Journal Editors (ICMJE) requirements/guidelines.
7. FUNDING
There is no funding to report.
8. CONFLICTS OF INTEREST
The authors report no financial or any other conflicts of interest in this work.
9. ETHICAL APPROVALS
This study does not involve experiments on animals or human subjects.
10. DATA AVAILABILITY
The assembled nuclear genome, mitochondrial genome, and chloroplast genome of pygmy date palm were deposited to NCBI Genbank as TPA (Third Party Annotation) submission with the following accession numbers DXKA00000000, BK059358, and BK059355, respectively. The supplementary files generated in this study and the genome annotations of the both nuclear and organelle genome were deposited to Harvard dataverse (https://dataverse.harvard.edu/privateurl.xhtml?token=0d4a65ab-a3e1-4e0c-9cd0-b89210e14657).
11. PUBLISHER’S NOTE
This journal remains neutral with regard to jurisdictional claims in published institutional affiliation.
REFERENCES
1. Zheng T, Li P, Li L, Zhang Q. Research advances in and prospects of ornamental plant genomics. Hortic Res 2021;8:e65. [CrossRef]
2. Neelapu NR, Surekha C. Next-generation sequencing and metagenomics. In:Wong KC, editor. Computational Biology and Bioinformatics:Gene Regulation. Boca Raton:CRC Press;2016. 331-51.
3. Yadav V, Lekkala MM, Surekha C, Neelapu NR. Global scenario of advance fungal research in crop protection. In:Yadav A, Mishra S, Kour D, Yadav N, Kumar A, editors. Agriculturally Important Fungi for Sustainable Agriculture. Cham:Springer;2020. 313-46. [CrossRef]
4. Zhang Q, Chen W, Sun L, Zhao F, Huang B, Yang W,
5. United States Department of Agriculture (USDA), Agricultural Research Service, Maryland:National Plant Germplasm System, Germplasm Resources Information Network (GRIN Taxonomy), National Germplasm Resources Laboratory;2022. Available from:https://www.npgsweb.ars-grin.gov/gringlobal/ taxon/taxonomy detail?id=28056 [Last accessed on 2022 Feb 04].
6. The Royal Horticultural Society.
7. Royal Horticultural Society's (RHS) Ornamental. Award of Garden Merit (AGM) Plants 2021. London:Royal Horticultural Society's (RHS) Ornamental;2022. Available from:https://www.rhs.org.uk/plants/pdfs/agm-lists/agm-ornamentals.pdf [Last accessed on 2022 Feb 04].
8. Wolverton BC, Wolverton JD. Plants and soil microorganisms:Removal of formaldehyde, xylene, and ammonia from the indoor environment. J Miss Acad Sci 1993;38:11-5.
9. Schubert M, Lindgreen S, Orlando L. AdapterRemoval v2:Rapid adapter trimming, identification, and read merging. BMC Res Notes 2016;9:88. [CrossRef]
10. Chikhi R, Medvedev P. Informed and automated k-mer size selection for genome assembly. Bioinformatics 2014;30:31-7. [CrossRef]
11. Zimin AV, Marçais G, Puiu D, Roberts M, Salzberg SL, Yorke JA. The MaSuRCA genome assembler. Bioinformatics 2013;29:2669-77. [CrossRef]
12. Seppey M, Manni M, Zdobnov EM. BUSCO:Assessing genome assembly and annotation completeness. Methods Mol Biol 2019;1962:227-45. [CrossRef]
13. Institute for Systems Biology. RepeatModeler. Seattle:Institute for Systems Biology;2021. Available from:https://www.repeatmasker.org.repeatmodeler [Last accessed on 2022 Feb 04].
14. Tarailo-Graovac M, Chen N. Using RepeatMasker to identify repetitive elements in genomic sequences. Curr Protoc Bioinformatics 2009;Chapter 4:Unit 4.10 doi:10.1002/0471250953.bi0410s25 [CrossRef]
15. Stanke M, Diekhans M, Baertsch R, Haussler D. Using native and syntenically mapped cDNA alignments to improve
16. Chan PP, Lin BY, Mak AJ, Lowe TM. tRNAscan-SE 2.0:Improved detection and functional classification of transfer RNA genes. Nucleic Acids Res 2021;49:9077-96. [CrossRef]
17. UniProt Consortium. UniProt:The universal protein knowledgebase in 2021. Nucleic Acids Res 2021;49(D1):D480-9.
18. Jin J, Tian F, Yang DC, Meng YQ, Kong L, Luo J,
19. Emms DM, Kelly S. OrthoFinder:Phylogenetic orthology inference for comparative genomics. Genome Biol 2019;20:238. [CrossRef]
20. Beier S, Thiel T, Münch T, Scholz U, Mascher M. MISA-web:A web server for microsatellite prediction. Bioinformatics 2017;33:2583-5. [CrossRef]
21. Untergasser A, Cutcutache I, Koressaar T, Ye J, Faircloth BC, Remm M,
22. Jin JJ, Yu WB, Yang JB, Song Y, dePamphilis CW, Yi TS,
23. Shi L, Chen H, Jiang M, Wang L, Wu X, Huang L,
24. Jung J, Kim JI, Jeong YS, Yi G. AGORA:Organellar genome annotation from the amino acid and nucleotide references. Bioinformatics 2018;34:2661-3. [CrossRef]
25. Challa S, Neelapu NR. Phylogenetic trees:Applications, construction, and assessment. In:Hakeem K, Shaik N, Banaganapalli B, Elango R, editors. Essentials of Bioinformatics. Vol. 03. Cham:Springer;2019. 167-92. [CrossRef]
26. FigTree version 1.4.4. Edinburgh:Produce High-quality Figures of Phylogenetic Trees;2022. Available from:https://www.tree.bio.ed.ac.uk/software/figtree [Last accessed on 2022 Aug 27].
SUPPLEMENTARY
Supplementary Tables 1-11
https://drive.google.com/file/d/1sIsk1o_Rd4q2Lhxvi3AgTuZBri8cHyDm/view?usp=share_link