
ARTICLE HIGHLIGHTS
The nuclear genome size is predicted to be 454,049,232 bps for lemon grass. The de-novo assembly generated 127,303 scaffolds, with an assembly size of 364,442,032 bps. The genome assembly of lemon grass was complete by 60.9%.
A complete circular chloroplast genome of 139,690 bps was generated and annotated without any gap for lemon grass.
A complete circular mitochondrial genome of 367,579 bps was generated and annotated without any gap for lemon grass.
The genes and pathways (photosynthesis, glycolysis, pyruvate, terpenoid backbone synthesis, and tricarboxylic acid cycle) associated with essential oil production are identified and mapped.
1. INTRODUCTION
The essential oil-producing plants are primarily distributed across the plant kingdom and cover many families, including Lamiaceae (mint, basil, lavender), Rosaceae (roses), and Poaceae (aromatic grasses) [1]. The genus Cymbopogon of the Poaceae family is well known for its aromatic properties and consists of approximately 180 species distributed worldwide [2], of which 45 species are reported in India [3]. These fragrant grasses consist of a differential blend of several terpenoid constituents and are significant reserves of monoterpene-rich essential oils [4]. The major components reported in the essential oil of lemon grass are monoterpene alcohols, aldehydes, and acetates [5]. The monoterpene alcohols like geraniol (GOL) and citronellol (COL) are previously reported [5]. The aldehydes include geranial (GAL), neral (NAL), and citronellal (CAL) [5]. Acetates include citronellyl acetate and geranyl acetate [5].
Essential oils are significant in food flavors, cosmetics, oral healthcare products, fragrances, insect repellents, and aromatherapy. For instance, citral is a raw material for perfumery, confectionery, Vitamin A, and ionones [6]. Likewise, alcohol COL, a raw material for producing rose oxide, and its aldehyde CAL are used to manufacture flavor and fragrance agents [7]. In addition, essential oils and their constituents from aromatic grasses possess potent pharmacological activities like cytotoxic, anti-inflammatory, antifungal, and antioxidant [8]. Besides oil production, citronella grass is a flavoring agent for culinary purposes. Thus, there is a need to understand the genomic architecture of this highly significant species with relevance to essential oils.
Currently, 911 genes and 1,769 protein sequences are available at NCBI for the genus Cymbopogon [9], whereas 128 genes and 347 protein sequences are available at NCBI for Cymbopogon citratus L. [10]. The non-availability of high-quality genome sequence assembly for the species C. citratus is a bottleneck in understanding the genomic architecture of the species. The whole-genome sequencing (WGS) is a precise method for analyzing entire genomes [11]. The rapidly reducing sequencing costs and the ability to produce large volumes of data with today’s high throughput sequencers have made WGS a powerful tool for genomics research [11,12]. The raw genome sequence data of C. citratus is available at NCBI (BioProject ID: PRJNA610008) [13]. Thus, the present study aims to report the draft genome assembly of lemon grass with genes, repeats, and functional relevance; genes associated with metabolites and secondary metabolites; genes related to culinary properties in lemon grass; and genes and pathways associated with essential oil production in lemon grass.
2. MATERIALS AND METHODS
The genome of C. citratus was assembled and annotated with the modified protocol of Chakravartty and Neelapu [14].
2.1. Assembly and Annotation of the Nuclear Genome in Lemon Grass
2.1.1. Genome sample and assembly
The raw genome sequence data of C. citratus was downloaded from NCBI (BioProject ID: PRJNA610008), evaluated, and checked. AdapterRemoval version 2.3.2 was employed to remove contaminated adapter sequences and bases of low-quality (with Q30) from reads to provide high-quality clean data [15]. The de novo assembly is generated based on high-quality clean data. Jellyfish 2.2.10 [16] and GenomeScope version 1.0 [17] are employed to estimate the genome size, and MaSurCa version 3.3.2 [18] generated de novo assembly. BUSCO version 4.1.2 [19] is used to check the de novo assembly and was considered for downstream analysis to check the completeness and quality of the genome assembly. The plant dataset viridiplantae_odb10 is provided as a model for BUSCO version 4.1.2 [19].
2.1.2. Genome annotation and analysis
RepeatModeler version 2.0.1 [20] and RepeatMasker version 4.0.9 [21] are employed to identify repeats and mask the genome. AUGUSTUS version 3.3.2 [22] predicts genes with Arabidopsis as the model, and tRNAscan-SE version 2.0.6 [23] recognizes tRNAs. OrthoFinder version 2.2.7 [24] is employed to carry out orthologous analysis. The orthologous analysis was performed for predicted protein sequences of C. citratus by considering protein sequences of eight model species, i.e., Aegilops tauschii, Arabidopsis thaliana, Dichanthelium oligosanthes, Oryza sativa, Setaria italica, Sorghum bicolor, Triticum aestivum, and Zea mays. UniProt protein database [25] is employed to process functional annotation of the predicted genes based on homology. The top hits in the homology search are assigned to the genes in the functional annotation [25]. MISA version 2.1 [26] is utilized to predict simple sequence repeats markers, and primer3 version 2.5.0 [27] is employed to design primers.
2.1.3. Identifying genes and pathways associated with metabolites, secondary metabolites, and culinary properties in lemon grass
Mapman [28] and KEGG [29] predicted genes and pathways associated with the metabolism of essential oils in lemon grass. The orthologous analysis is carried out between C. citratus, and four culinary herbs Ocimum basilicum L., Origanum majorana L., Origanum vulgare L, and Rosmarinus officinalis L, to predict genes associated with the culinary properties in lemon grass. OrthoFinder version 2.2.7 [24] is employed to carry out orthologous analysis.
2.2. Assembly and Annotation of Organelle Genome in Lemon Grass
GetOrganelle version 1.6.4 [30] generated the mitochondria and chloroplast assembly. CPGAVAS2 version 1 [31] annotated the chloroplast genome, whereas AGORA version 1 [32] annotated the mitochondrial genome considering Y08501.2 as a model.
3. RESULTS AND DISCUSSION
3.1. Draft Genome (Nuclear and Organelle) Assembly of Lemon Grass
The whole-genome sequence data of 28.96 GBs from NCBI Bio project PRJNA610008 is retrieved. There were 194,645,804 reads, 44.237% of G.C. content, and 94.72% data ≥Q30 with read length 2 × 150bp. The adapter removal and quality trimming resulted in 194,640,684 reads, 44.23% of G.C. content, and 94.8% data ≥Q30. The genome size of 454,049,232 bps is predicted for lemon grass [Supplementary Figure 1]. The de-novo assembly generated 127,303 scaffolds, with an assembly size of 364,442,032 bps. The longest scaffold is 67,673 bps, and the shortest scaffold is 301 bps. Table 1 presents the genome estimation summary of lemon grass. The assembled genome’s G.C. content and scaffold length distribution are calculated and shown in Supplementary Figures 2 and 3, respectively. The G.C. content of the assembled genome is ~43.86%. The evaluation of the genome using BUSCO version 4.1.2., predicted that the genome assembly of lemon grass was complete by 60.9% [Table 1 and Supplementary Table 1].
Table 1: The summary of genome assembly, BUSCO score parameters, repeats, gene prediction, and annotation on lemon grass
| S. No. | Statistics | Count |
|---|---|---|
| Genome Assembly Statistics | ||
| 1 | Number of scaffolds | 127303 |
| 2 | Total size of scaffolds | 364442032 |
| 3 | Longest scaffold | 67673 |
| 4 | Shortest scaffold | 301 |
| 5 | Number of scaffolds >1K nt | 97384 |
| 6 | Percentage of scaffolds >1K nt | 76.5 |
| 7 | Number of scaffolds >10K nt | 4251 |
| 8 | Percentage of scaffolds >10K nt | 3.3 |
| 9 | Mean scaffold size | 2863 |
| 10 | Median scaffold size | 1864 |
| 11 | N50 scaffold length | 4347 |
| 12 | L50 scaffold count | 23781 |
| 13 | scaffold %A | 28 |
| 14 | scaffold %C | 21.91 |
| 15 | scaffold %G | 21.95 |
| 16 | scaffold %T | 28.11 |
| 17 | scaffold %N | 0.03 |
| BUSCO Statistics | ||
| 1 | Complete BUSCOs (C) | 60.90% |
| 2 | Complete and single-copy BUSCOs (S) | 58.80% |
| 3 | Complete and duplicated BUSCOs (D) | 2.10% |
| 4 | Fragmented BUSCOs (F) | 21.40% |
| 5 | Missing BUSCOs (M) | 17.7% |
| 6 | Total BUSCO groups searched | 100.00% |
| Repeat Statistics | ||
| 1 | SINEs | 665 |
| 2 | LINEs | 26231 |
| 3 | LTR elements | 51540 |
| 4 | DNA elements | 12288 |
| 5 | Unclassified | 366513 |
| 6 | Small RNA | 355 |
| 7 | Satellites | 229 |
| 8 | Simple repeats | 63921 |
| 9 | Low complexity | 7157 |
| Gene prediction and annotation | ||
| 1 | Number of CDS predicted | 41,775 |
| 2 | Number of CDS got annotated with UniProt protein db | 34,239 |
| 3 | Number of CDS got annotated with INTERPRO | 34,348 |
| 4 | Number of CDS got annotated with the plant metabolic network | 8,550 |
The repeat analysis predicted that 41.66% of the genome contains repetitive elements. Table 1 and Supplementary Table 2 provides the repeat classification. The repeat classification revealed 0.02% of SINEs, 3.64% of LINEs, 9.98% of LTR elements, 1.49% of DNA elements, and unclassified repeats of 25.41%. The analysis revealed 50779, 10874, 11942, 1515, 461, 451, and 4784 mono-nucleotide repeats, di-nucleotide repeats, tri-nucleotide repeats, tetra-nucleotide repeats, penta-nucleotide repeats, hexa-nucleotide repeats, and complex type repeats, respectively [Supplementary Table 3]. Out of the simple repeats predicted, the primers were designed successfully for 47,048 mono-nucleotides, 9321 di-nucleotides, 10,901 tri-nucleotides, 1378 tetra-nucleotides, 414 penta-nucleotides, 385 hexa-nucleotides and 4241 complex type repeats [Supplementary Table 3]. The tRNAs identified in the assembly of lemon grass are 681.
The gene prediction based on AUGUSTUS version 3.3.2 revealed 41,775 genes. Nearly 34,239 were annotated based on best hits with the UniProt protein database [Table 1]. InterproScan was used to annotate genes resulting in the annotation of 34,348 genes. The KEGG analysis predicted many significant pathways in lemon grass. The Gene Ontology categorization identified 1745 genes associated with biological processes, 484 genes related to cellular components, and 1373 genes linked with molecular function [Supplementary Figures 4-6]. The Mapman analysis identified 43.09% of genes having a significant role in metabolic pathways [Supplementary Figure 7]. Plant metabolic network analysis identified 8550 genes associated with metabolic pathways. A linear tree presents phylogenetic relationships of nine species based on the maximum likelihood method [24,33]. It is viewed in Figtree [34] to understand the phylogenetic relationship between the models and C. citratus, as shown in Supplementary Figure 8. The linear tree showed that lemon grass is close to S. bicolor, followed by Z. mays, S. italica, and D. oligosanthes. The orthologous study considered 562,517 genes, and nearly 447,596 (79.57%) genes are in orthogroups. The number of orthogroups identified in this study is 26,100, and Supplementary Table 4 presents the orthologous summary.
A complete circular chloroplast genome of 139,690 bps was generated and annotated without any gap [Supplementary Figure 9]. A complete circular mitochondrial genome of 367,579 bps was generated and annotated without any gap [Supplementary Figure 10]. A. thaliana ecotype Col-0 mitochondrion, complete genome (Y08501.2) was used as a reference for genome annotation in the mitochondria.
3.2. The Genes Associated with Metabolites and Secondary Metabolites in Lemon Grass
The study identified genes associated with metabolites and secondary metabolites of lemon grass. Metabolites and secondary metabolites are essential for producing essential oils in lemon grass. Table 2 summarizes lemon grass’s KO ID, gene count, and metabolic pathways [Figure 1 and Supplementary Figures 11-33]. The number of genes identified in purine metabolism, cysteine and methionine metabolism, glycerophospholipid metabolism, pyruvate metabolism, starch and sucrose metabolism, and pyrimidine metabolism is 43, 43, 35, 32, 31, and 30, respectively. Similarly, this study identifies fifteen genes in sulfur metabolism, sphingolipid, alpha-Linolenic acid, phenylalanine, tryptophan, and Beta-alanine.
Table 2: The genes identified and associated with the metabolism of lemon grass
| S. No. | KO ID | Metabolic pathways | Number of genes |
|---|---|---|---|
| 1 | 230 | Purine metabolism | 43 |
| 2 | 270 | Cysteine and methionine metabolism | 43 |
| 3 | 564 | Glycerophospholipid metabolism | 35 |
| 4 | 620 | Pyruvate metabolism | 32 |
| 5 | 500 | Starch and sucrose metabolism | 31 |
| 6 | 240 | Pyrimidine metabolism | 30 |
| 7 | 260 | Glycine, serine, and threonine metabolism | 29 |
| 8 | 630 | Glyoxylate and dicarboxylate metabolism | 28 |
| 9 | 561 | Glycerolipid metabolism | 27 |
| 10 | 250 | Alanine, aspartate and glutamate metabolism | 27 |
| 11 | 562 | Inositol phosphate metabolism | 23 |
| 12 | 330 | Arginine and proline metabolism | 22 |
| 13 | 480 | Glutathione metabolism | 20 |
| 14 | 53 | Ascorbate and aldarate metabolism | 19 |
| 15 | 350 | Tyrosine metabolism | 18 |
| 16 | 51 | Fructose and mannose metabolism | 17 |
| 17 | 52 | Galactose metabolism | 16 |
| 18 | 680 | Methane metabolism | 16 |
| 19 | 920 | Sulfur metabolism | 15 |
| 20 | 600 | Sphingolipid metabolism | 15 |
| 21 | 592 | alpha-Linolenic acid metabolism | 15 |
| 22 | 380 | Tryptophan metabolism | 15 |
| 23 | 410 | beta-Alanine metabolism | 15 |
| 24 | 790 | Folate biosynthesis | 15 |
| 25 | 950 | Isoquinoline alkaloid biosynthesis | 8 |
| 26 | 941 | Flavonoid biosynthesis | 13 |
| 27 | 940 | Phenylpropanoid biosynthesis | 15 |
| 28 | 904 | Diterpenoid biosynthesis | 9 |
| 29 | 906 | Carotenoid biosynthesis | 15 |
| 30 | 900 | Terpenoid backbone biosynthesis | 28 |
| 31 | 130 | Ubiquinone and other terpenoid-quinone biosynthesis | 20 |
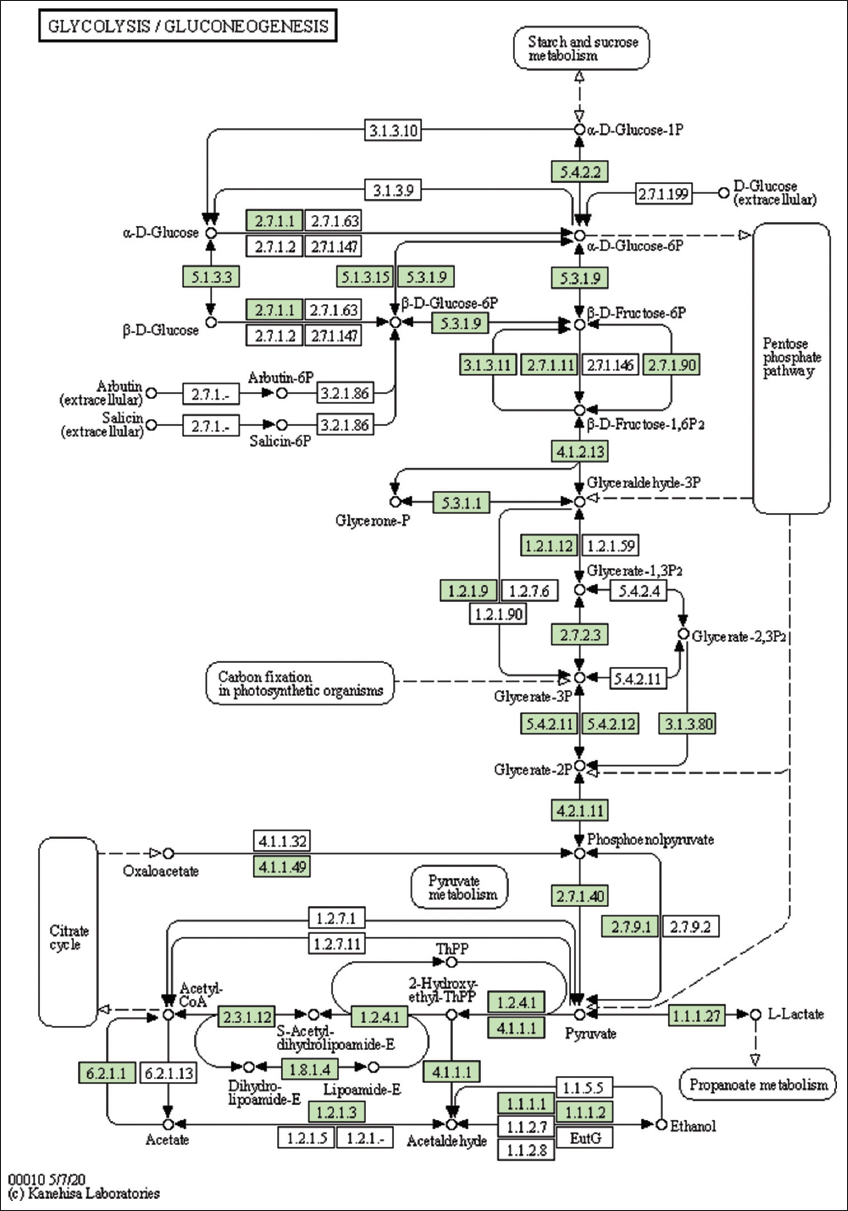
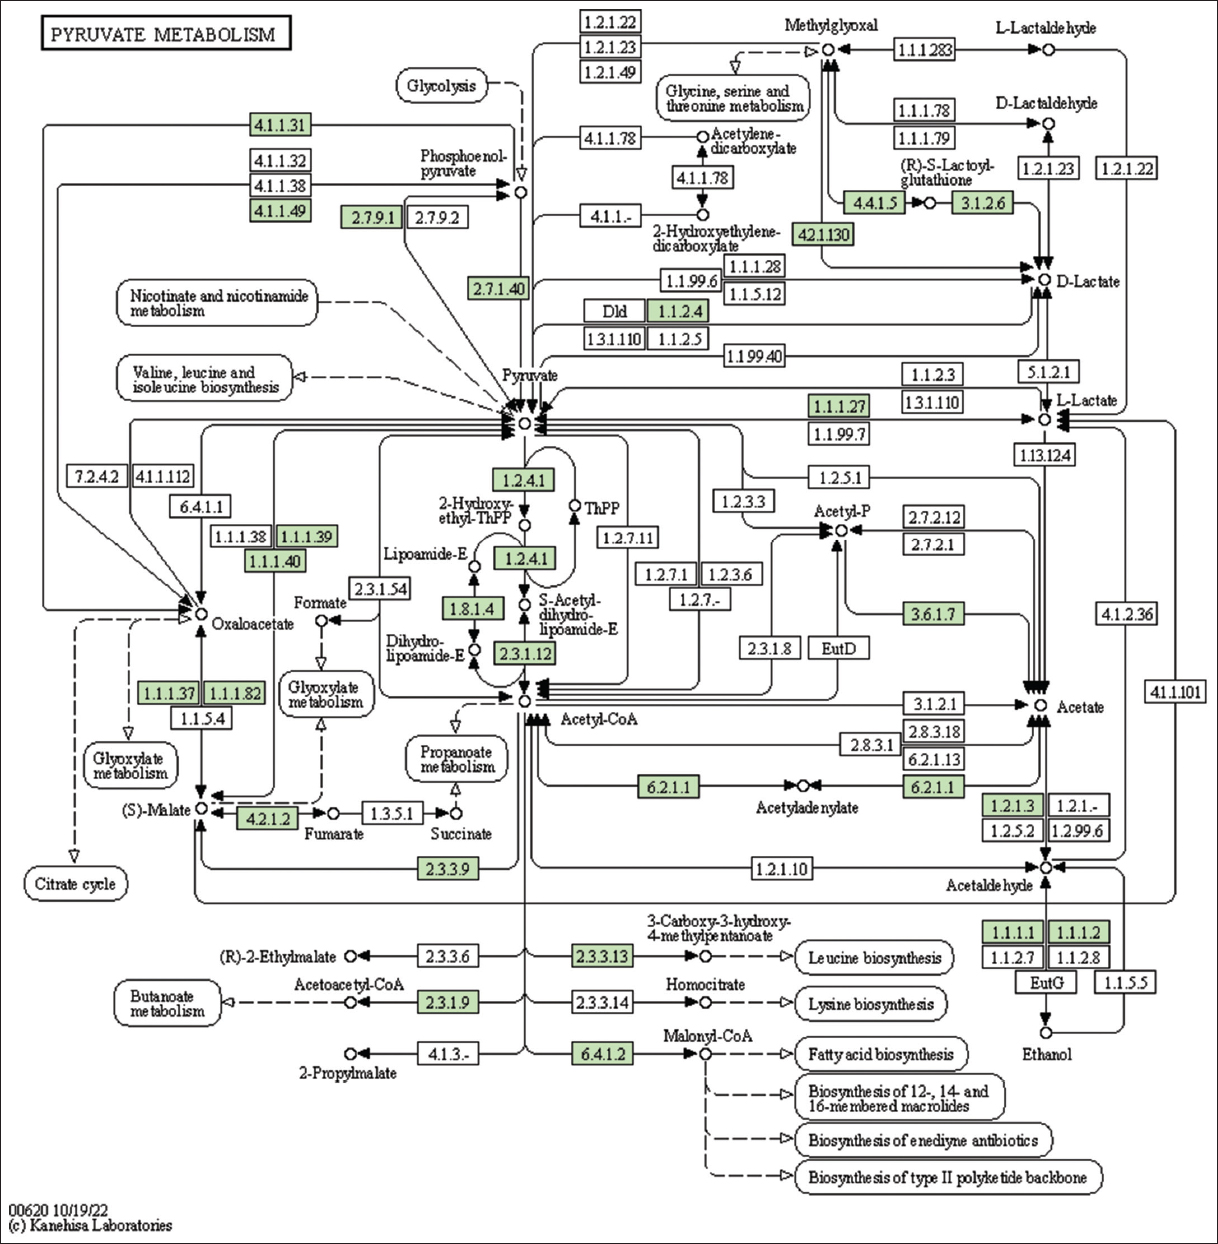 | Figure 1: The genes associated with metabolites of the pyruvate metabolism. This figure shows genes associated with metabolites of the pyruvate metabolism, and the genes are highlighted in the pathway. These genes are mapped onto the pathway and was retrieved from KAAS. [Click here to view] |
Table 2 summarizes genes associated with secondary metabolites [Figure 2 and Supplementary Figures 34-39]. The number of genes identified in folate biosynthesis, isoquinoline alkaloid biosynthesis, flavonoid biosynthesis, phenylpropanoid biosynthesis, diterpenoid biosynthesis, carotenoid biosynthesis, terpenoid backbone biosynthesis, and ubiquinone and other terpenoid-quinone biosynthesis are 15, 8, 13, 15, 9, 15, 28, and 20 respectively.
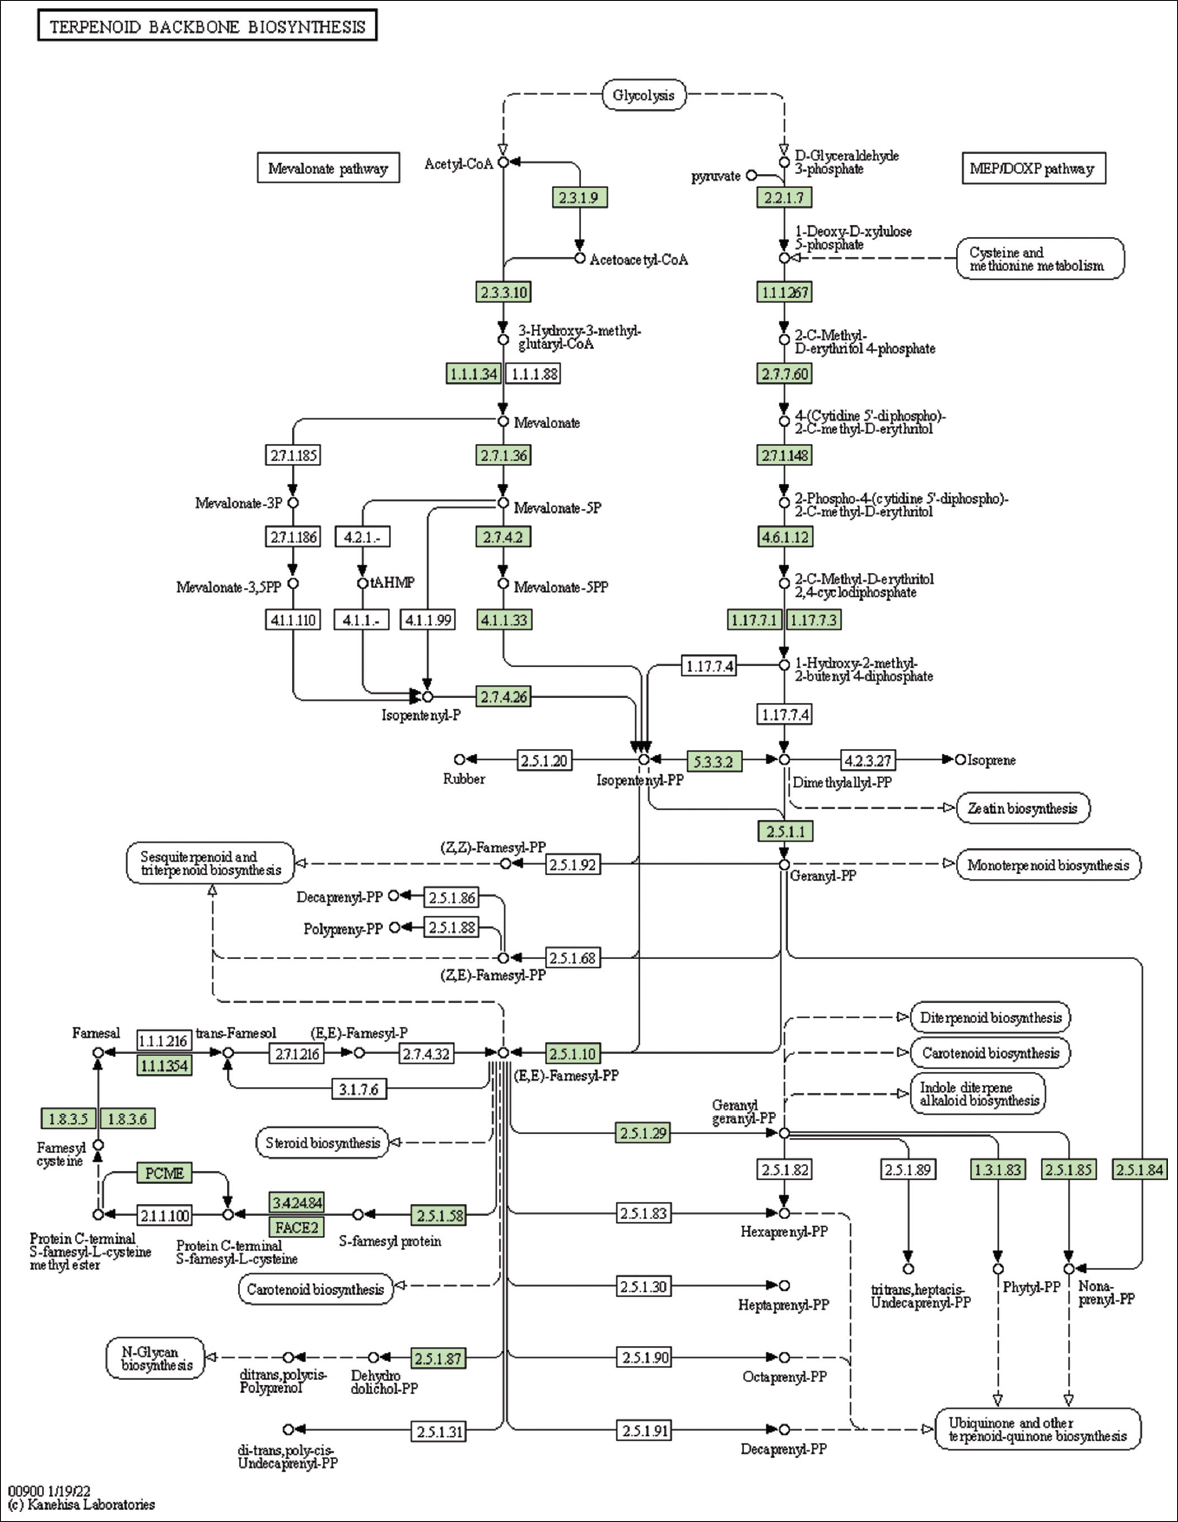 | Figure 2: The genes associated with metabolites of the terpenoid backbone synthesis. This figure shows genes associated with metabolites of the terpenoid backbone synthesis, and the genes are highlighted in the pathway. These genes are mapped onto the pathway and was retrieved from KAAS. [Click here to view] |
3.3. The Genes Associated with Culinary Properties in Lemon Grass
The orthologous analysis between C. citratus and four culinary herbs, O. basilicum L., O. majorana L., O. vulgare L., and R. officinalis L. identified the genes associated with culinary properties in lemon grass. Nearly 5442, 219, 9943, and 558 protein sequences are available for O. basilicum L., O. majorana L., O. vulgare L., and R. officinalis L. at NCBI. The orthologous study identified 7775 orthogroups; out of them, 74.8% of genes were present in the orthogroup. The Venn analysis revealed 19 orthogroups that are common between all the five culinary herbs, and Table 3 presents the orthologous summary. A linear tree shows the phylogenetic relationship of the five species based on the maximum likelihood method [27,33]. It is viewed in Figtree [34] to understand the phylogenetic relationship between the models and C. citratus, as shown in Supplementary Figure 40. The analysis also helped to identify genes associated with culinary properties in lemon grass, paving the way to culinary genomics.
Table 3: Orthologous analysis between five culinary herbs
| S. No. | Summary of Orthogroups and Genes | Counts | ||||
|---|---|---|---|---|---|---|
| Cymbopogon citratus | Ocimum basilicum | Origanum majorana | Origanum vulgare | Rosmarinus officinalis | ||
| 1 | Number of genes | 41775 | 5442 | 219 | 9943 | 558 |
| 2 | Number of genes in orthogroups | 32567 | 3348 | 182 | 6679 | 544 |
| 3 | Number of unassigned genes | 9208 | 2094 | 37 | 3264 | 14 |
| 4 | Percentage of genes in orthogroups | 78 | 61.5 | 83.1 | 67.2 | 97.5 |
| 5 | Percentage of unassigned genes | 22 | 38.5 | 16.9 | 32.8 | 2.5 |
| 6 | Number of orthogroups containing species | 5809 | 1849 | 94 | 2306 | 110 |
| 7 | Percentage of orthogroups containing species | 74.7 | 23.8 | 1.2 | 29.7 | 1.4 |
| 8 | Number of species-specific orthogroups | 4880 | 350 | 0 | 858 | 4 |
| 9 | Number of genes in species-specific orthogroups | 28564 | 1122 | 0 | 2873 | 26 |
| 10 | Percentage of genes in species-specific orthogroups | 68.4 | 20.6 | 0 | 28.9 | 4.7 |
3.4. The Genes and Pathways Associated with Essential oil Production in Lemon Grass
The lemon grass essential oil is a mixture of cyclic and acyclic monoterpenes (GAL, NAL, and CAL). Figure 3 shows the biosynthesis of essential oil in lemon grass, the role of different cellular organelles, and crosstalk with other metabolic processes [35]. Like most other plants, the lemongrass chloroplast produces glucose through photosynthesis. The present study identified and mapped the genes participating in the photosynthesis pathway of lemon grass [Table 4 and Figure 4]. The glucose undergoes glycolysis in the cytoplasm, yielding pyruvate, a two-carbon compound. The present study identified and mapped the genes participating in the pathway’s glycolysis and pyruvate of lemon grass [Table 4, Figures 1 and 5]. Lemongrass uses pyruvate as a substrate for the biosynthesis of isopentenyl diphosphate (IPP) units, either through the cytoplasmic mevalonate (MVA) pathway or plastidic methylerythritol phosphate (MEP) pathway in their young and rapidly growing leaves [35]. MVA Pathway (MVA pathway) is a multi-step (three-step) process that starts with two acetyl-CoA molecules and forms IPP units [36]. MVA-independent Pathway (MEP Pathway) is a multi-step (seven-step) process that begins with glyceraldehyde 3-phosphate and forms IPP [36].
Table 4: The genes associated with pathways of essential oil production identified in lemon grass.
| S. No. | Gene ID | KO ID | Gene Name | Annotation of the gene |
|---|---|---|---|---|
| Photosynthesis (map00195) | ||||
| 1 | G867.t1 | K02695 | psaH | photosystem I subunit VI |
| 2 | G2701.t1 | K08902 | psb27 | photosystem II Psb27 protein |
| 3 | G3233.t1 | K02638 | petE | Plastocyanin |
| 4 | G3376.t1 | K02692 | psaD | photosystem I subunit II |
| 5 | G3404.t1 | K02115 | ATPF1, atpG | F-type H+-transporting ATPase subunit gamma |
| 6 | G3831.t1 | K03542 | psbS | photosystem II 22kDa protein |
| 7 | G6122.t1 | K02699 | psaL | photosystem I subunit XI |
| 8 | G6505.t1 | K02717 | psbP | photosystem II oxygen-evolving enhancer protein 2 |
| 9 | G7149.t1 | K08903 | psb28 | photosystem II 13kDa protein |
| 10 | G9610.t1 | K02701 | psaN | photosystem I subunit PsaN |
| 11 | G12274.t1 | K02690 | psaB | photosystem I P700 chlorophyll a apoprotein A2 |
| 12 | G14580.t1 | K02639 | petF | Ferredoxin |
| 13 | G16158.t1 | K02721 | psbW | photosystem II PsbW protein |
| 14 | G17949.t1 | K08901 | psbQ | photosystem II oxygen-evolving enhancer protein 3 |
| 15 | G19732.t1 | K02636 | petC | cytochrome b6-f complex iron-sulfur subunit [EC: 7.1.1.6] |
| 16 | G20807.t1 | K02693 | psaE | photosystem I subunit IV |
| 17 | G23499.t1 | K02641 | petH | ferredoxin--NADP+reductase [EC: 1.18.1.2] |
| 18 | G25025.t1 | K03541 | psbR | photosystem II 10kDa protein |
| 19 | G26577.t1 | K02109 | ATPF0, atpF | F-type H+-transporting ATPase subunit b |
| 20 | G27268.t1 | K02113 | ATPF1, atpH | F-type H+-transporting ATPase subunit delta |
| 21 | G28907.t1 | K02694 | psaF | photosystem I subunit III |
| 22 | G30260.t1 | K02716 | psbO | photosystem II oxygen-evolving enhancer protein 1 |
| 23 | G36823.t1 | K08905 | psaG | photosystem I subunit V |
| 24 | G37457.t1 | K02723 | psbY | photosystem II PsbY protein |
| Glycolysis/Gluconeogenesis (map00010) | ||||
| 25 | G762.t1 | K03841 | FBP, fbp | fructose-1,6-bisphosphatase I [EC: 3.1.3.11] |
| 26 | G1358.t1 | K00382 | DLD, lpd, pdhD | dihydrolipoamide dehydrogenase [EC: 1.8.1.4] |
| 27 | G2227.t1 | K15633 | gpmI | 2,3-bisphosphoglycerate-independent phosphoglycerate mutase [EC: 5.4.2.12] |
| 28 | G3925.t1 | K00134 | GAPDH, gapA | glyceraldehyde 3-phosphate dehydrogenase (phosphorylating) [EC: 1.2.1.12] |
| 29 | G4309.t1 | K01006 | ppdK | pyruvate, orthophosphate dikinase [EC: 2.7.9.1] |
| 30 | G6749.t1 | K00128 | ALDH | aldehyde dehydrogenase (NAD+) [EC: 1.2.1.3] |
| 31 | G7450.t1 | K00895 | pfp, PFP | diphosphate-dependent phosphofructokinase [EC: 2.7.1.90] |
| 32 | G9335.t1 | K01810 | GPI, pgi | glucose-6-phosphate isomerase [EC: 5.3.1.9] |
| 33 | G9705.t1 | K01610 | E4.1.1.49, pckA | phosphoenolpyruvate carboxykinase (ATP) [EC: 4.1.1.49] |
| 34 | G10700.t1 | K01785 | galM, GALM | aldose 1-epimerase [EC: 5.1.3.3] |
| 35 | G11810.t1 | K00873 | PK, pyk | pyruvate kinase [EC: 2.7.1.40] |
| 36 | G12188.t1 | K01835 | Pgm | phosphoglucomutase [EC: 5.4.2.2] |
| 37 | G12423.t1 | K01568 | PDC, pdc | pyruvate decarboxylase [EC: 4.1.1.1] |
| 38 | G12843.t1 | K00844 | HK | hexokinase [EC: 2.7.1.1] |
| 39 | G13296.t1 | K01689 | ENO, eno | enolase [EC: 4.2.1.11] |
| 40 | G14904.t1 | K01785 | galM, GALM | aldose 1-epimerase [EC: 5.1.3.3] |
| 41 | G16892.t1 | K00002 | AKR1A1, adh | alcohol dehydrogenase (NADP+) [EC: 1.1.1.2] |
| 42 | G17507.t1 | K00627 | DLAT, aceF, pdhC | pyruvate dehydrogenase E2 component (dihydrolipoamide acetyltransferase) [EC: 2.3.1.12] |
| 43 | G18230.t1 | K00131 | gapN | glyceraldehyde-3-phosphate dehydrogenase (NADP+) [EC: 1.2.1.9] |
| 44 | G18839.t1 | K00927 | PGK, pgk | phosphoglycerate kinase [EC: 2.7.2.3] |
| 45 | G20474.t1 | K01623 | ALDO | fructose-bisphosphate aldolase, class I [EC: 4.1.2.13] |
| 46 | G22816.t1 | K01834 | PGAM, gpmA | 2,3-bisphosphoglycerate-dependent phosphoglycerate mutase [EC: 5.4.2.11] |
| 47 | G24955.t1 | K00016 | LDH, ldh | L-lactate dehydrogenase [EC: 1.1.1.27] |
| 48 | G26444.t1 | K01792 | E5.1.3.15 | glucose-6-phosphate 1-epimerase [EC: 5.1.3.15] |
| 49 | G30535.t1 | K01895 | ACSS1_2, acs | acetyl-CoA synthetase [EC: 6.2.1.1] |
| 50 | G34419.t1 | K01803 | TPI, tpiA | triosephosphate isomerase (TIM) [EC: 5.3.1.1] |
| 51 | G34750.t1 | K03103 | MINPP1 | multiple inositol-polyphosphate phosphatase/2,3-bisphosphoglycerate 3-phosphatase [EC: 3.1.3.62 3.1.3.80] |
| Pyruvate metabolism (map00620) | ||||
| 52 | G1358.t1 | K00382 | DLD, lpd, pdhD | dihydrolipoamide dehydrogenase [EC: 1.8.1.4] |
| 53 | G1431.t1 | K01759 | GLO1, gloA | lactoylglutathione lyase [EC: 4.4.1.5] |
| 54 | G2339.t1 | K00627 | DLAT, aceF, pdhC | pyruvate dehydrogenase E2 component (dihydrolipoamide acetyltransferase) [EC: 2.3.1.12] |
| 55 | G3152.t1 | K00626 | ACAT, atoB | acetyl-CoA C-acetyltransferase [EC: 2.3.1.9] |
| 56 | G4066.t1 | K00029 | E1.1.1.40, maeB | malate dehydrogenase (oxaloacetate-decarboxylating)(NADP+) [EC: 1.1.1.40] |
| 57 | G4673.t1 | K01759 | GLO1, gloA | lactoylglutathione lyase [EC: 4.4.1.5] |
| 58 | G4880.t1 | K00873 | PK, pyk | pyruvate kinase [EC: 2.7.1.40] |
| 59 | G6227.t1 | K11262 | ACACA | acetyl-CoA carboxylase/biotin carboxylase 1 [EC: 6.4.1.2 6.3.4.14 2.1.3.15] |
| 60 | G6396.t1 | K01512 | acyP | acylphosphatase [EC: 3.6.1.7] |
| 61 | G7753.t1 | K01069 | gloB, gloC, HAGH | hydroxyacylglutathione hydrolase [EC: 3.1.2.6] |
| 62 | G8777.t1 | K01595 | Ppc | phosphoenolpyruvate carboxylase [EC: 4.1.1.31] |
| 63 | G9662.t1 | K01638 | aceB, glcB | malate synthase [EC: 2.3.3.9] |
| 64 | G13833.t1 | K01895 | ACSS1_2, acs | acetyl-CoA synthetase [EC: 6.2.1.1] |
| 65 | G17101.t1 | K01649 | leuA, IMS | 2-isopropylmalate synthase [EC: 2.3.3.13] |
| 66 | G17414.t1 | K00028 | E1.1.1.39 | malate dehydrogenase (decarboxylating) [EC: 1.1.1.39] |
| 67 | G18607.t1 | K00382 | DLD, lpd, pdhD | dihydrolipoamide dehydrogenase [EC: 1.8.1.4] |
| 68 | G18719.t1 | K00051 | E1.1.1.82 | malate dehydrogenase (NADP+) [EC: 1.1.1.82] |
| 69 | G24955.t1 | K00016 | LDH, ldh | L-lactate dehydrogenase [EC: 1.1.1.27] |
| 70 | G31224.t1 | K00025 | MDH1 | malate dehydrogenase [EC: 1.1.1.37] |
| 71 | G32233.t1 | K00102 | LDHD, dld | D-lactate dehydrogenase (cytochrome) [EC: 1.1.2.4] |
| 72 | G35811.t1 | K01595 | Ppc | phosphoenolpyruvate carboxylase [EC: 4.1.1.31] |
| 73 | G9705.t1 | K01610 | E4.1.1.49, pckA | phosphoenolpyruvate carboxykinase (ATP) [EC: 4.1.1.49] |
| Terpenoid backbone biosynthesis (map00900) | ||||
| 74 | G1288.t1 | K15889 | PCME | prenylcysteine alpha-carboxyl methylesterase [EC: 3.1.1.-] |
| 75 | G1832.t1 | K10960 | chlP, bchP | geranylgeranyl diphosphate/geranylgeranyl-bacteriochlorophyllide a reductase [EC: 1.3.1.83 1.3.1.111] |
| 76 | G2230.t1 | K00787 | FDPS | farnesyl diphosphate synthase [EC: 2.5.1.1 2.5.1.10] |
| 77 | G2323.t1 | K00869 | MVK, mvaK1 | mevalonate kinase [EC: 2.7.1.36] |
| 78 | G3152.t1 | K00626 | ACAT, atoB | acetyl-CoA C-acetyltransferase [EC: 2.3.1.9] |
| 79 | G6541.t1 | K06981 | ipk | isopentenyl phosphate kinase [EC: 2.7.4.26] |
| 80 | G8703.t1 | K05954 | FNTB | protein farnesyltransferase subunit beta [EC: 2.5.1.58] |
| 81 | G8827.t1 | K01823 | idi, IDI | isopentenyl-diphosphate Delta-isomerase [EC: 5.3.3.2] |
| 82 | G9071.t1 | K00099 | dxr | 1-deoxy-D-xylulose-5-phosphate reductoisomerase [EC: 1.1.1.267] |
| 83 | G9850.t1 | K15891 | FLDH | NAD+-dependent farnesol dehydrogenase [EC: 1.1.1.354] |
| 84 | G10131.t1 | K01641 | HMGCS | hydroxymethylglutaryl-CoA synthase [EC: 2.3.3.10] |
| 85 | G10476.t1 | K01662 | dxs | 1-deoxy-D-xylulose-5-phosphate synthase [EC: 2.2.1.7] |
| 86 | G10495.t1 | K11778 | DHDDS, RER2, SRT1 | ditrans, polycis-polyprenyl diphosphate synthase [EC: 2.5.1.87] |
| 87 | G10803.t1 | K05356 | SPS, sds | all-trans-nonaprenyl-diphosphate synthase [EC: 2.5.1.84 2.5.1.85] |
| 88 | G11653.t1 | K00991 | ispD | 2-C-methyl-D-erythritol 4-phosphate cytidylyltransferase [EC: 2.7.7.60] |
| 89 | G11679.t1 | K00919 | ispE | 4-diphosphocytidyl-2-C-methyl-D-erythritol kinase [EC: 2.7.1.148] |
| 90 | G13764.t1 | K00938 | E2.7.4.2, mvaK2 | phosphomevalonate kinase [EC: 2.7.4.2] |
| 91 | G14936.t1 | K06013 | STE24 | STE24 endopeptidase [EC: 3.4.24.84] |
| 92 | G15260.t1 | K01770 | ispF | 2-C-methyl-D-erythritol 2,4-cyclodiphosphate synthase [EC: 4.6.1.12] |
| 93 | G23454.t1 | K13789 | GGPS1 | geranylgeranyl diphosphate synthase, type III [EC: 2.5.1.1 2.5.1.10 2.5.1.29] |
| 94 | G27299.t1 | K00021 | HMGCR | hydroxymethylglutaryl-CoA reductase (NADPH) [EC: 1.1.1.34] |
| 95 | G29757.t1 | K08658 | RCE1, FACE2 | prenyl protein peptidase [EC: 3.4.22.-] |
| 96 | G38362.t1 | K01597 | MVD, mvaD | diphosphomevalonate decarboxylase [EC: 4.1.1.33] |
| 97 | G39569.t1 | K05906 | PCYOX1, FCLY | prenylcysteine oxidase/farnesylcysteine lyase [EC: 1.8.3.5 1.8.3.6] |
| Citrate cycle (TCA cycle) (map00020) | ||||
| 98 | G115.t1 | K01647 | CS, gltA | citrate synthase [EC: 2.3.3.1] |
| 99 | G777.t1 | K01899 | LSC1 | succinyl-CoA synthetase alpha subunit [EC: 6.2.1.4 6.2.1.5] |
| 100 | G1358.t1 | K00382 | DLD, lpd, pdhD | dihydrolipoamide dehydrogenase [EC: 1.8.1.4] |
| 101 | G1497.t1 | K00234 | SDHA, SDH1 | succinate dehydrogenase (ubiquinone) flavoprotein subunit [EC: 1.3.5.1] |
| 102 | G2517.t1 | K01647 | CS, gltA | citrate synthase [EC: 2.3.3.1] |
| 103 | G7103.t1 | K00164 | OGDH, sucA | 2-oxoglutarate dehydrogenase E1 component [EC: 1.2.4.2] |
| 104 | G9705.t1 | K01610 | E4.1.1.49, pckA | phosphoenolpyruvate carboxykinase (ATP) [EC: 4.1.1.49] |
| 105 | G11248.t1 | K01648 | ACLY | ATP citrate (pro-S)-lyase [EC: 2.3.3.8] |
| 106 | G13750.t1 | K00658 | DLST, sucB | 2-oxoglutarate dehydrogenase E2 component (dihydrolipoamide succinyltransferase) [EC: 2.3.1.61] |
| 107 | G15077.t1 | K01681 | ACO, acnA | aconitate hydratase [EC: 4.2.1.3] |
| 108 | G17507.t1 | K00627 | DLAT, aceF, pdhC | pyruvate dehydrogenase E2 component (dihydrolipoamide acetyltransferase) [EC: 2.3.1.12] |
| 109 | G18607.t1 | K00382 | DLD, lpd, pdhD | dihydrolipoamide dehydrogenase [EC: 1.8.1.4] |
| 110 | G23327.t1 | K00161 | aceE | pyruvate dehydrogenase E1 component [EC: 1.2.4.1] |
| 111 | G28266.t1 | K00031 | IDH1, IDH2, icd | isocitrate dehydrogenase [EC: 1.1.1.42] |
| 112 | G28544.t1 | K00030 | IDH3 | isocitrate dehydrogenase (NAD+) [EC: 1.1.1.41] |
| 113 | G39479.t1 | K01681 | ACO, acnA | aconitate hydratase [EC: 4.2.1.3] |
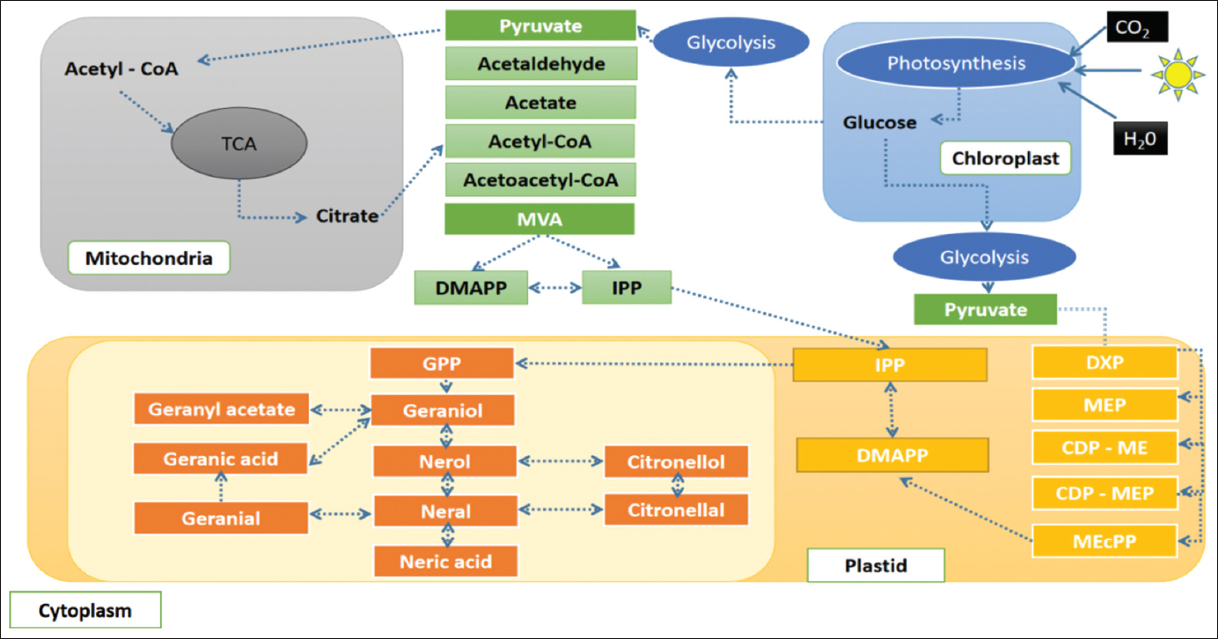 | Figure 3: The summary of the pathway for biosynthesis of essential oil in lemon grass. The figure summarizes the pathway for the biosynthesis of lemon grass essential oil, its crosstalk with other metabolic processes, and the role of different organelles. [Click here to view] |
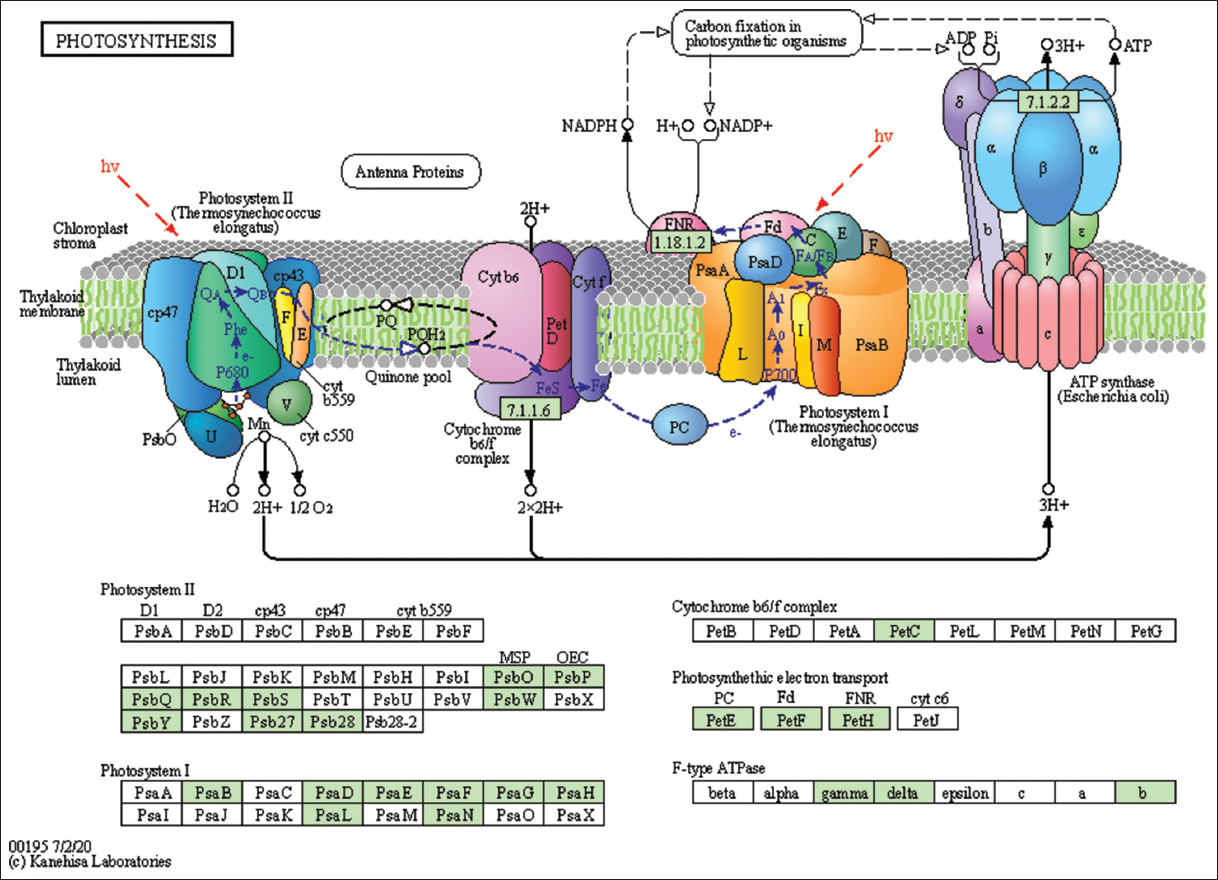 | Figure 4: The genes associated with metabolites of the photosynthetic pathway. This figure shows genes associated with metabolites of the photosynthetic pathway, and the genes are highlighted in the pathway. These genes are mapped onto the pathway and was retrieved from KAAS. [Click here to view] |
 | Figure 5: The genes associated with metabolites of the glycolysis pathway. This figure shows genes associated with metabolites of the glycolytic pathway, and the genes are highlighted in the pathway. These genes are mapped onto the pathway and was retrieved from KAAS. [Click here to view] |
The present study identified and mapped the genes in lemon grass’s terpenoid backbone synthesis pathway [Table 4 and Figure 2]. This pathway shows the information on terpenoid backbone synthesis, MVA, and MEP pathways. Alternatively, Mitochondria can import pyruvate and yield citrate through the tricarboxylic acid (TCA) cycle [35]. The present study identified and mapped the genes participating in the pathway TCA cycle of lemon grass [Table 4 and Figure 6]. The citrate can transform into Acetyl-CoA and join the MVA pathway to yield IPP units. The geranyl diphosphate (GPP) mediated step produces GOL from IPP in lemongrass plastids [34] [Table 4 and Figure 2].
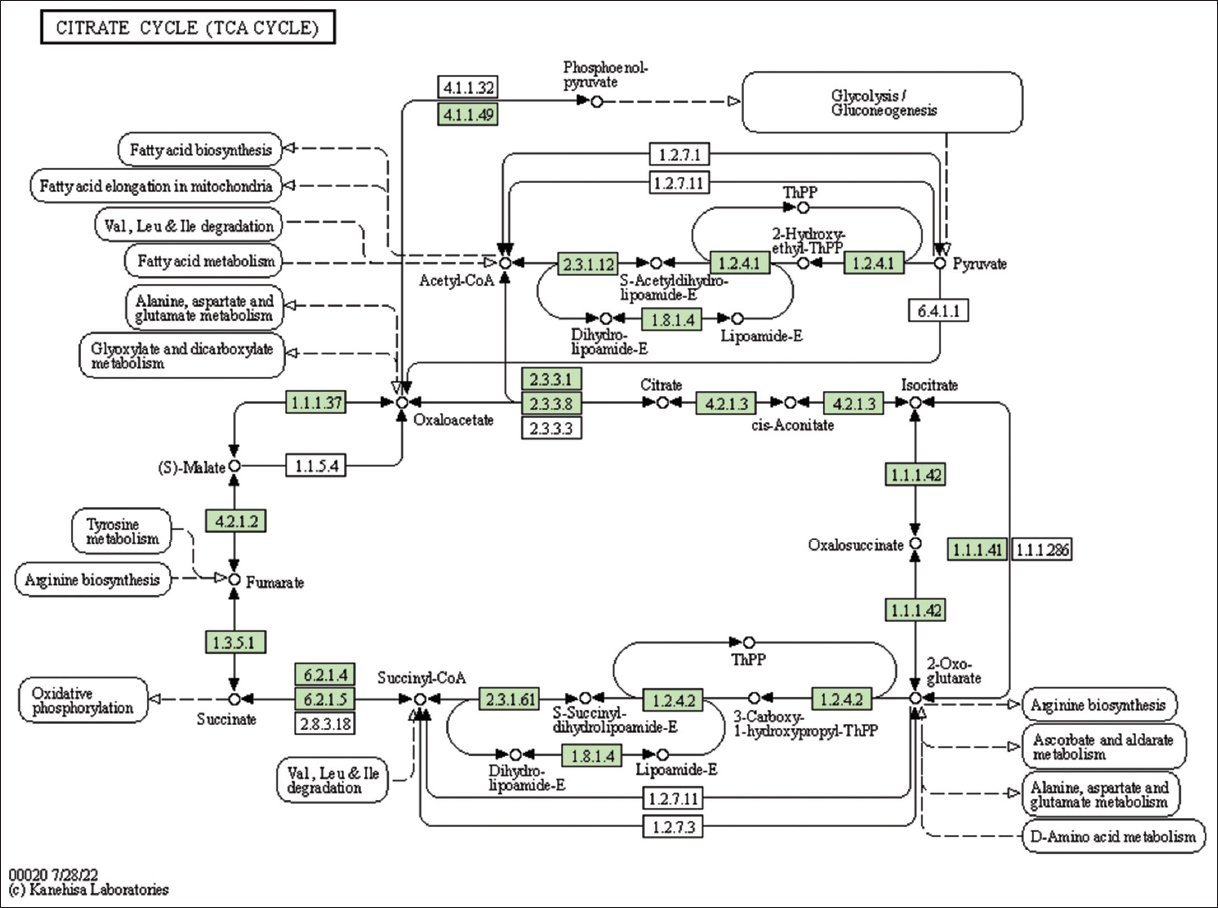 | Figure 6: The genes associated with metabolites of the TCA cycle. This figure shows genes associated with metabolites of the TCA cycle; the genes are highlighted in the pathway. These genes are mapped onto the pathway and was retrieved from KAAS. [Click here to view] |
IPP and dimethylallyl diphosphate (DMAPP) units are condensed to form GPP. IPP is converted to GPP by GPP synthase or GPS (E.C. 2.5.1.1) through the MVA and MEP pathways. GOL is a precursor for essential oil biosynthesis in lemongrass and yields all the major components through multiple reversible and irreversible reactions [35].
The number of genes identified in terpene synthesis is 34, and Supplementary Table 5 presents the detailed table. The number of genes identified in MEP and mevalonic acid (MVA) is 37. Supplementary Table 6 shows the detailed table. The genes identified in the metabolic pathways of MEP and MVA, can further be validated in the wet laboratory study.
4. CONCLUSION
The biosynthesis of essential oil starts with glucose production through photosynthesis. Glucose undergoes glycolysis in the cytoplasm, yielding pyruvate. Pyruvate is a substrate for the biosynthesis of IPP through the MVA or MEP pathways. The IPP and DMAPP units are condensed, forming GPP by GPP synthase leading to GOL. GOL is the precursor for essential oil (GAL, NAL, and CAL) biosynthesis through multiple reversible and irreversible reactions. This study presents the draft de-novo assembly (scaffold-level assembly with gaps) and annotation of C. citratus as a valuable resource for the scientific community. This study also identified and mapped genes participating in pathways of photosynthesis, glycolysis, pyruvate, terpenoid backbone synthesis, and TCA cycle, which are associated with essential oil production in lemon grass. Future studies include validating the genes identified in terpene synthesis, MEP and MVA through wet laboratory studies. This study will help in understanding the biosynthesis of essential oil production.
5. ACKNOWLEDGMENT
NC and NNNR are grateful to the management of GITAM (Deemed to be University) for providing the necessary facilities to carry out the research work and extending constant support. The authors are grateful to Dr. Stacy Pirro, Iridian Genomes Inc, USA, for allowing us to use their public data sets for whole-genome or organelle assembly and/or annotation; and submit genome assemblies to NCBI GenBank as Third-Party Annotation (TPA).
6. AUTHORS’ CONTRIBUTIONS
All authors made substantial contributions to the conception and design, acquisition of data, or analysis and interpretation of data; took part in drafting the article or revising it critically for important intellectual content; agreed to submit to the current journal; gave final approval of the version to be published; and agreed to be accountable for all aspects of the work. All the authors are eligible to be an author as per the International Committee of Medical Journal Editors (ICMJE) requirements/guidelines.
7. FUNDING
There is no funding to report.
8. CONFLICTS OF INTEREST
The authors report no financial or any other conflicts of interest in this work.
9. ETHICAL APPROVALS
This study does not involve experiments on animals or human subjects.
10. DATA AVAILABILITY
The assembled nuclear genome, mitochondrial genome, and chloroplast genome of lemon grass (C. citratus L.) were deposited to NCBI Genome as TPA (Third Party Annotation) submission with accession numbers DXKC00000000, BK059359, and BK059356 respectively. The supplementary files generated in this study and the nuclear and organelle genome annotations were deposited to Harvard dataverse (https://doi.org/10.7910/DVN/ZTM70X).
11. PUBLISHER’S NOTE
This journal remains neutral with regard to jurisdictional claims in published institutional affiliation.
REFERENCES
1. Meena S, Kumar SR, Venkata Rao DK, Dwivedi V, Shilpashree HB, Rastogi S, et al. De novo sequencing and analysis of lemongrass transcriptome provide first insights into the essential oil biosynthesis of aromatic grasses. Front Plant Sci 2016;7:1129. [https://doi.org/10.3389/fpls.2016.01129]
2. Bertea CM, Maffei ME. The genus Cymbopogon-botany, including anatomy, physiology, biochemistry, and molecular biology. In:Akhila A, editor. Essential Oil-bearing Grasses, The Genus Cymbopogon. Boca Raton:CRC Press;2010. 1-24.
3. Padalia RC, Verma RS, Chanotiya CS, Yadav A. Chemical fingerprinting of the fragrant volatiles of nineteen Indian cultivars of Cymbopogon spreng (Poaceae). Rec Nat Prod 2011;5:290-9.
4. Devi K, Dehury B, Phukon M, Modi MK, Sen P. Novel insights into structure-function mechanism and tissue-specific expression profiling of full-length dxr gene from Cymbopogon winterianus. FEBS Open Bio 2015;5:325-34. [https://doi.org/10.1016/j.fob.2015.04.005]
5. Khanuja SP, Shasany AK, Pawar A, Lal RK, Darokar MP, Naqvi AA, et al. Essential oil constituents and RAPD markers to establish species relationship in Cymbopogon Spreng. (Poaceae). Biochem Syst Ecol 2005;33:171-86. [https://doi.org/10.1016/j.bse.2004.06.011]
6. Moyler DA. Citral from lemongrass and other natural sources:Its toxicology and legislation. In:Akhila A, editor. Essential Oil-bearing Grasses. Boca Raton:CRC Press;2010. 223-38.
7. Pimentel MR, Molina G, Bertucci TC, Pastore GM. Biotransformation of citronellol in rose oxide by Pseudomonas spp. Chem Eng Trans 2012;27:295-300.
8. Bayala B, Bassole IH, Scifo R, Gnoula C, Morel L, Lobaccaro JM, et al. Anticancer activity of essential oils and their chemical components-a review. Am J Cancer Res 2014;4:591-607.
9. Cymbopogon. National Center for Biotechnology Information;2022. Available from:https://www.ncbi.nlm.nih.gov/search/all/?term=cymbopogo n%20 [Last accessed on 2022 Nov 17].
10. Cymbopogon citratus. National Center for Biotechnology Information;2022. Available from:https://www.ncbi.nlm.nih.gov/search/all/?term=cymbopogon++citratus [Last accessed on 2022 Nov 17].
11. Neelapu NR, Surekha C. Next-generation sequencing and metagenomics. In:Wong KC, editor. Computational Biology and Bioinformatics:Gene Regulation. Boca Raton:CRC Press;2016. 331-51.
12. Yadav V, Lekkala MM, Surekha C, Neelapu NR. Global scenario of advance fungal research in crop protection. In:Yadav AN, Mishra S, Kour D, Yadav N, Kumar A, editors. Agriculturally Important Fungi for Sustainable Agriculture. Cham:Springer;2020. 313-46. [https://doi.org/10.1007/978-3-030-48474-3_11]
13. Cymbopogon citratus. National Center for Biotechnology Information;2022. Available from:https://www.ncbi.nlm.nih.gov/bioproject [Last accessed on 2022 Nov 17].
14. Chakravartty N, Neelapu NR. The de novo genome assembly (nuclear, chloroplast and mitochondria) of ornamental plant pygmy date palm Phoenix roebelenii. J Appl Biol Biotech 2023;11:113-22. [https://doi.org/10.7324/JABB.2023.38646]
15. Schubert M, Lindgreen S, Orlando L. AdapterRemoval v2:Rapid adapter trimming, identification, and read merging. BMC Res Notes 2016;9:88. [https://doi.org/10.1186/s13104-016-1900-2]
16. Marçais G, Kingford C. A fast, lock-free approach for efficient parallel counting of occurrences of k- mers. Bioinformatics 2011;27:764-70. [https://doi.org/10.1093/bioinformatics/btr011]
17. Vurture GW, Sedlazeck FJ, Nattestad M, Underwood CJ, Fang H, Gurtowski J, et al. GenomeScope:Fast reference-free genome profiling from short reads. Bioinformatics 2017;33:2202-4. [https://doi.org/10.1093/bioinformatics/btx153]
18. Zimin AV, Marçais G, Puiu D, Roberts M, Salzberg SL, Yorke JA. The MaSuRCA genome assembler. Bioinformatics 2013;29:2669-77. [https://doi.org/10.1093/bioinformatics/btt476]
19. Seppey M, Manni M, Zdobnov EM. BUSCO:Assessing genome assembly and annotation completeness. Methods Mol Biol 2019;1962:227-45. [https://doi.org/10.1007/978-1-4939-9173-0_14]
20. Institute for Systems Biology. RepeatModeler. Seattle:Institute for Systems Biology;2021. Available from:https://www.repeatmasker.org.repeatmodeler [Last accessed on 2022 Feb 04].
21. Tarailo-Graovac M, Chen N. Using RepeatMasker to identify repetitive elements in genomic sequences. Curr Protoc Bioinformatics 2009;Chapter 4:Unit 4.10. doi:10.1002/0471250953.bi0410s25. [https://doi.org/10.1002/0471250953.bi0410s25]
22. Stanke M, Diekhans M, Baertsch R, Haussler D. Using native and syntenically mapped cDNA alignments to improve de novo gene finding. Bioinformatics 2008;24:637-44. [https://doi.org/10.1093/bioinformatics/btn013]
23. Chan PP, Lin BY, Mak AJ, Lowe TM. tRNAscan-SE 2.0:Improved detection and functional classification of transfer RNA genes. Nucleic Acids Res 2021;49:9077-96. [https://doi.org/10.1093/nar/gkab688]
24. Emms DM, Kelly S. OrthoFinder:Phylogenetic orthology inference for comparative genomics. Genome Biol 2019;20:238. [https://doi.org/10.1186/s13059-019-1832-y]
25. UniProt Consortium. UniProt:The universal protein knowledgebase in 2021. Nucleic Acids Res 2021;49:D480-9.
26. Beier S, Thiel T, Münch T, Scholz U, Mascher M. MISA-web:A web server for microsatellite prediction. Bioinformatics 2017;33:2583-5. [https://doi.org/10.1093/bioinformatics/btx198]
27. Untergasser A, Cutcutache I, Koressaar T, Ye J, Faircloth BC, Remm M, et al. Primer3--new capabilities and interfaces. Nucleic Acids Res 2012;40:e115. [https://doi.org/10.1093/nar/gks596]
28. Thimm O, Bläsing O, Gibon Y, Nagel A, Meyer S, Krüger P, et al. MAPMAN:A user-driven tool to display genomics data sets onto diagrams of metabolic pathways and other biological processes. Plant J 2004;37:914-39. [https://doi.org/10.1111/j.1365-313X.2004.02016.x]
29. Kanehisa M, Furumichi M, Sato Y, Kawashima M, Ishiguro-Watanabe M. KEGG for taxonomy-based analysis of pathways and genomes. Nucleic Acids Res 2023;51:D587-92. [https://doi.org/10.1093/nar/gkac963]
30. Jin JJ, Yu WB, Yang JB, Song Y, dePamphilis CW, Yi TS, et al. GetOrganelle:A fast and versatile toolkit for accurate de novo assembly of organelle genomes. Genome Biol 2020;21:241. [https://doi.org/10.1186/s13059-020-02154-5]
31. Shi L, Chen H, Jiang M, Wang L, Wu X, Huang L, et al. CPGAVAS2, an integrated plastome sequence annotator and analyzer. Nucleic Acids Res 2019;47:W65-73. [https://doi.org/10.1093/nar/gkz345]
32. Jung J, Kim JI, Jeong YS, Yi G. AGORA:Organellar genome annotation from the amino acid and nucleotide references. Bioinformatics 2018;34:2661-3. [https://doi.org/10.1093/bioinformatics/bty196]
33. Challa S, Neelapu NR. Phylogenetic trees:Applications, construction, and assessment. In:Hakeem KR, Shaik N, Banaganapalli B, Elango R, editors. Essentials of Bioinformatics. Vol. 3. Cham:Springer;2019. 167-92. [https://doi.org/10.1007/978-3-030-19318-8_10]
34. FigTree Version 1.4.4. Edinburgh:Produce High-quality Figures of Phylogenetic Trees;2022. Available from:https://www.tree.bio.ed.ac.uk/software/figtree [Last accessed on 2022 Aug 27].
35. Mukarram M, Choudhary S, Khan MA, Poltronieri P, Khan MM, Ali J, et al. Lemongrass essential oil components with antimicrobial and anticancer activities. Antioxidants (Basel) 2021;11:20. [https://doi.org/10.3390/antiox11010020]
36. Mukarram M, Khan MM, Zehra A, Choudhary S, Naeem M. Biosynthesis of lemongrass essential oil and the underlying mechanism for its insecticidal activity. In:Aftab T, Hakeem KR, editors. Medicinal and Aromatic Plants. Cham:Springer;2021. 429-43. [https://doi.org/10.1007/978-3-030-58975-2_18]
SUPPLEMENTARY MATERIALS
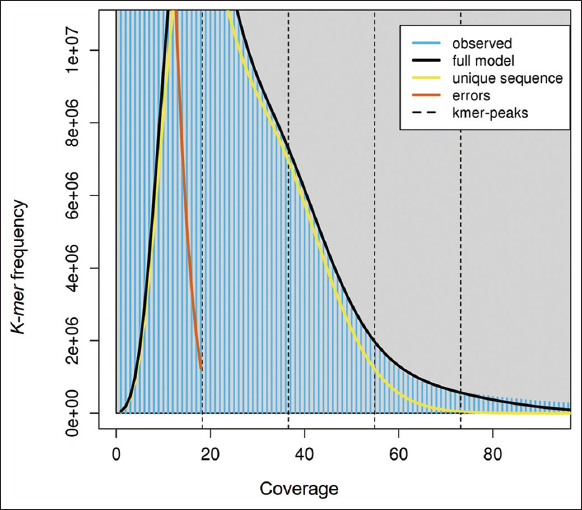 | Supplementary Figure 1: The K-mer histogram for estimation of genome size in lemon grass. The figure shows K-mers frequency in lemon grass’s genome, which is predicted using Jellyfish and visualized using GenomeScope. A graph was plotted with K-mer frequency on the X-axis and the coverage on the Y-axis. The predicted genome size of lemon grass is 454,049,232 bp. [Click here to view] |
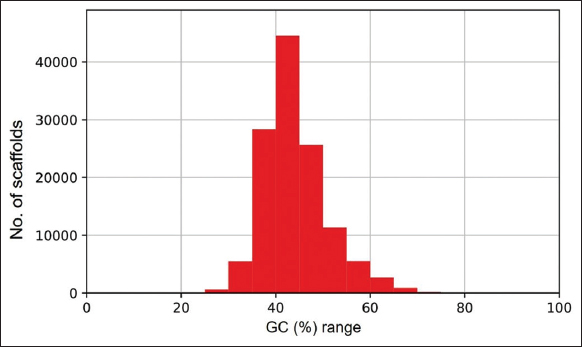 | Supplementary Figure 2: The distribution of G.C. percentage in the assembled genome of lemon grass. The figure shows the distribution of G.C. percentage in the assembled genome of lemon grass. A graph was plotted with the G.C. percentage range (G.C. %) on the X-axis and the number of scaffolds (contigs) on the Y-axis. The G.C. percentage in the assembled genome of lemon grass is ~ 43.86%. [Click here to view] |
 | Supplementary Figure 3: The cumulative length distribution of the assembled genome in lemon grass. The figure shows the distribution of scaffold length distribution in the assembled genome of lemon grass. A graph was plotted with the scaffold length range on the X-axis and the number of scaffolds on the Y-axis. [Click here to view] |
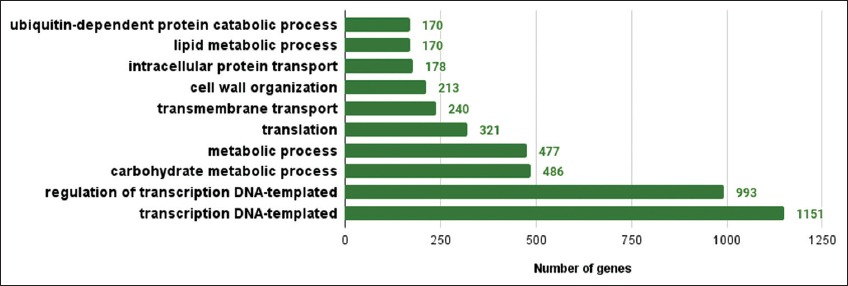 | Supplementary Figure 4: The gene ontologies related to biological process observed in lemon grass. The figure shows gene ontologies related to biological processes observed in lemon grass. A graph with gene ontologies of biological processes on the X-axis and the number of genes on the Y-axis is plotted. [Click here to view] |
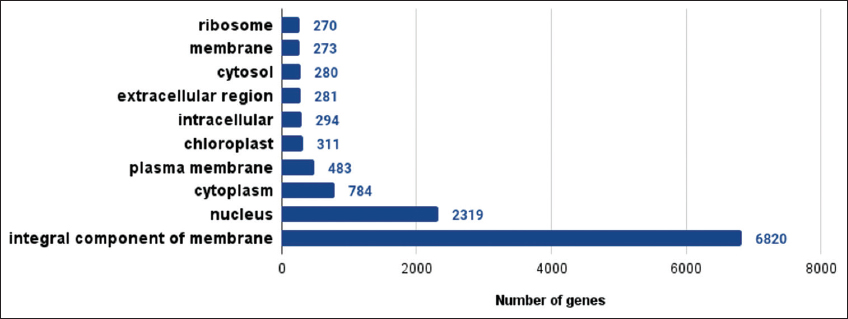 | Supplementary Figure 5: The gene ontologies related to cellular components observed in lemon grass. The figure shows gene ontologies related to cellular components observed in lemon grass. A graph with gene ontologies of cellular components on the X-axis and the number of genes on the Y-axis is plotted. [Click here to view] |
 | Supplementary Figure 6: The gene ontologies related to molecular function observed in lemon grass. The figure shows gene ontologies related to molecular functions observed in lemon grass. A graph with gene ontologies of molecular functions on the X-axis and a number of genes on the Y-axis is plotted. [Click here to view] |
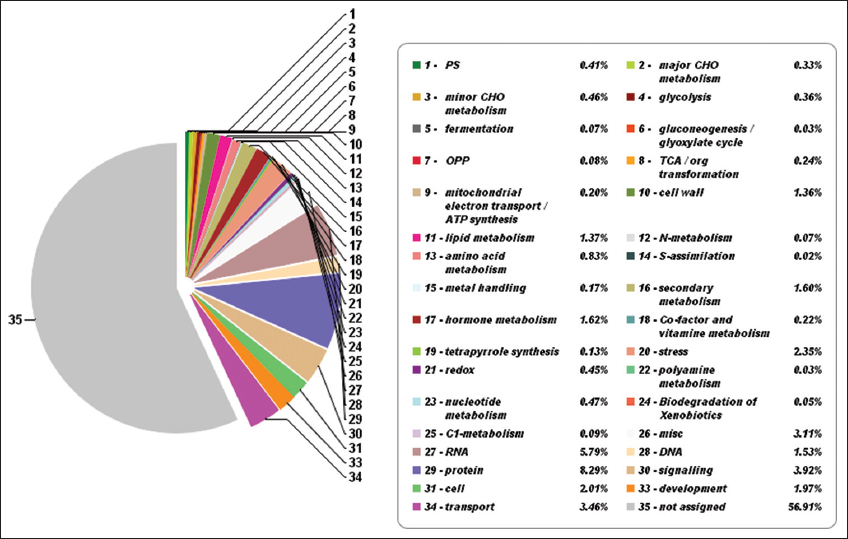 | Supplementary Figure 7: The pathway summary predicted with Mapman. This figure shows thirty-four metabolic categories along with the participating percentage of genes having a significant role in the metabolic pathways of lemon grass. Mapman analysis identified 43.09% of genes having a significant role in metabolic pathways. [Click here to view] |
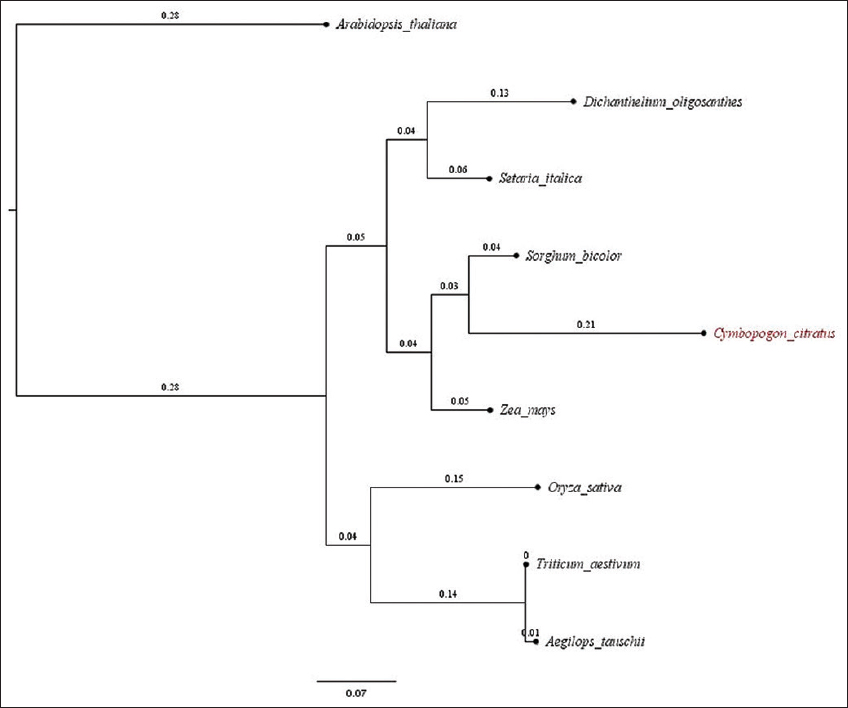 | Supplementary Figure 8: The linear tree generated between model plants and Cymbopogon citratus. This figure shows the linear tree generated based on orthology between Aegilops tauschii, Arabidopsis thaliana, Dichanthelium oligosanthes, Oryza sativa, Setaria italica, Sorghum bicolor, Triticum aestivu, Zea mays. The orthology data was generated using OrthoFinder version 2.3.11 for the above species. The orthology data was used to construct a linear tree based on the maximum likelihood method, and the tree was viewed in FigTree version 1.4.4. [Click here to view] |
 | Supplementary Figure 9: The chloroplast genome and annotation of lemon grass. This figure shows a circular chloroplast genome of 139,690 bps generated without gaps using GetOrganelle version 1.6.4. This figure also shows chloroplast genome annotation predicted using CPGAVAS2 version 1. [Click here to view] |
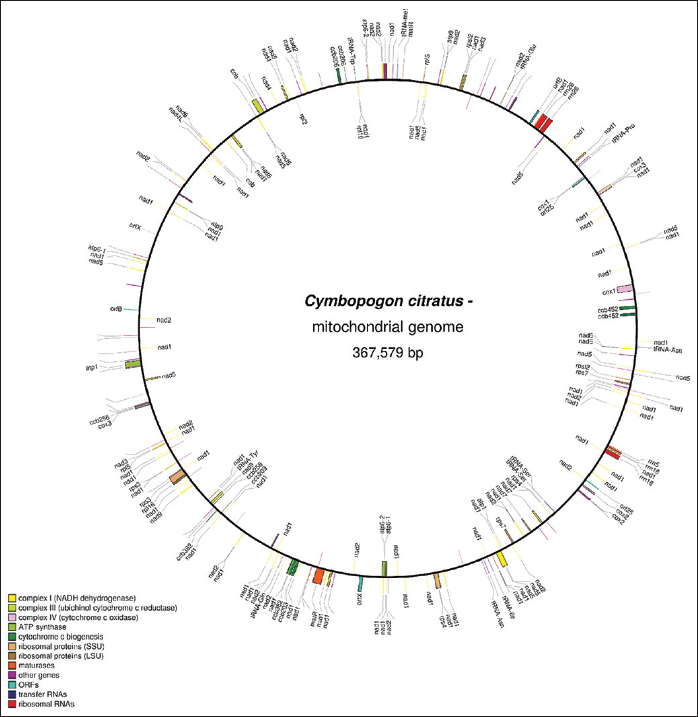 | Supplementary Figure 10: The mitochondrial genome and annotation of lemon grass. This figure shows a circular mitochondrial genome of 367,579 bps generated without any gap using GetOrganelle version 1.6.4. This figure also shows mitochondrial genome annotation predicted using AGORA version 1. [Click here to view] |
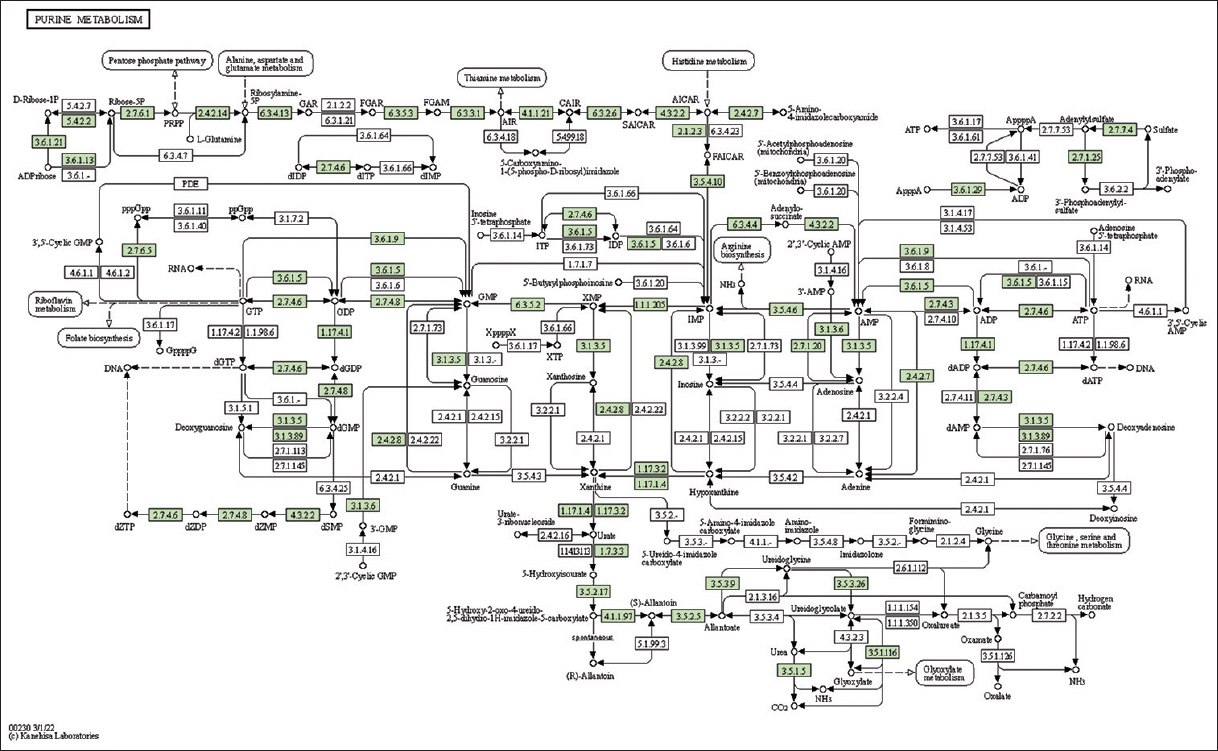 | Supplementary Figure 11: The genes associated with metabolites of purine metabolism. This figure shows 43 genes associated with metabolites of purine metabolism, and the genes were highlighted in the pathway. These genes are mapped onto the pathway and were retrieved from KAAS. [Click here to view] |
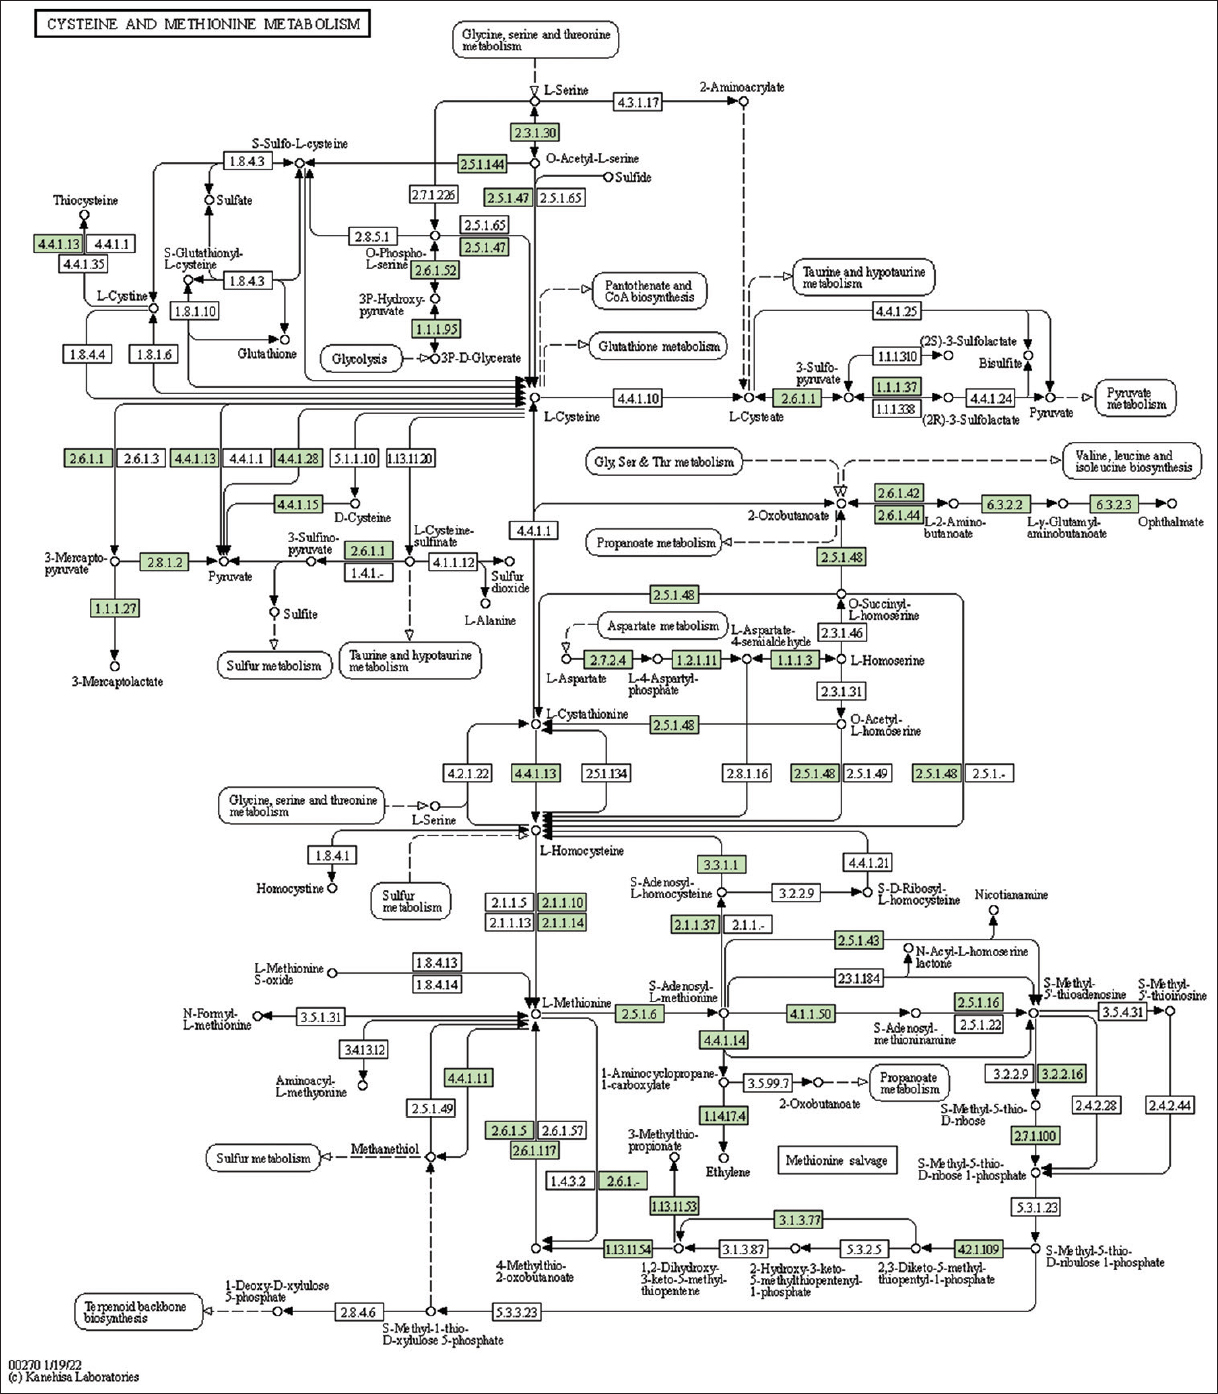 | Supplementary Figure 12: The genes associated with metabolites of cysteine and methionine metabolism. This figure shows 43 genes associated with cysteine and methionine metabolism, and the genes were highlighted in the pathway. These genes are mapped onto the pathway and were retrieved from KAAS. [Click here to view] |
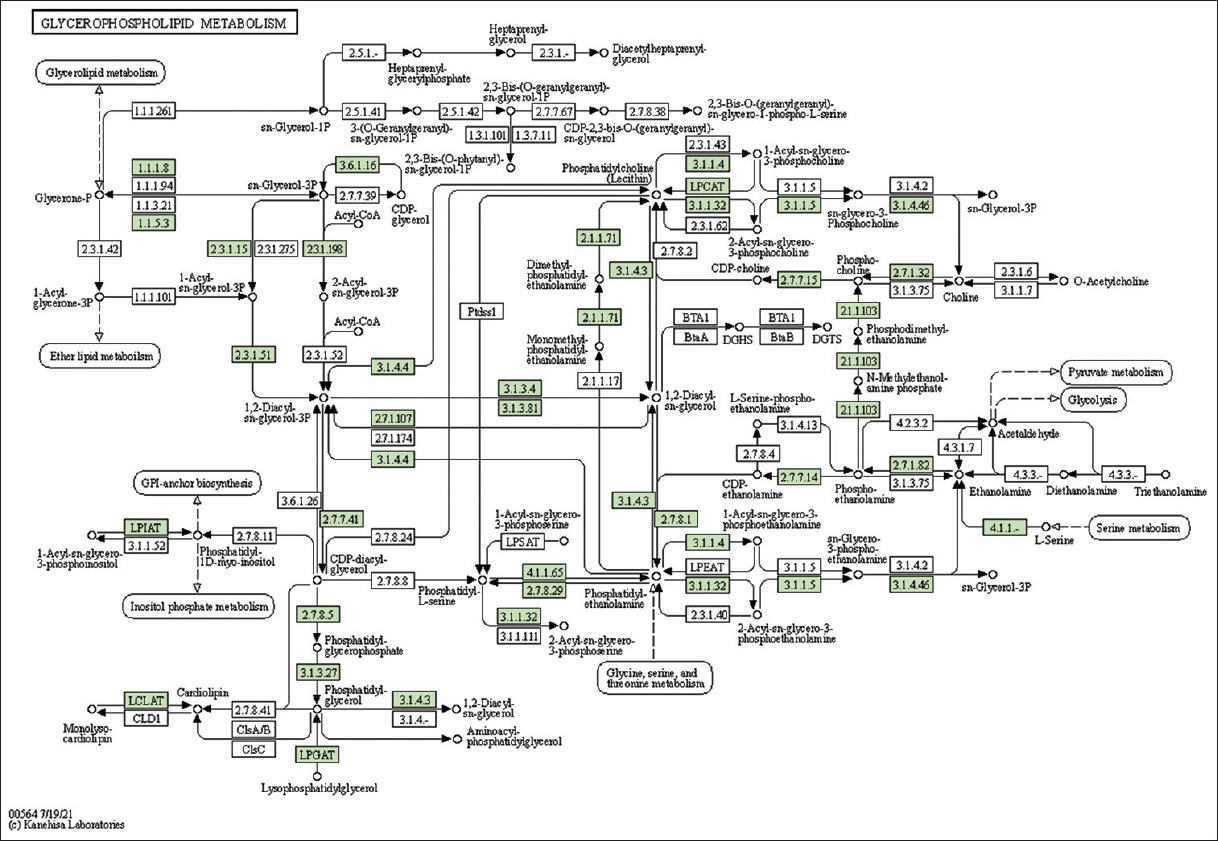 | Supplementary Figure 13: The genes associated with metabolites of glycerophospholipid metabolism. This figure shows 35 genes associated with glycerophospholipid metabolism, and the genes were highlighted in the pathway. These genes are mapped onto the pathway and were retrieved from KAAS. [Click here to view] |
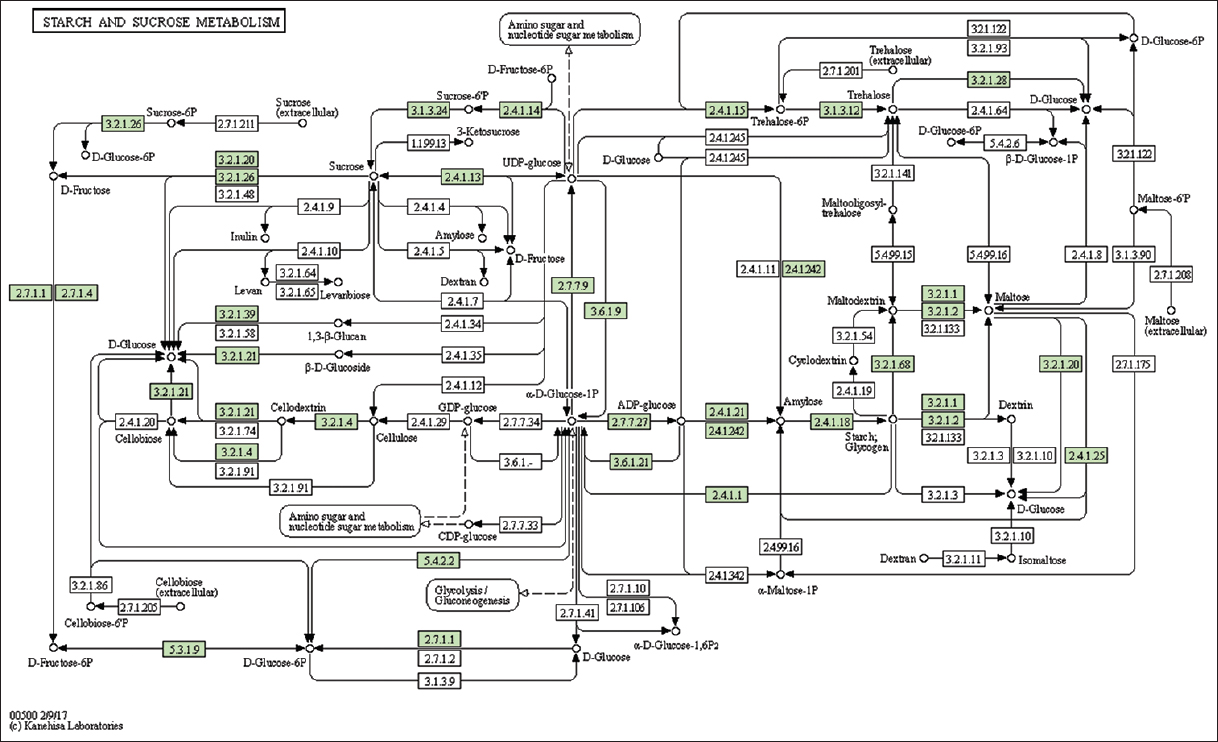 | Supplementary Figure 14: The genes associated with metabolites of starch and sucrose metabolism. This figure shows 31 genes associated with starch and sucrose metabolism, and the genes were highlighted in the pathway. These genes are mapped onto the pathway and were retrieved from KAAS. [Click here to view] |
 | Supplementary Figure 15: The genes associated with metabolites of pyrimidine metabolism. This figure shows 30 genes associated with pyrimidine metabolism, and the genes were highlighted in the pathway. These genes are mapped onto the pathway and were retrieved from KAAS. [Click here to view] |
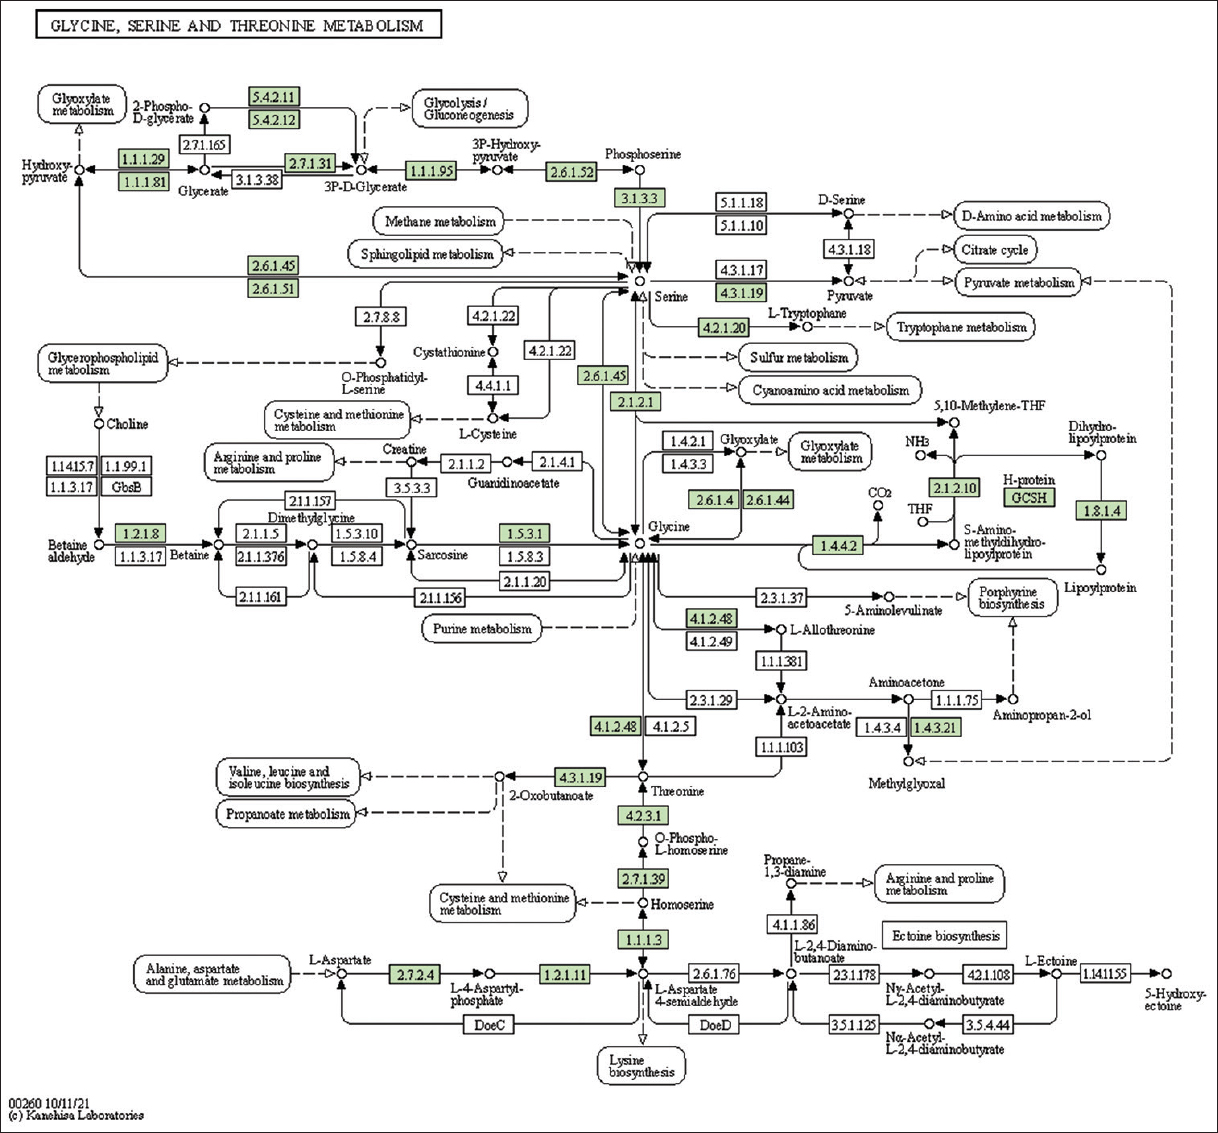 | Supplementary Figure 16: The genes associated with metabolites of glycine, serine, and threonine metabolism. This figure shows 29 genes associated with glycine, serine, and threonine metabolism, and the genes were highlighted in the pathway. These genes are mapped onto the pathway and were retrieved from KAAS. [Click here to view] |
 | Supplementary Figure 17: The genes associated with metabolites of glyoxylate and dicarboxylate metabolism. This figure shows 28 genes associated with glyoxylate and dicarboxylate metabolism, and the genes were highlighted in the pathway. These genes are mapped onto the pathway and were retrieved from KAAS. [Click here to view] |
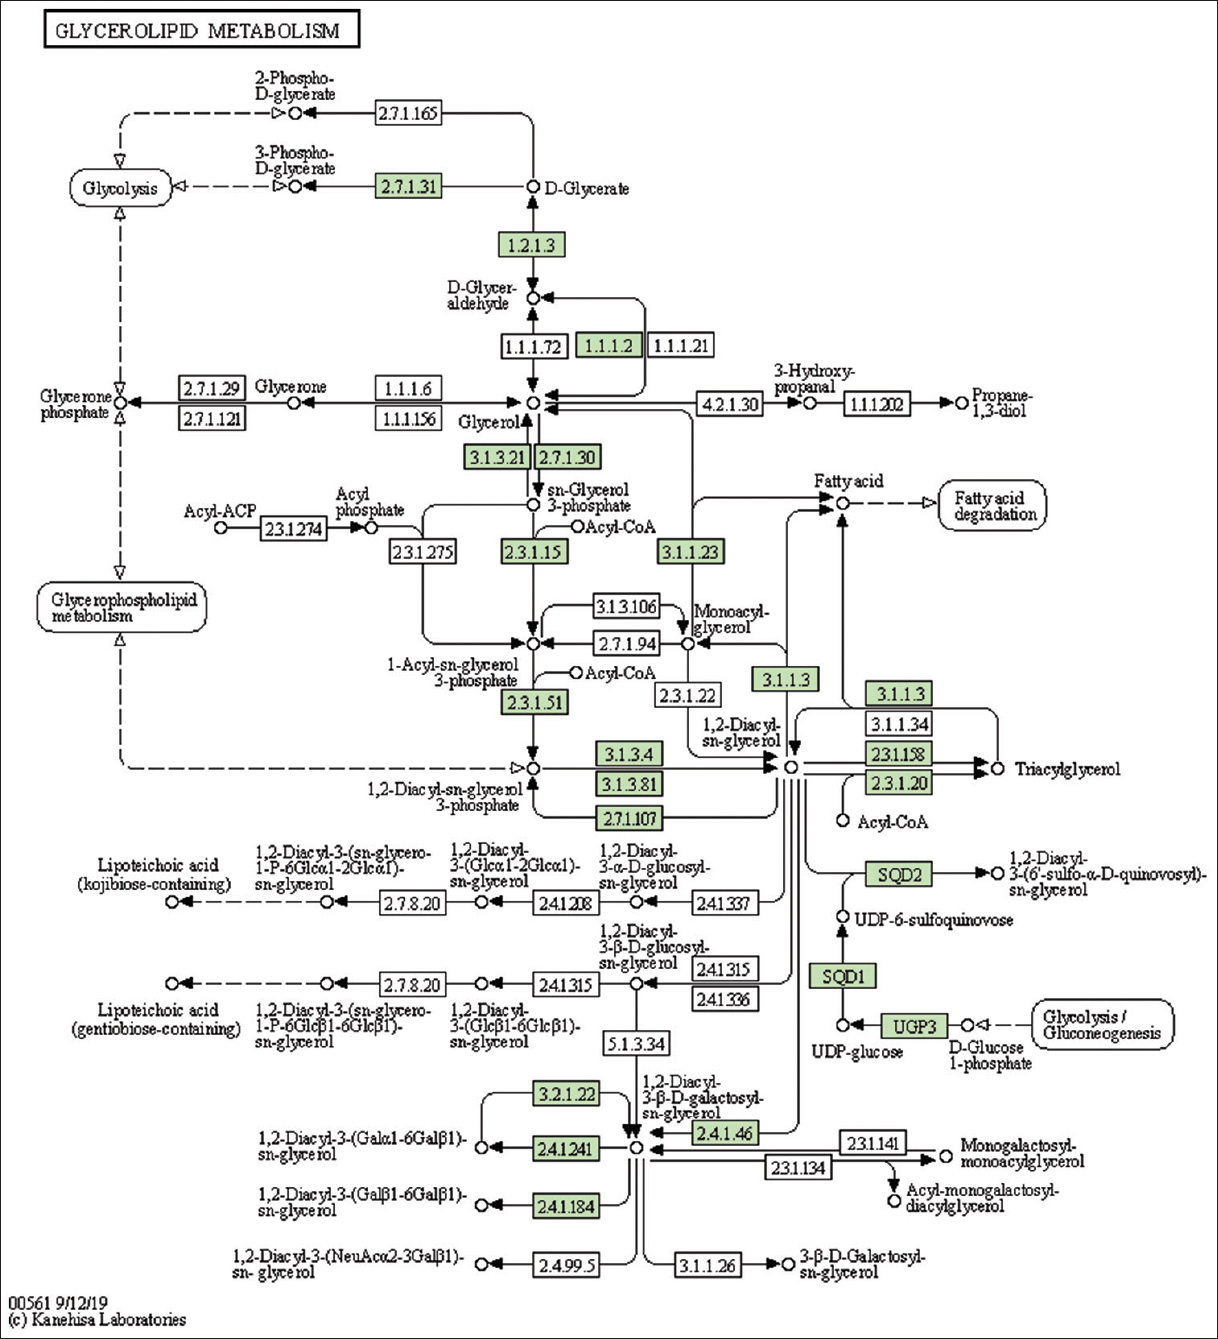 | Supplementary Figure 18: The genes associated with metabolites of glycerolipid metabolism. This figure shows 29 genes associated with glycerolipid metabolism, and the genes were highlighted in the pathway. These genes are mapped onto the pathway and were retrieved from KAAS. [Click here to view] |
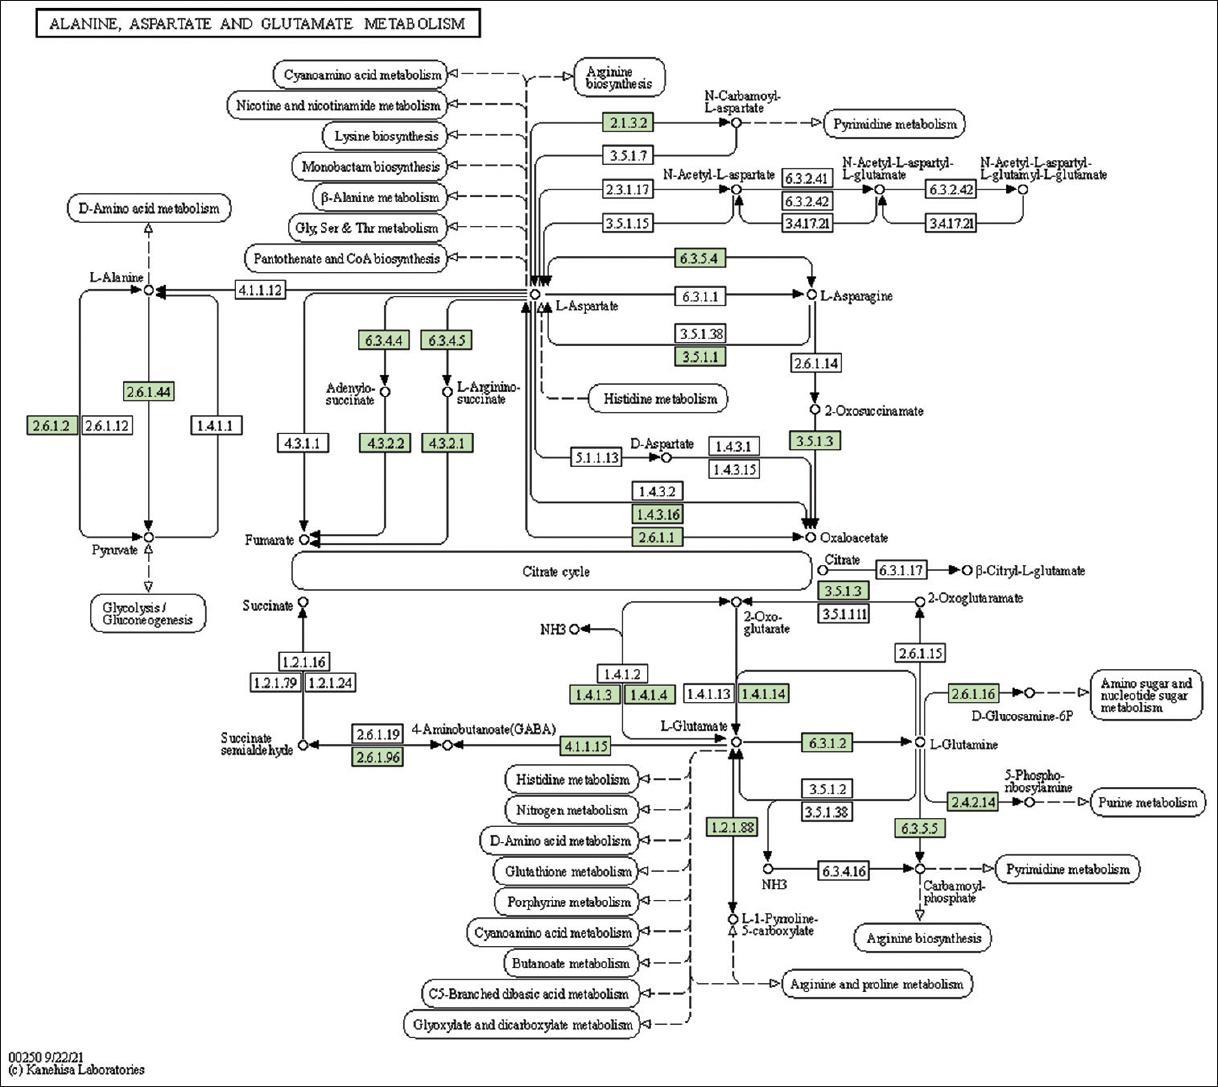 | Supplementary Figure 19: The genes associated with metabolites of alanine, aspartate and glutamate metabolism. This figure shows 27 genes associated with alanine, aspartate, and glutamate metabolism, and the genes were highlighted in the pathway. These genes are mapped onto the pathway and were retrieved from KAAS. [Click here to view] |
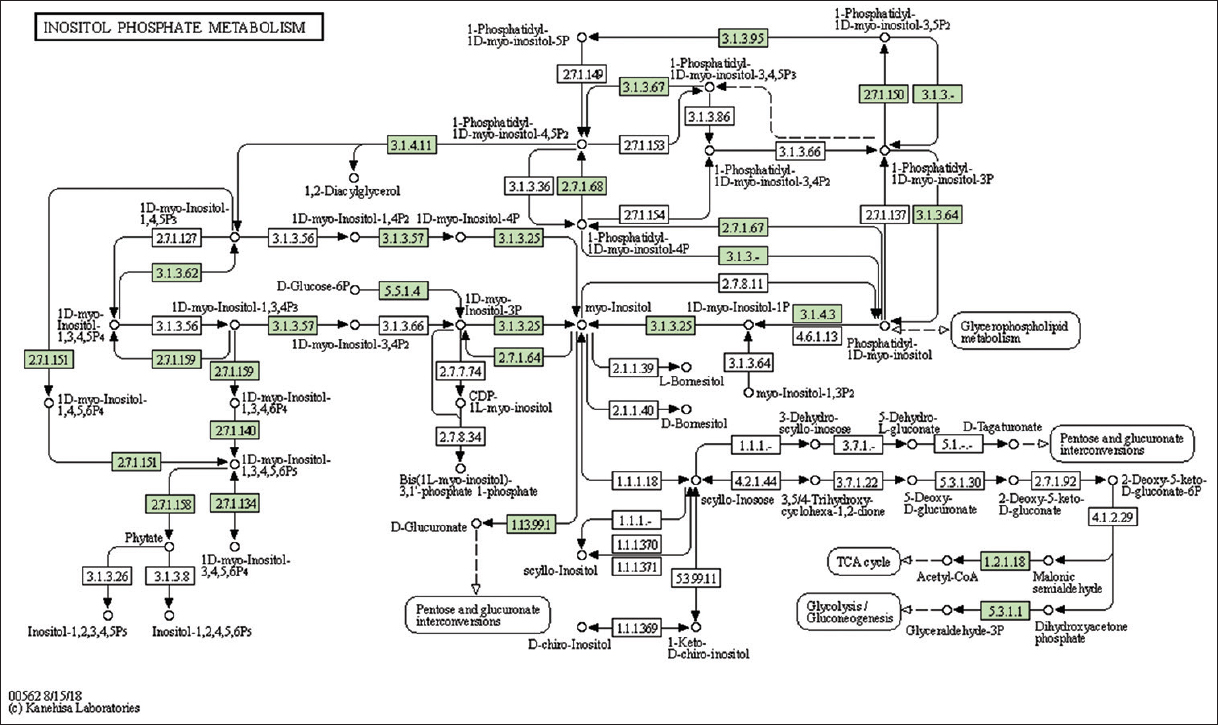 | Supplementary Figure 20: The genes associated with metabolites of inositol phosphate metabolism. This figure shows 23 genes associated with inositol phosphate metabolism, and the genes were highlighted in the pathway. These genes are mapped onto the pathway and were retrieved from KAAS. [Click here to view] |
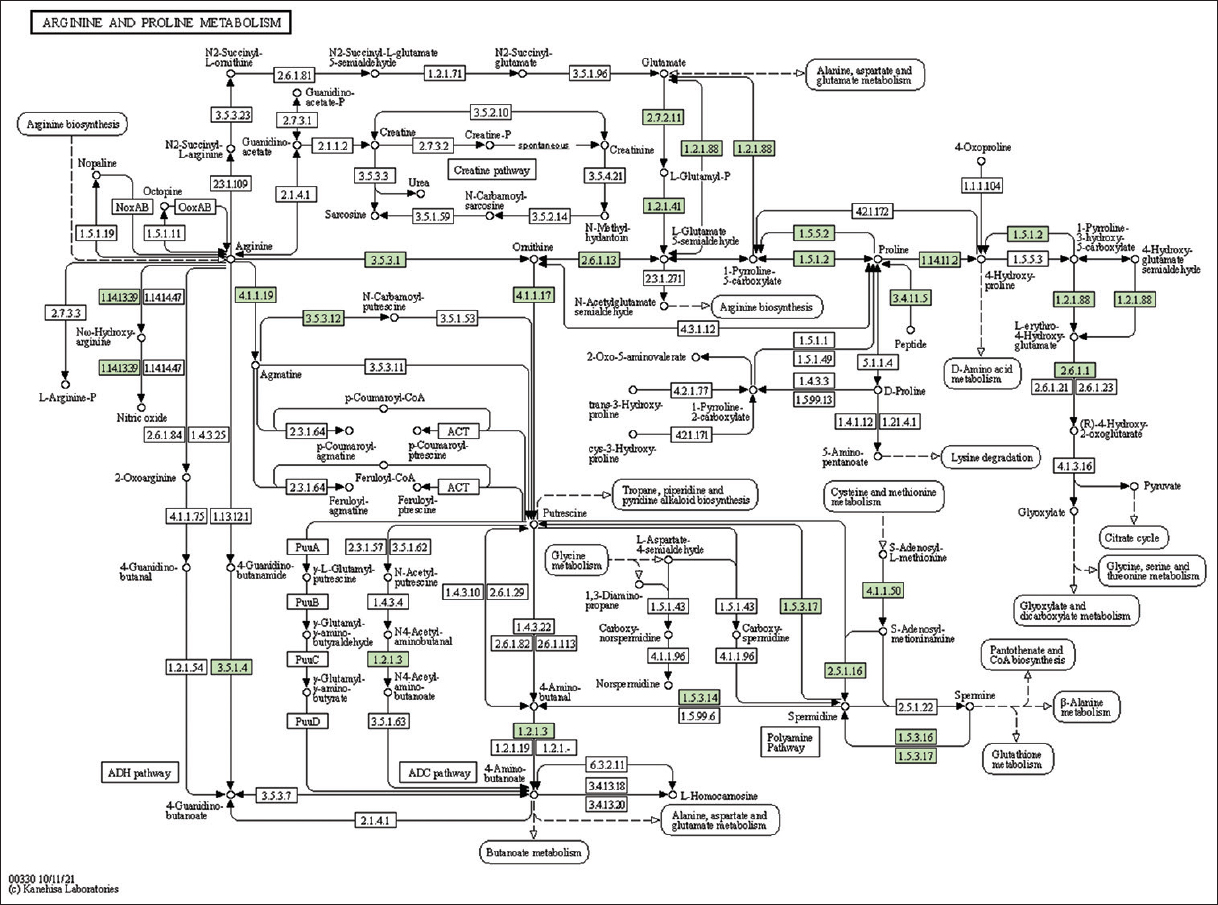 | Supplementary Figure 21: The genes associated with metabolites of arginine and proline metabolism. This figure shows 22 genes associated with arginine and proline metabolism, and the genes were highlighted in the pathway. These genes are mapped onto the pathway and were retrieved from KAAS. [Click here to view] |
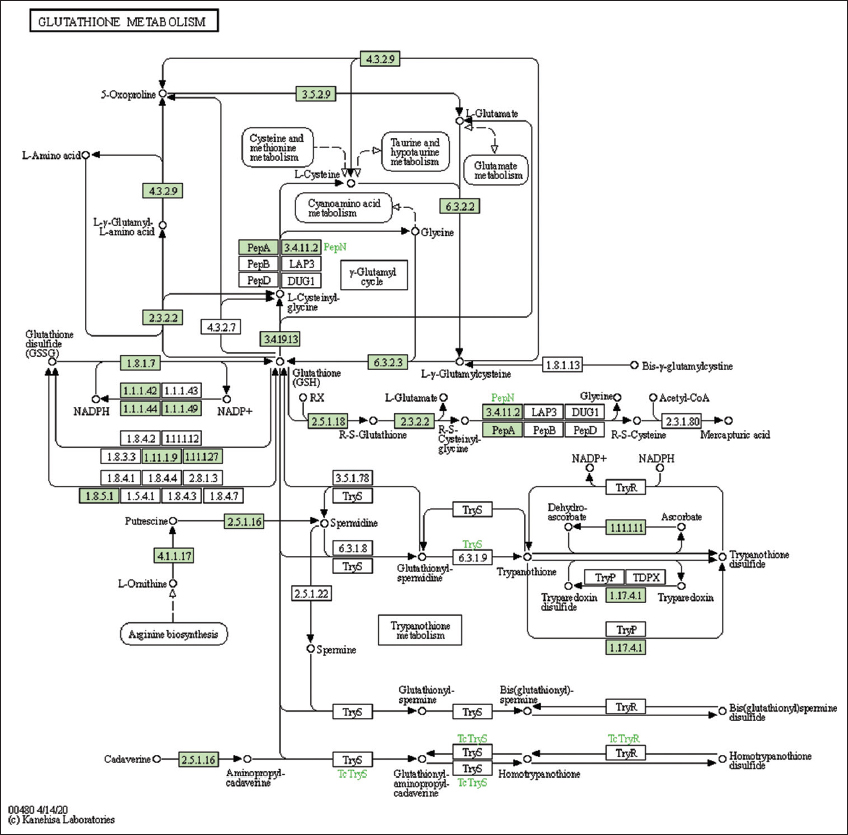 | Supplementary Figure 22: The genes associated with metabolites of glutathione metabolism. This figure shows 20 genes associated with glutathione metabolism, and the genes were highlighted in the pathway. These genes are mapped onto the pathway and were retrieved from KAAS. [Click here to view] |
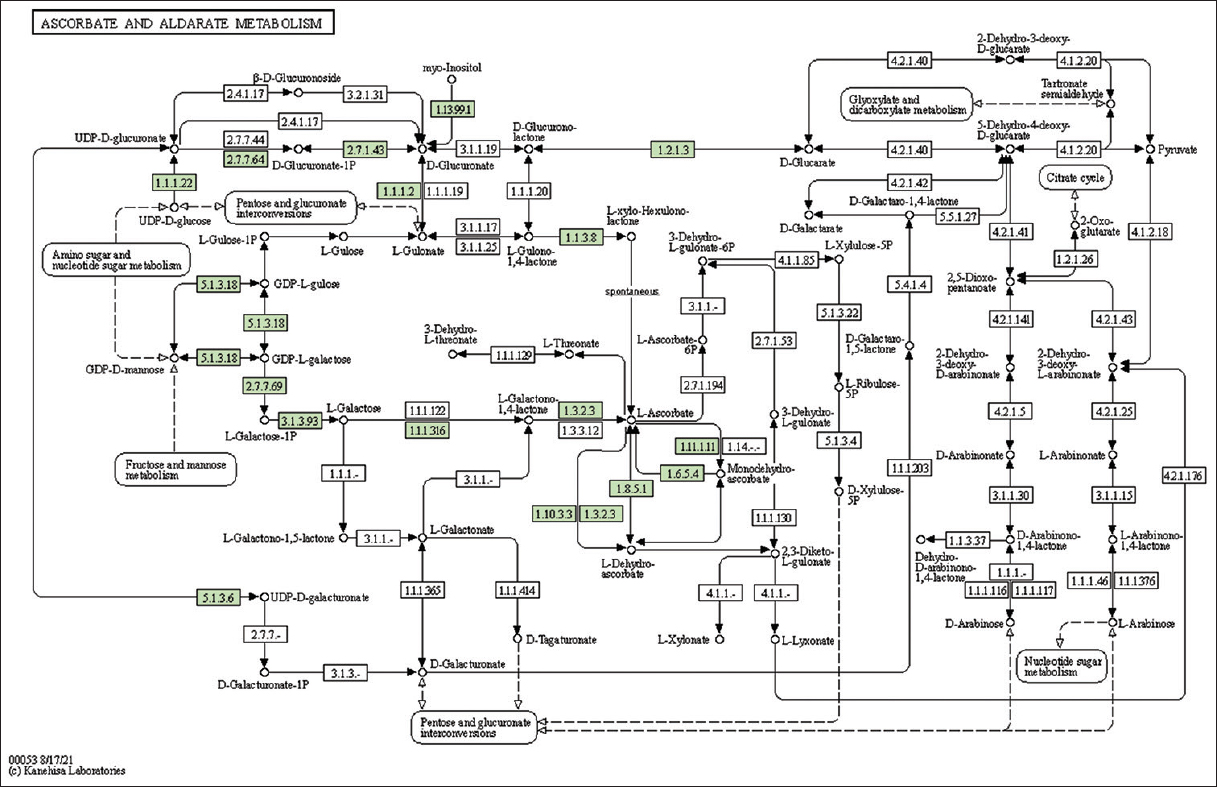 | Supplementary Figure 23: The genes associated with metabolites of ascorbate and aldarate metabolism. This figure shows 19 genes associated with ascorbate and aldarate metabolism, and the genes were highlighted in the pathway. These genes are mapped onto the pathway and were retrieved from KAAS. [Click here to view] |
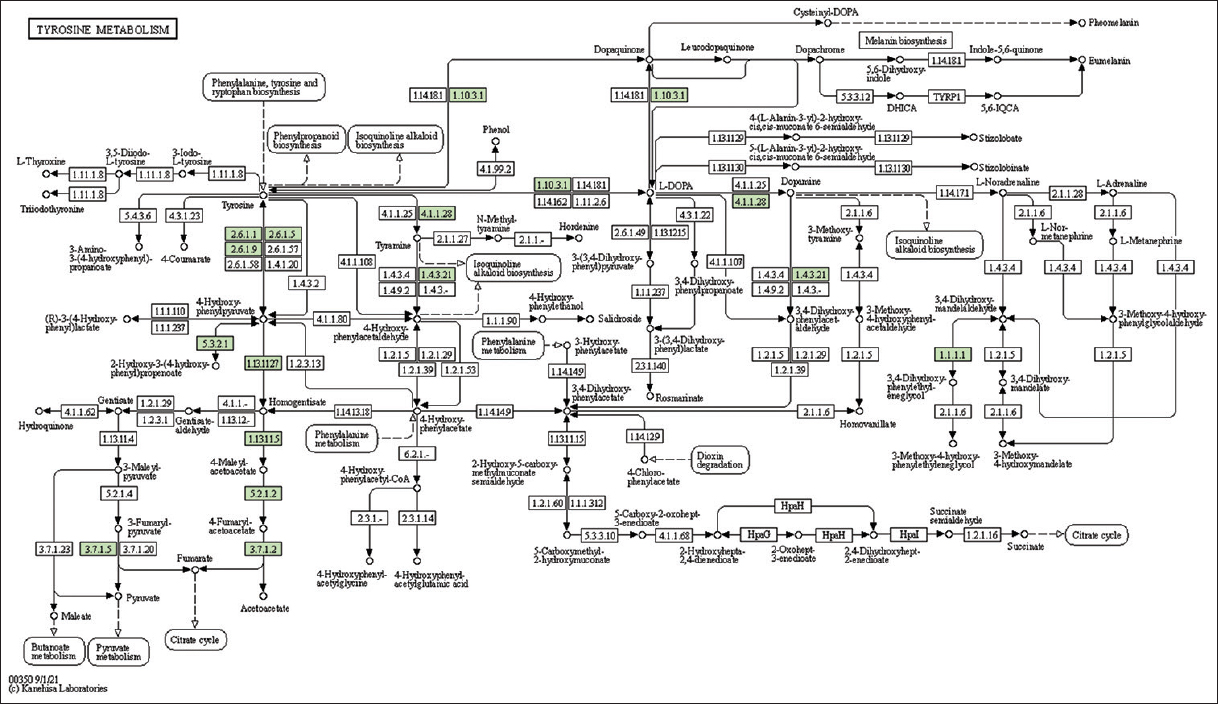 | Supplementary Figure 24: The genes associated with metabolites of tyrosine metabolism. This figure shows 18 genes associated with tyrosine metabolism, and the genes were highlighted in the pathway. These genes are mapped onto the pathway and were retrieved from KAAS. [Click here to view] |
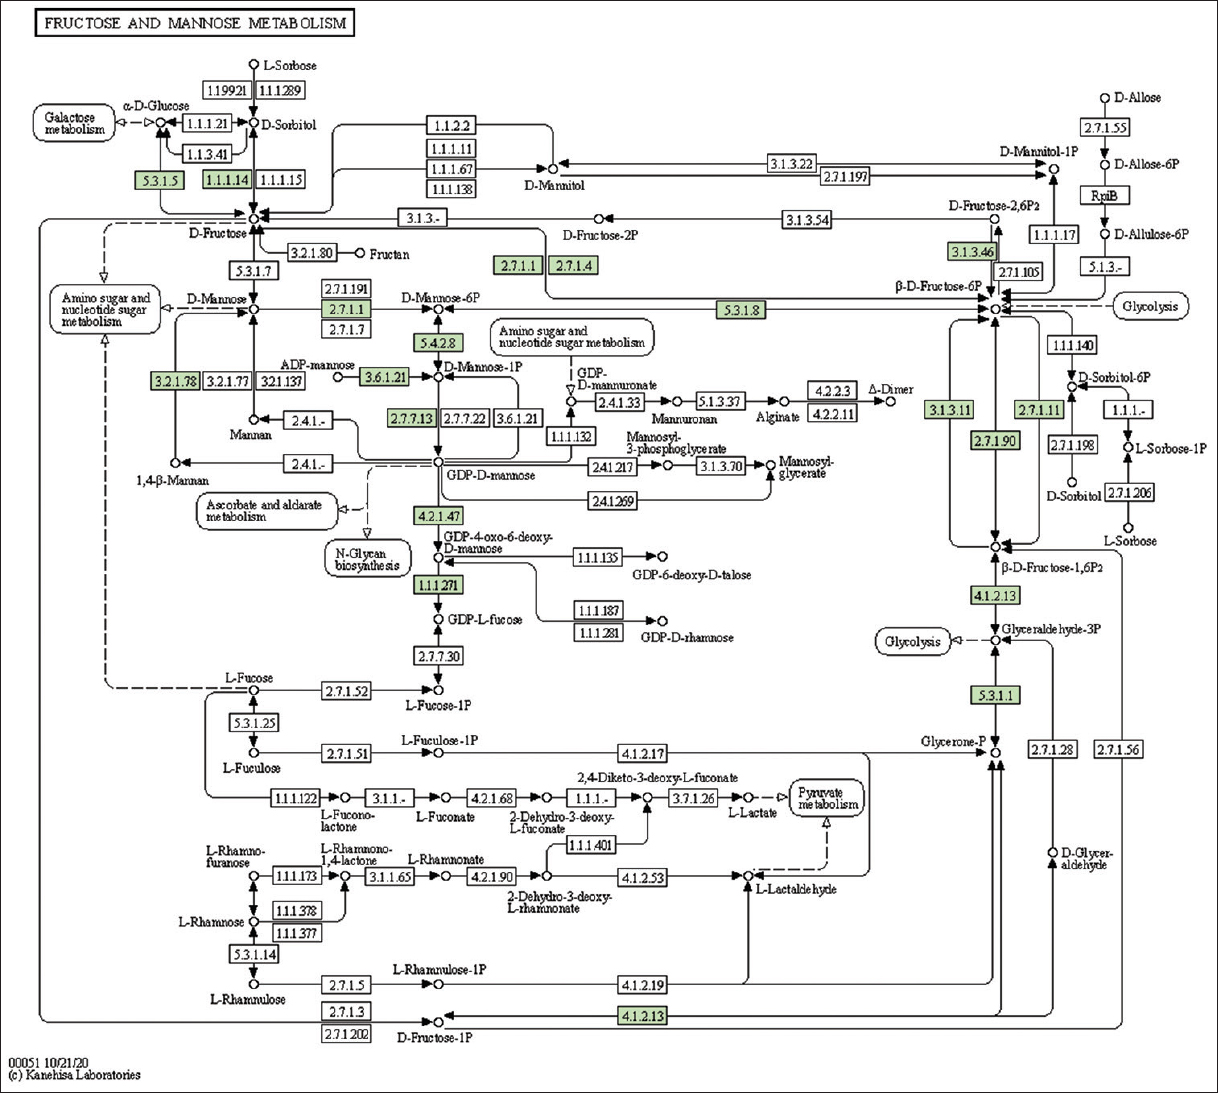 | Supplementary Figure 25: The genes associated with metabolites of fructose and mannose metabolism. This figure shows 17 genes associated with fructose and mannose metabolism, and the genes were highlighted in the pathway. These genes are mapped onto the pathway and were retrieved from KAAS. [Click here to view] |
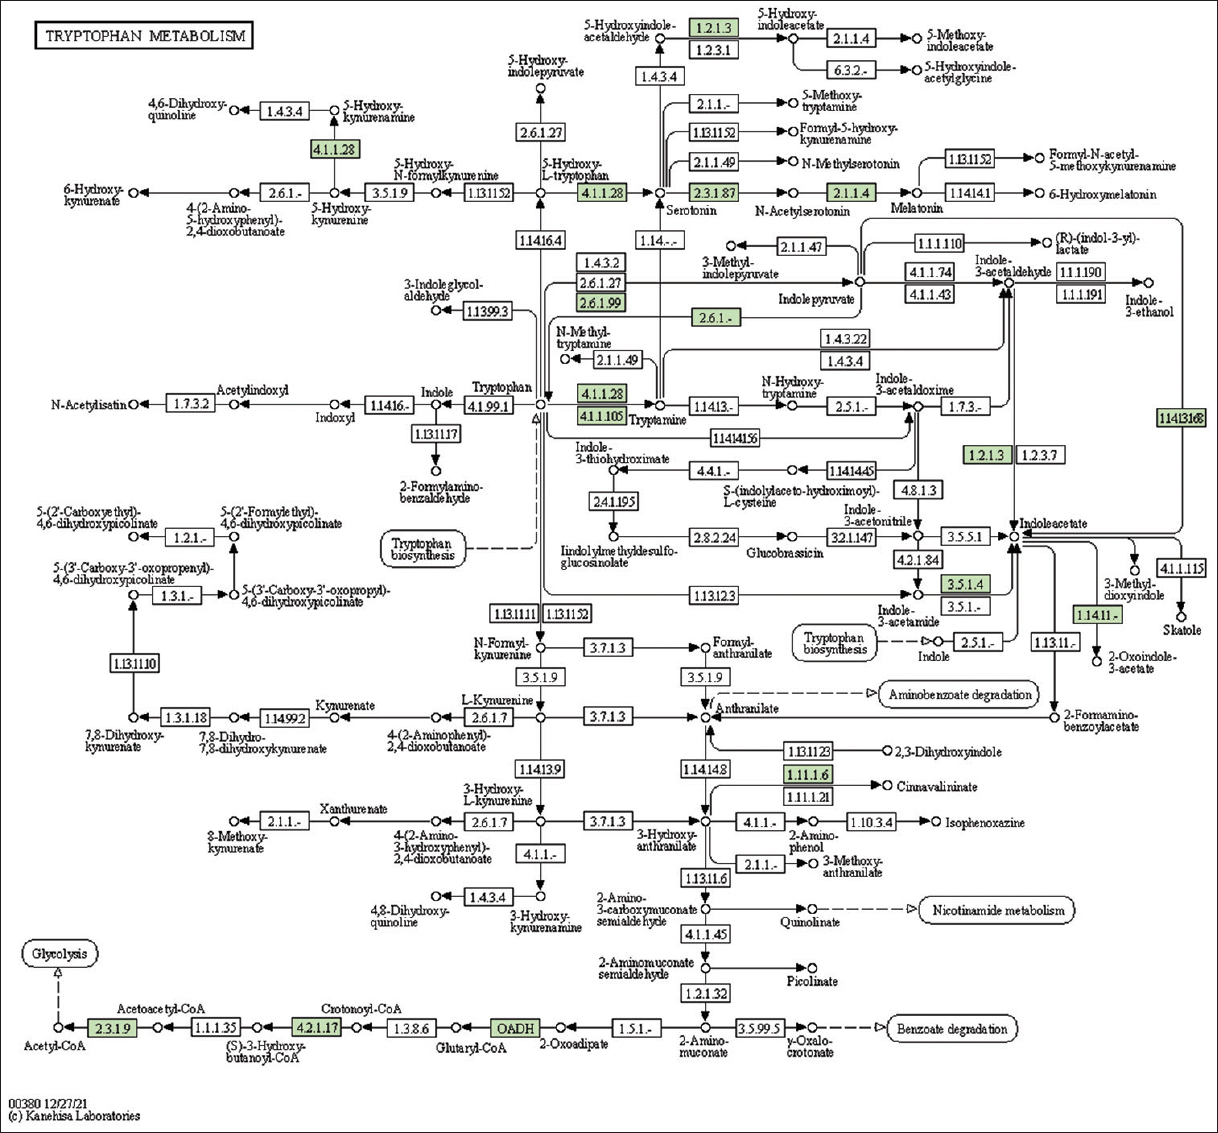 | Supplementary Figure 26: The genes associated with metabolites of tryptophan metabolism. This figure shows 15 genes associated with tryptophan metabolism, and the genes were highlighted in the pathway. These genes are mapped onto the pathway and were retrieved from KAAS. [Click here to view] |
 | Supplementary Figure 27: The genes associated with metabolites of beta-alanine metabolism. This figure shows 15 genes associated with beta-alanine metabolism, and the genes were highlighted in the pathway. These genes are mapped onto the pathway and were retrieved from KAAS. [Click here to view] |
 | Supplementary Figure 28: The genes associated with alpha-linolenic acid metabolism metabolites. This figure shows 15 genes associated with alpha-linolenic acid metabolism, and the genes were highlighted in the pathway. These genes are mapped onto the pathway and were retrieved from KAAS. [Click here to view] |
 | Supplementary Figure 29: The genes associated with metabolites of sphingolipid metabolism. This figure shows 15 genes associated with sphingolipid metabolism, and the genes were highlighted in the pathway. These genes are mapped onto the pathway and were retrieved from KAAS. [Click here to view] |
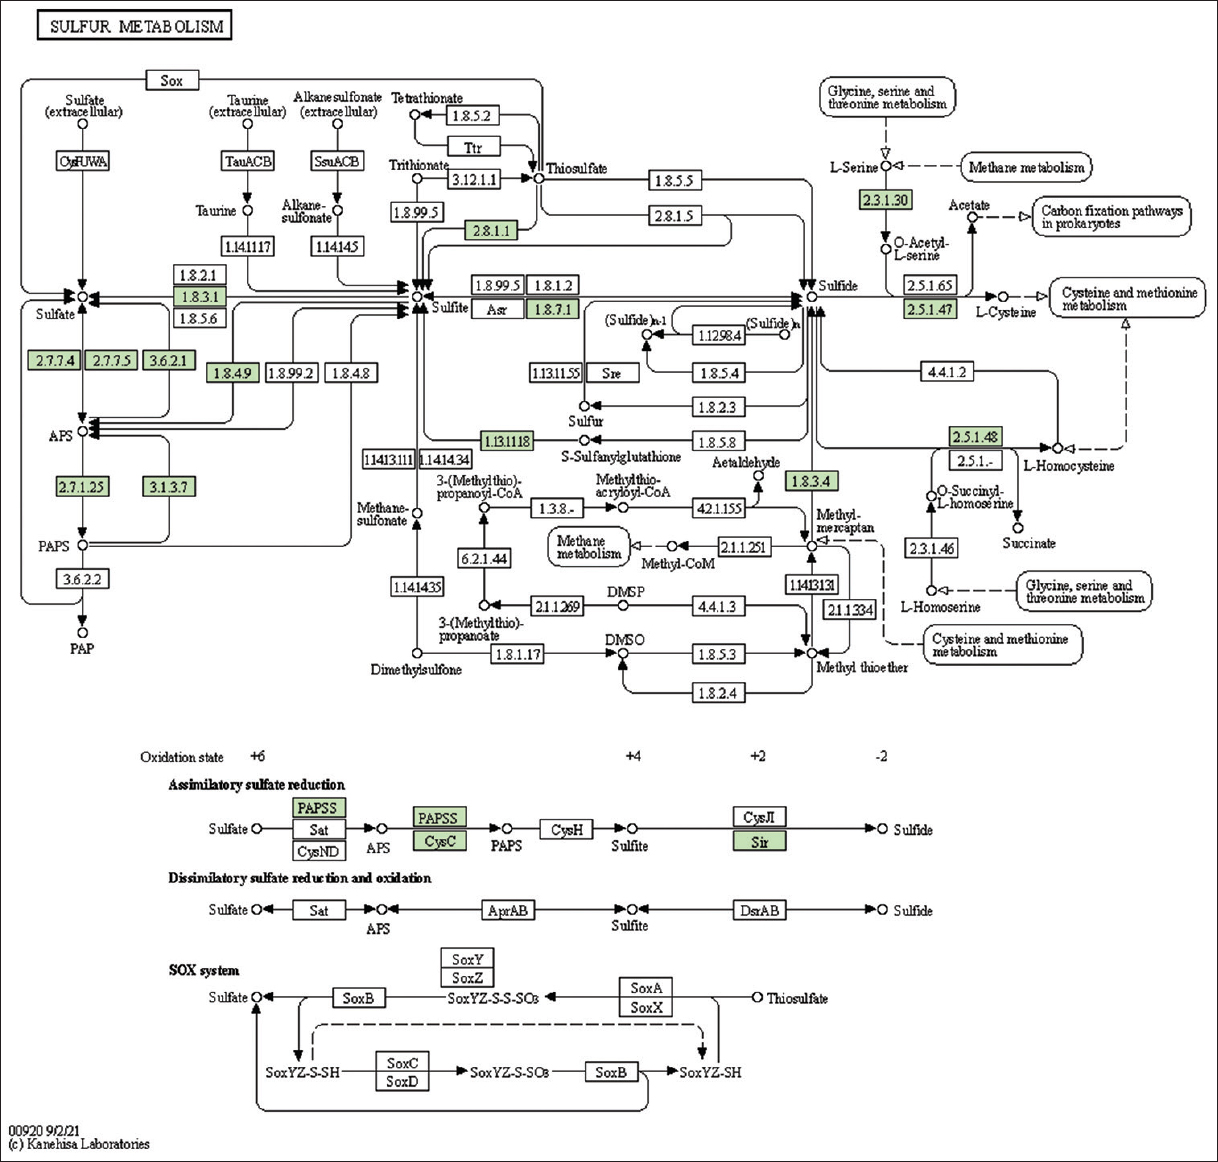 | Supplementary Figure 30: The genes associated with metabolites of sulfur metabolism. This figure shows 15 genes associated with sulfur metabolism, and the genes were highlighted in the pathway. These genes are mapped onto the pathway and were retrieved from KAAS. [Click here to view] |
 | Supplementary Figure 31: The genes associated with metabolites of methane metabolism. This figure shows 16 genes associated with methane metabolism, and the genes were highlighted in the pathway. These genes are mapped onto the pathway and were retrieved from KAAS. [Click here to view] |
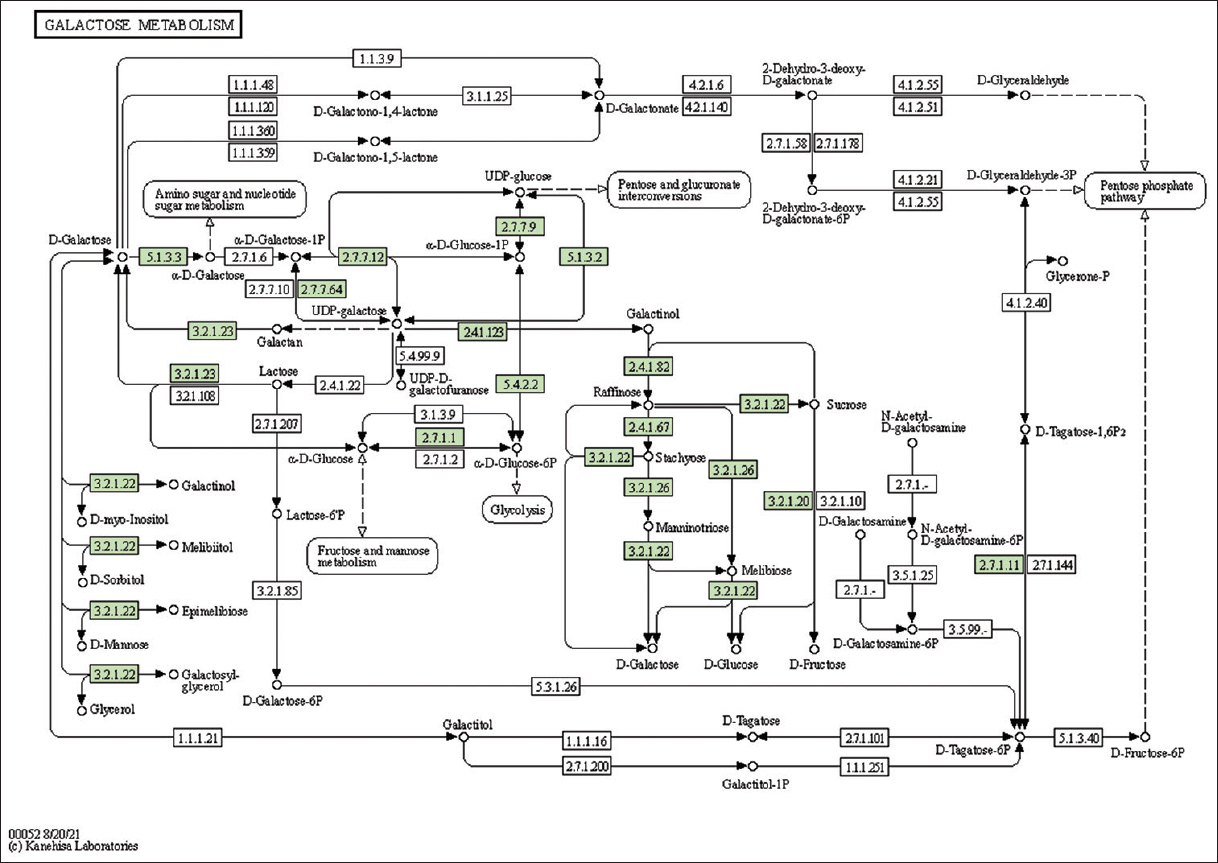 | Supplementary Figure 32: The genes associated with metabolites of galactose metabolism. This figure shows 16 genes associated with galactose metabolism, and the genes were highlighted in the pathway. These genes are mapped onto the pathway and were retrieved from KAAS. [Click here to view] |
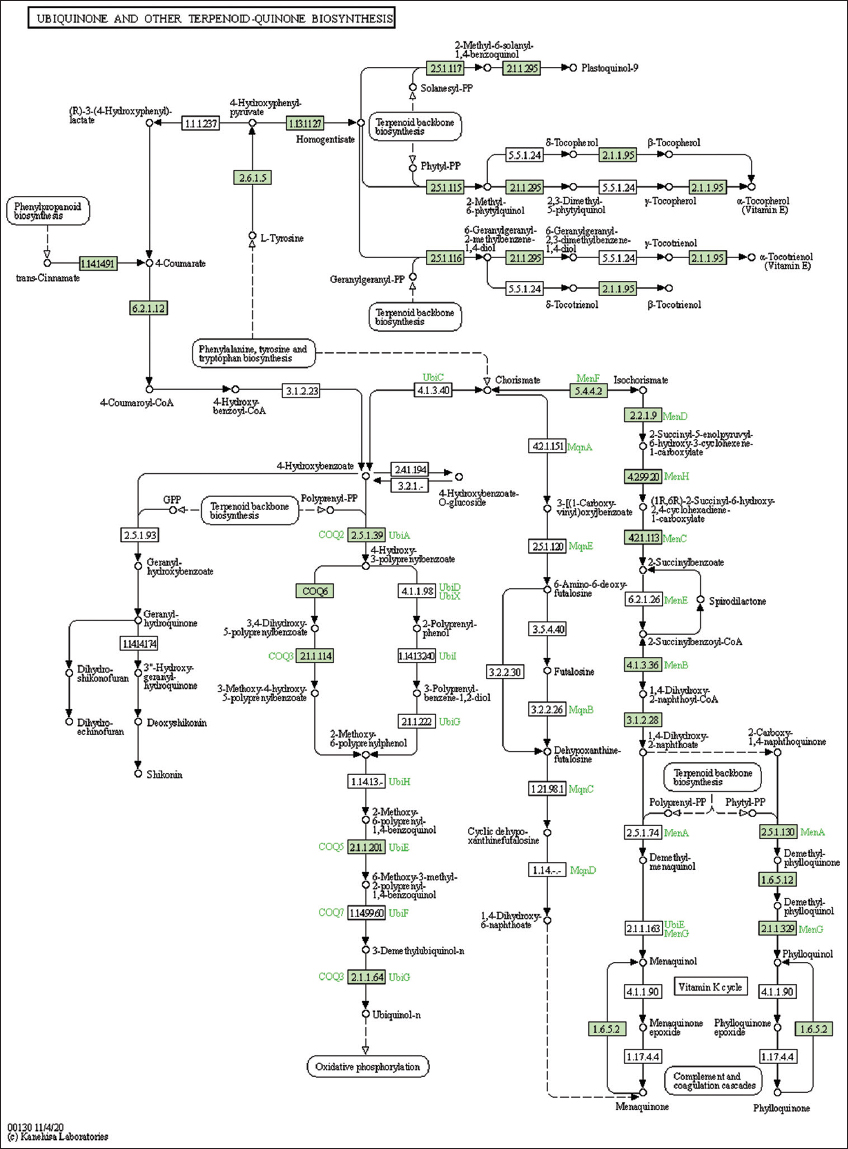 | Supplementary Figure 33: The genes associated with metabolites of ubiquinone and other terpenoid-quinone biosynthesis metabolism. This figure shows 20 genes associated with ubiquinone and other terpenoid-quinone biosynthesis metabolism, and the genes were highlighted in the pathway. These genes are mapped onto the pathway and were retrieved from KAAS. [Click here to view] |
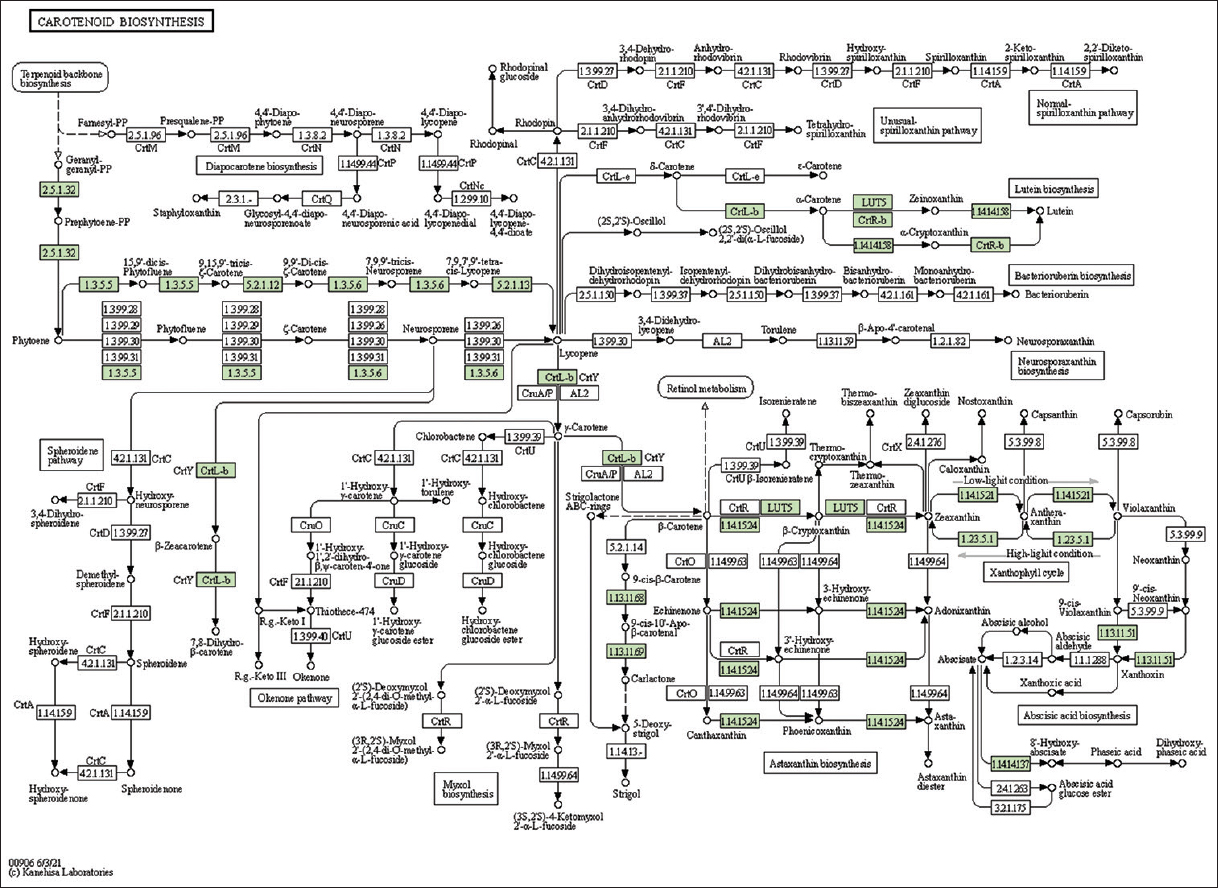 | Supplementary Figure 34: The genes associated with metabolites of carotenoid biosynthesis metabolism. This figure shows 15 genes associated with carotenoid biosynthesis metabolism, and the genes were highlighted in the pathway. These genes are mapped onto the pathway and were retrieved from KAAS. [Click here to view] |
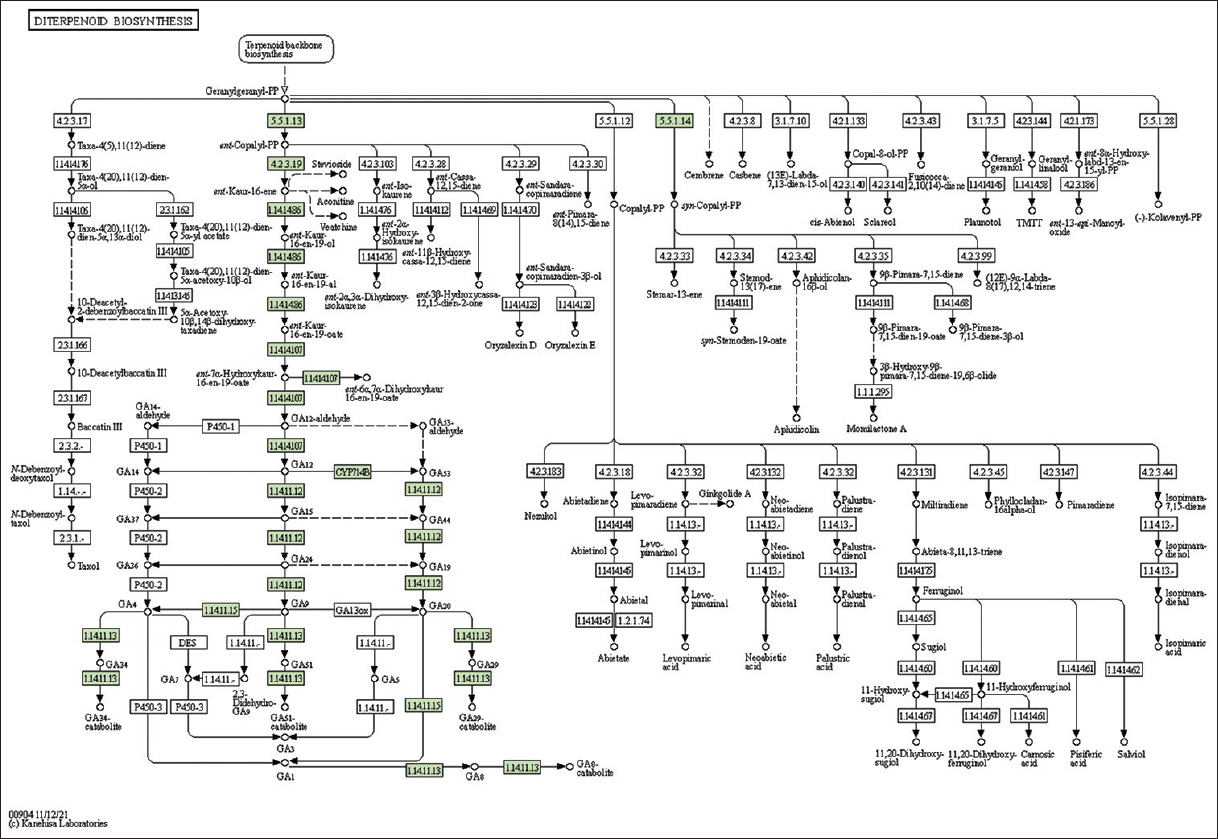 | Supplementary Figure 35: The genes associated with metabolites of diterpenoid biosynthesis metabolism. This figure shows nine genes associated with diterpenoid biosynthesis metabolism, and the genes were highlighted in the pathway. These genes are mapped onto the pathway and were retrieved from KAAS. [Click here to view] |
 | Supplementary Figure 36: The genes associated with metabolites of phenylpropanoid biosynthesis metabolism. This figure shows 15 genes associated with phenylpropanoid biosynthesis metabolism, and the genes were highlighted in the pathway. These genes are mapped onto the pathway and were retrieved from KAAS. [Click here to view] |
 | Supplementary Figure 37: The genes associated with metabolites of flavonoid biosynthesis metabolism. This figure shows 13 genes associated with flavonoid biosynthesis metabolism, and the genes were highlighted in the pathway. These genes are mapped onto the pathway and were retrieved from KAAS. [Click here to view] |
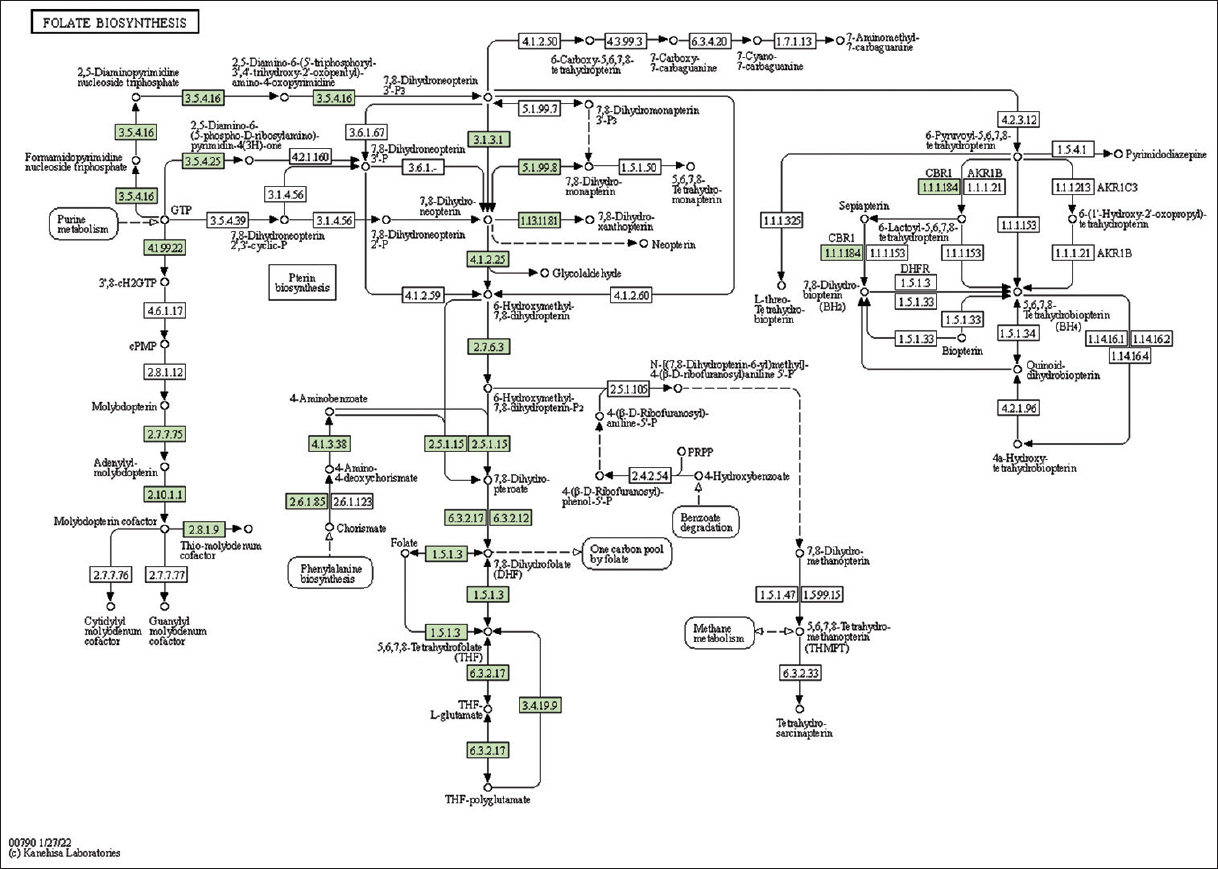 | Supplementary Figure 38: The genes associated with metabolites of folate metabolism. This figure shows 15 genes associated with folate metabolism, and the genes were highlighted in the pathway. These genes are mapped onto the pathway and were retrieved from KAAS. [Click here to view] |
 | Supplementary Figure 39: The genes associated with metabolites of isoquinoline alkaloid biosynthesis metabolism. This figure shows eight genes associated with isoquinoline alkaloid biosynthesis metabolism. The genes were highlighted in the pathway. These genes are mapped onto the pathway and were retrieved from KAAS. [Click here to view] |
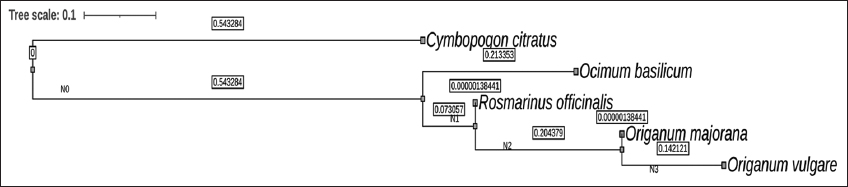 | Supplementary Figure 40: The phylogenetic tree between five economically important culinary herbs. This figure shows a phylogenetic relationship between Cymbopogon citratus and four economically important culinary herbs, namely, sweet basil (Ocimum basilicum L.), sweet marjoram (Origanum majorana L.), oregano (Origanum vulgare L.), and rosemary (Rosmarinus officinalis L.). The orthology data was generated using OrthoFinder version 2.3.11 for the above species. The orthology data was used to construct a linear tree based on maximum likelihood method and the tree was viewed in FigTree version 1.4.4. [Click here to view] |
Supplementary Table 1: The summary of BUSCO score parameters to evaluate the completeness of lemon grass.
| S. No | BUSCO Statistics | Count | Percentage |
|---|---|---|---|
| 1 | Complete BUSCOs (C) | 259 | 60.90% |
| 2 | Complete and single-copy BUSCOs (S) | 250 | 58.80% |
| 3 | Complete and duplicated BUSCOs (D) | 9 | 2.10% |
| 4 | Fragmented BUSCOs (F) | 91 | 21.40% |
| 5 | Missing BUSCOs (M) | 75 | 17.7% |
| 6 | Total BUSCO groups searched | 425 | 100.00% |
Supplementary Table 2: The summary of repeats predicted in the genome of lemon grass.
| S.No. | Type of repeats | Number of repeats | Length of repeats | Elements occupied(%) |
|---|---|---|---|---|
| 1 | SINEs | 665 | 72070 bp | 0.02% |
| 2 | LINEs | 26231 | 13279888 bp | 3.64% |
| 3 | LTR elements | 51540 | 36376114 bp | 9.98% |
| 4 | DNA elements | 12288 | 5427562 bp | 1.49% |
| 5 | Unclassified | 366513 | 92614638 bp | 25.41% |
| 6 | Total interspersed repeats | 147770272 bp | 40.55% | |
| 7 | Small RNA | 355 | 80194 bp | 0.02% |
| 8 | Satellites | 229 | 159256 bp | 0.04% |
| 9 | Simple repeats | 63921 | 2647666 bp | 0.73% |
| 10 | Low complexity | 7157 | 352141 bp | 0.10% |
Supplementary Table 3: The summary of primers designed successfully for SSRs repeats in lemon grass
| S. No. | Type of simple repeats | Count of simple repeat | Count of primers designed |
|---|---|---|---|
| 1 | Mononucleotides (p1) | 50,779 | 47,048 |
| 2 | Dinucleotides (p2) | 10,874 | 9,321 |
| 3 | trinucleotides (p3) | 11,942 | 10,901 |
| 4 | Tetranucleotides (p4) | 1,515 | 1,378 |
| 5 | Pentanucleotides (p5) | 461 | 414 |
| 6 | Hexanucleotides (p6) | 451 | 385 |
| 7 | Complex type of repeats ( c) | 4,784 | 4,241 |
Supplementary Table 4: The summary of orthogroups and genes in lemon grass as revealed by the orthologous analysis
| S.No. | Summary of orthogroups and genes | Counts |
|---|---|---|
| 1 | Number of genes | 562517 |
| 2 | Number of genes in orthogroups | 447596 |
| 3 | Number of unassigned genes | 114921 |
| 4 | Percentage of genes in orthogroups | 79.6 |
| 5 | Percentage of unassigned genes | 20.4 |
| 6 | Number of orthogroups | 26100 |
| 7 | Number of species-specific orthogroups | 714 |
| 8 | Number of genes in species-specific orthogroups | 4138 |
| 9 | Percentage of genes in species-specific orthogroups | 0.7 |
| 10 | Mean orthogroup size | 17.1 |
| 11 | Median orthogroup size | 13 |
| 12 | G50 (assigned genes) | 26 |
| 13 | G50 (all genes) | 20 |
| 14 | O50 (assigned genes) | 4770 |
| 15 | O50 (all genes) | 7256 |
| 16 | Number of orthogroups with all species present | 7898 |
| 17 | Number of single-copy orthogroups | 8 |
Supplementary Table 5: Identification of genes from lemon grass taking part in terpene synthases
| S. No. | GeneID | Annotation | GeneID_short | Gene name | TPS family | Swiss Prot Entry | SwissProt gene names | Gene ID in lemongrass |
|---|---|---|---|---|---|---|---|---|
| 1 | AT2G24210.1 | terpene synthase 10 | AT2G24210 | TPS10 | TPSb | Q9ZUH4 | TPS10 At2g24210 F27D4.12 | g38217.t1 |
| 2 | AT3G25810.1 | Terpenoid cyclases/Protein prenyltransferases superfamily protein | AT3G25810 | TPS24 | TPSb | Q9LRZ6 | TPS24 At3g25810 K13N2.7 | g34393.t1 |
| 3 | AT3G25820.1 | terpene synthase-like sequence-1,8-cineole | AT3G25820 | TPS27; TPS-CIN1 | TPSb | P0DI76 | TPS27 TPS-CIN1 At3g25820 K13N2.19 | g34393.t1 |
| 4 | AT3G25830.1 | terpene synthase-like sequence-1,8-cineole | AT3G25830 | TPS23; TPS-CIN2 | TPSb | P0DI77 | TPS23 TPS-CIN2 At3g25830 K9I22.3 | g34393.t1 |
| 5 | AT4G16730.1 | terpene synthase 02 | AT4G16730 | TPS02 | TPSb | P0CJ42 | TPS02 At4g16730 dl4390w FCAALL.15 | g32271.t1 |
| 6 | AT4G16740.1 | terpene synthase 03 | AT4G16740 | TPS03 | TPSb | A4FVP2 | TPS03 At4g16740 dl4395w FCAALL.18 | g34393.t1 |
| 7 | AT5G23960.1 | terpene synthase 21 | AT5G23960 | TPS21; PUP8 | TPSa | Q84UU4 | TPS21 PUP8 At5g23960 MZF18.16 | g3033.t1 |
| 8 | AT4G02780.1 | Terpenoid cyclases/Protein prenyltransferases superfamily protein | AT4G02780 | TPS31; TPSGA1; GA1; CPS; CPS1 | TPSc | Q38802 | GA1 ABC33 CPS CPS1 TPSGA1 At4g02780 T5J8.9 | g17067.t1 |
| 9 | AT1G79460.1 | Terpenoid cyclases/Protein prenyltransferases superfamily protein | AT1G79460 | TPS32; TPSGA2; GA2; KS; KS1 | TPSe/f | Q9SAK2 | GA2 KS KS1 TPSGA2 At1g79460 T8K14.12 | g12107.t1 |
| 10 | AT1G61120.1 | terpene synthase 04 | AT1G61120 | TPS04; GES; LIS | TPSe/f | Q93YV0 | GES LIS TPS04 At1g61120 F11P17.15 | g12107.t1 |
| 11 | AT1G61680.1 | terpene synthase 14 | AT1G61680 | TPS14 | TPSg | Q84UV0 | TPS14 At1g61680 T13M11.3 | g9415.t1 |
| 12 | AT1G66020.1 | Terpenoid cyclases/Protein prenyltransferases superfamily protein | AT1G66020 | TPS26 | TPSa | Q9C8E3 | TPS26 At1g66020 F15E12.3 | g3033.t1 |
| 13 | AT3G29190.1 | Terpenoid cyclases/Protein prenyltransferases superfamily protein | AT3G29190 | TPS15 | TPSa | Q9LS76 | TPS15 At3g29190 MXO21.3 | g3033.t1 |
| 14 | AT4G20200.1 | Terpenoid cyclases/Protein prenyltransferases superfamily protein | AT4G20200 | TPS07 | TPSa | O65434 | TPS07 At4g20200 F1C12.120 | g3033.t1 |
| 15 | AT4G20210.1 | Terpenoid cyclases/Protein prenyltransferases superfamily protein | AT4G20210 | TPS08 | TPSa | O65435 | TPS08 At4g20210 F1C12.130 | g3033.t1 |
| 16 | AT4G20230.2 | terpenoid synthase superfamily protein | AT4G20230 | TPS09 | TPSa | Q8L7G4 | TPS09 At4g20230 F1C12.150 | g3033.t1 |
| 17 | AT1G31950.3 | Terpenoid cyclases/Protein prenyltransferases superfamily protein | AT1G31950 | TPS29 | TPSa | Q9C6W6 | TPS29 At1g31950 F5M6.5 T12O21.14 | g3033.t1 |
| 18 | AT3G14520.1 | Terpenoid cyclases/Protein prenyltransferases superfamily protein | AT3G14520 | TPS18 | TPSa | Q9LUE2 | TPS18 At3g14520 MIE1.2 | g3033.t1 |
| 19 | AT3G14540.1 | Terpenoid cyclases/Protein prenyltransferases superfamily protein | AT3G14540 | TPS19 | TPSa | Q9LUE0 | TPS19 At3g14540 MIE1.4 | g3033.t1 |
| 20 | AT4G13280.2 | terpenoid synthase 12 | AT4G13280 | TPS12 | TPSa | Q9T0J9 | TPS12 At4g13280 T9E8.20 | g3033.t1 |
| 21 | AT4G13300.1 | terpenoid synthase 13 | AT4G13300 | TPS13 | TPSa | Q9T0K1 | TPS13 At4g13300 T9E8.40 | g3033.t1 |
| 22 | AT5G44630.1 | Terpenoid cyclases/Protein prenyltransferases superfamily protein | AT5G44630 | TPS11; BS | TPSa | Q4KSH9 | BS TPS11 At5g44630 K15C23.7 | g3033.t1 |
| 23 | AT1G48800.1 | Terpenoid cyclases/Protein prenyltransferases superfamily protein | AT1G48800 | TPS28 | TPSa | Q9C748 | TPS28 At1g48800 F11I4_3 | g3033.t1 |
| 25 | AT1G70080.1 | Terpenoid cyclases/Protein prenyltransferases superfamily protein | AT1G70080 | TPS06 | TPSa | Q84UU9 | TPS06 At1g70080 F20P5.19 | g3033.t1 |
| 26 | AT5G48110.1 | Terpenoid cyclases/Protein prenyltransferases superfamily protein | AT5G48110 | TPS20 | TPSa | Q9FI27 | TPS20 At5g48110 MDN11.20 | g3033.t1 |
| 27 | AT2G37140.1 | Terpenoid synthases superfamily protein | AT2G37140 | pseudo-C | (TPSa) | Q1PEW2 | At2g37140 | g26763.t1 |
| 28 | AT4G15870.1 | terpene synthase 1 | AT4G15870 | TPS01; TC1; TS1 | TPSa | O23651 | TPS01 TC1 TS1 At4g15870 dl3975c FCAALL.405 | g3033.t1 |
| 29 | AT1G33750.1 | Terpenoid cyclases/Protein prenyltransferases superfamily protein | AT1G33750 | TPS22 | TPSa | Q9LQ27 | TPS22 At1g33750 F14M2.13 | g3033.t1 |
| 30 | AT2G23230.2 | Terpenoid cyclases/Protein prenyltransferases superfamily protein | AT2G23230 | TPS05 | TPSa | O22184 | TPS05 At2g23230 T20D16.14 | g3033.t1 |
| 31 | AT3G14490.1 | Terpenoid cyclases/Protein prenyltransferases superfamily protein | AT3G14490 | TPS17 | TPSa | Q9LRR2 | TPS17 At3g14490 MOA2.12 | g3033.t1 |
| 32 | AT3G29110.1 | Terpenoid cyclases/Protein prenyltransferases superfamily protein | AT3G29110 | TPS16 | TPSa | Q9LVP7 | TPS16 At3g29110 MXE2.1 | g3033.t1 |
| 33 | AT3G29410.1 | Terpenoid cyclases/Protein prenyltransferases superfamily protein | AT3G29410 | TPS25 | TPSa | Q9LIA1 | TPS25 At3g29410 MUO10.2 | g3033.t1 |
| 34 | AT3G32030.1 | Terpenoid cyclases/Protein prenyltransferases superfamily protein | AT3G32030 | TPS30 | TPSa | Q9LH31 | TPS30 At3g32030 T8O3.12 | g3033.t1 |
Supplementary Table 6: Identification of methylerythritol phosphate (MEP) and mevalonic acid (MVA) genes in lemon grass
| S. No. | Gene ID from Lemongrass | Uniprot ID | Uniprot Entry | Annotation |
|---|---|---|---|---|
| 1 | g38362.t1 | F4JCU3 | MVD2_ARATH | Diphosphomevalonate decarboxylase MVD2, peroxisomal OS=Arabidopsis thaliana OX=3702 GN=MVD2 PE=1 SV=1 |
| 2 | g8212.t1 | F4K0E8 | ISPG_ARATH | 4 hydroxy 3 methylbut 2 en 1 yl diphosphate synthase (ferredoxin), chloroplastic OS=Arabidopsis thaliana OX=3702 GN=ISPG PE=1 SV=1 |
| 3 | g38362.t1 | O23722 | MVD1_ARATH | Diphosphomevalonate decarboxylase MVD1, peroxisomal OS=Arabidopsis thaliana OX=3702 GN=MVD1 PE=1 SV=1 |
| 4 | g11679.t1 | O81014 | ISPE_ARATH | 4 diphosphocytidyl 2 C methyl D erythritol kinase, chloroplastic OS=Arabidopsis thaliana OX=3702 GN=ISPE PE=2 SV=1 |
| 5 | g33940.t1 | P14891 | HMDH1_ARATH | 3 hydroxy 3 methylglutaryl coenzyme A reductase 1 OS=Arabidopsis thaliana OX=3702 GN=HMG1 PE=1 SV=1 |
| 6 | g23454.t1 | P34802 | GGPP1_ARATH | Heterodimeric geranylgeranyl pyrophosphate synthase large subunit 1, chloroplastic OS=Arabidopsis thaliana OX=3702 GN=GGPPS1 PE=1 SV=2 |
| 7 | g33940.t1 | P43256 | HMDH2_ARATH | 3 hydroxy 3 methylglutaryl coenzyme A reductase 2 OS=Arabidopsis thaliana OX=3702 GN=HMG2 PE=2 SV=1 |
| 8 | g4041.t1 | P46086 | KIME_ARATH | Mevalonate kinase OS=Arabidopsis thaliana OX=3702 GN=At5g27450 PE=2 SV=1 |
| 9 | g10131.t1 | P54873 | HMCS_ARATH | Hydroxymethylglutaryl CoA synthase OS=Arabidopsis thaliana OX=3702 GN=HMGS PE=1 SV=2 |
| 10 | g11653.t1 | P69834 | ISPD_ARATH | 2 C methyl D erythritol 4 phosphate cytidylyltransferase, chloroplastic OS=Arabidopsis thaliana OX=3702 GN=ISPD PE=1 SV=1 |
| 11 | g2230.t1 | Q09152 | FPPS1_ARATH | Farnesyl pyrophosphate synthase 1, mitochondrial OS=Arabidopsis thaliana OX=3702 GN=FPS1 PE=2 SV=2 |
| 12 | g10476.t1 | Q38854 | DXS_ARATH | 1 deoxy D xylulose 5 phosphate synthase, chloroplastic OS=Arabidopsis thaliana OX=3702 GN=DXS PE=1 SV=2 |
| 13 | g8827.t1 | Q38929 | IDI1_ARATH | Isopentenyl diphosphate Delta isomerase I, chloroplastic OS=Arabidopsis thaliana OX=3702 GN=IPP1 PE=1 SV=3 |
| 14 | g9222.t1 | Q39108 | GGR_ARATH | Heterodimeric geranylgeranyl pyrophosphate synthase small subunit, chloroplastic OS=Arabidopsis thaliana OX=3702 GN=GGR PE=1 SV=2 |
| 15 | g8827.t1 | Q42553 | IDI2_ARATH | Isopentenyl diphosphate Delta isomerase II, chloroplastic OS=Arabidopsis thaliana OX=3702 GN=IPP2 PE=1 SV=1 |
| 16 | g2230.t1 | Q43315 | FPPS2_ARATH | Farnesyl pyrophosphate synthase 2 OS=Arabidopsis thaliana OX=3702 GN=FPS2 PE=2 SV=1 |
| 17 | g3152.t1 | Q8S4Y1 | THIC1_ARATH | Acetyl CoA acetyltransferase, cytosolic 1 OS=Arabidopsis thaliana OX=3702 GN=AAT1 PE=1 SV=1 |
| 18 | g36791.t1 | Q94B35 | ISPH_ARATH | 4 hydroxy 3 methylbut 2 enyl diphosphate reductase, chloroplastic OS=Arabidopsis thaliana OX=3702 GN=ISPH PE=1 SV=1 |
| 19 | g13764.t1 | Q9C6T1 | PMK_ARATH | Phosphomevalonate kinase, peroxisomal OS=Arabidopsis thaliana OX=3702 GN=PMK PE=1 SV=1 |
| 20 | g15260.t1 | Q9CAK8 | ISPF_ARATH | 2 C methyl D erythritol 2,4 cyclodiphosphate synthase, chloroplastic OS=Arabidopsis thaliana OX=3702 GN=ISPF PE=1 SV=1 |
| 21 | g3152.t1 | Q9FIK7 | THIC2_ARATH | Probable acetyl CoA acetyltransferase, cytosolic 2 OS=Arabidopsis thaliana OX=3702 GN=At5g47720 PE=2 SV=1 |
| 22 | g9071.t1 | Q9XFS9 | DXR_ARATH | 1 deoxy D xylulose 5 phosphate reductoisomerase, chloroplastic OS=Arabidopsis thaliana OX=3702 GN=DXR PE=2 SV=2 |
| 23 | g8827.t1 | A0A178ULI3 | A0A178ULI3_ARATH | Isopentenyl diphosphate Delta isomerase OS=Arabidopsis thaliana OX=3702 GN=At5g16440 PE=3 SV=1 |
| 24 | g3152.t1 | A0A178UN67 | A0A178UN67_ARATH | AACT1 OS=Arabidopsis thaliana OX=3702 GN=At5g47720 PE=3 SV=1 |
| 25 | g8827.t1 | A0A1I9LM15 | A0A1I9LM15_ARATH | Isopentenyl diphosphate Delta isomerase OS=Arabidopsis thaliana OX=3702 GN=IPP2 PE=1 SV=1 |
| 26 | g38362.t1 | A0A1I9LME2 | A0A1I9LME2_ARATH | Diphosphomevalonate decarboxylase OS=Arabidopsis thaliana OX=3702 GN=At3g54250 PE=1 SV=1 |
| 27 | g2230.t1 | A0A1P8B4W4 | A0A1P8B4W4_ARATH | Farnesyl diphosphate synthase 2 OS=Arabidopsis thaliana OX=3702 GN=FPS2 PE=1 SV=1 |
| 28 | g22151.t1 | A0A2H1ZEF4 | A0A2H1ZEF4_ARATH | 2 C methyl D erythritol 2,4 cyclodiphosphate synthase OS=Arabidopsis thaliana OX=3702 GN=ISPF PE=1 SV=1 |
| 29 | g3152.t1 | A0A5S9YC31 | A0A5S9YC31_ARATH | Uncharacterized protein OS=Arabidopsis thaliana OX=3702 GN=At5g48230 PE=3 SV=1 |
| 30 | g33940.t1 | A0A654ER34 | A0A654ER34_ARATH | 3 hydroxy 3 methylglutaryl coenzyme A reductase OS=Arabidopsis thaliana OX=3702 GN=At1g76490 PE=3 SV=1 |
| 31 | g8212.t1 | B3H725 | B3H725_ARATH | 4 hydroxy 3 methylbut 2 enyl diphosphate synthase OS=Arabidopsis thaliana OX=3702 GN=HDS PE=1 SV=1 |
| 32 | g27299.t1 | C0Z3D4 | C0Z3D4_ARATH | Hydroxymethylglutaryl CoA reductase (NADPH) OS=Arabidopsis thaliana OX=3702 GN=At1g76490 PE=2 SV=1 |
| 33 | g2230.t1 | F4JNF1 | F4JNF1_ARATH | Farnesyl diphosphate synthase 2 OS=Arabidopsis thaliana OX=3702 GN=FPS2 PE=1 SV=1 |
| 34 | g3152.t1 | F4JYM8 | F4JYM8_ARATH | Thiolase family protein OS=Arabidopsis thaliana OX=3702 GN=AACT1 PE=1 SV=1 |
| 35 | g9071.t1 | F4K7T6 | F4K7T6_ARATH | 1 deoxy D xylulose 5 phosphate reductoisomerase OS=Arabidopsis thaliana OX=3702 GN=DXR PE=1 SV=1 |
| 36 | g19714.t1 | Q67XB6 | Q67XB6_ARATH | Uncharacterized protein At1g31910 OS=Arabidopsis thaliana OX=3702 GN=At1g31910 PE=2 SV=1 |
| 37 | g23015.t1 | Q944G7 | Q944G7_ARATH | 1 deoxy D xylulose 5 phosphate synthase OS=Arabidopsis thaliana OX=3702 GN=At4g15560 PE=2 SV=1 |