
1. INTRODUCTION
As a major source of food and livelihood for millions of people, agriculture is a vital industry. As a major food crop, bananas have the potential to generate substantial cash for growers and the country’s economy [1]. Farmers are not able to fully take use of the banana crop’s potential because of a variety of risks that reduce production. Pests and illnesses pose a major threat to banana production, reducing yields and resulting in substantial financial losses for growers. When plant diseases are correctly identified early on, growers can better control disease severity [2]. Insects and diseases have a wide range of symptomologies. In certain crops, diseases are visible at an early stage, while in others, they will only be apparent at a later stage, by that time it will be too late to save the crop from destruction.
Recently developed sensors for remote sensing have improved the ability to identify diseases in plants. Hyperspectral imaging at a close range is one of the new research techniques available to biologists [4]. In recent years, numerous researchers have described their work on the design and deployment of HS imaging schemes to gather reflectance information from plant leaves [5,6]. The sensor camera is moved over a piece of a leaf which records the reflection of light. It is highly problematic and expensive to obtain sufficiently labeled illustrations in the earlier illness infected stage for categorization due to the subsystem of the hyperspectral camera, as well as the non-apparent signs of banana infection [7].
Artificial intelligence (AI) [8] helps to recognize plant illnesses based on the plant’s presence and visual symptoms that imitate human behavior are deliberated [9]. This could help reduce the spread of pests and diseases by alerting farmers and speeding up disease detection [10]. Internet of things, robotics, and satellites are among the cutting-edge technology transforming agriculture and helping farmers anticipate the future. Studies on wheat [11] and cassava [12] have verified AI-based detection of agricultural diseases. Computerized image-based illness recognition has shown talented results [14]. However, extracting characteristics is computationally demanding and requires expert knowledge for robust depiction [15,16], where only few substantial, curated crop disease image databases exist. Currently, the PlantVillage data set has over 50,000 photos of diverse crops and illnesses. Convolutional neural network (CNN) learned on these images, but did not perform well when using real field images [17]. Until now, crop disease-finding models have typically focused on leaf symptoms, which are the easiest to identify.
Therefore, in this research study, hybrid segmentation is used to segment the affected areas of input leaves and a deep learning classifier is used for classification. The detailed explanation about research work is given in the following sections. The related study of the existing techniques on banana leaves are given in section 2, whereas the study of the proposed technique is presented in section 3. The validation of the proposed technique with existing techniques in terms of various metrics is given in section 4. Lastly, the conclusion of the research study is provided in section 5.
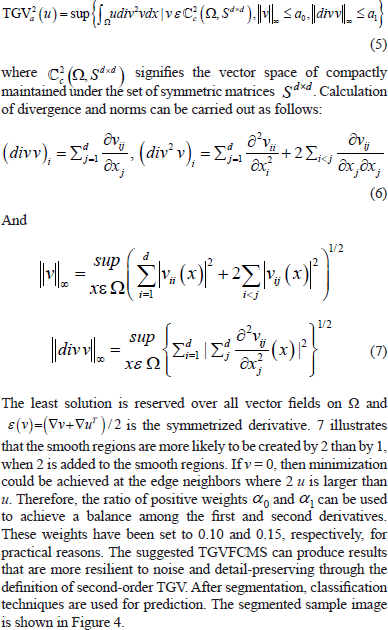
2. RELATED WORKS
With regard to CNN models, Ferentinos [18] detected plant diseases using simple photos of healthy and diseased leaves. The AlexNetOWTBn and VGG models were utilized in the CNN model to classify leaf diseases. An open database including 87,848 photos of 25 diverse plants in 58 separate classes of plant–illness pairs was used to train the models. Both in-lab and field photos were acquired. We have 58 separate classes of combinations that include particular healthy plants (HP). We have 25 plant species in these groups. To produce the best results, the CNN model’s parameters are fine-tuned to optimize training parameters. As a result of the VGG CNN, classification accuracy reached 99.53%, with an error rate of only 0.47% correspondingly. The image segmentation, which affects classification accuracy, was excluded from this investigation.
A banana disease and pest detection scheme utilizing an AI-based DCNN has been proposed by Selvaraj et al. [19] in order to benefit banana growers. Novel and rapid ways for detecting pests and diseases at the right moment will make it easier to monitor and create control measures with greater effectiveness. Just-in-time crop disease detection is a new use of DCNNs and transfer learning. In this experiment, 18,000 photos of banana fields were used. The data set is separated into training (Ttr), validation (Tv), and testing (Tt), with 70%, 20%, and 10%, respectively. We also choose to use a simple random sampling technique due to its ease of implementation. The accuracy of the different models examined ranged from 70% to 99%. There are a number of ways in which this system can assist in the early detection and management of pests and diseases.
It was postulated that local textural traits might be used for the classification of three significant banana foliar diseases. As part of the pre-processing stage, the resized images are given a contrast boost using the contrast limited adaptive histogram equalization technique. Image enhancement and color segmentation are used to recognize the disease-affected regions. Three image transformations are used to convert segmented images to transform domain (DWT, DTCWT, and Ranklet transform). LBP and its derivatives are used to extract feature vectors from images in the transform domain (ELBP, MeanELBP, and MedianELBP). A 10-fold cross-validation method is used to associate the performance of 5 prominent image classifiers. Tests with ELBP features taken from the DTCWT domain revealed the highest accuracy, precision, sensitivity, and specificity (96.4% and 95.4%, respectively).
For the classification of wheat seeds, Eldem [21] has presented a novel DNN model. In the overall data set, 70% of the data is trained data and 30% is test data. A 100% classification rate is achieved when the generated model is applied to data sets. More than 100,000 synthetic wheat seed data are generated using a fuzzy C-means (FCM) algorithm. There is a 70/30 split between the trained and the test data in this experiment. UCI wheat seed and synthetically created data sets were used to evaluate the proposed model. A 100% classification success rate was attained.
By imputing missing pixels, Balasubramaniam and Ananthi [22] have introduced a new technique for segmenting partial, nutrient-deficient cropped pictures [23]. In most cases, each image has pixels that convey information about its intensity. It is considered an incomplete image when there are missing pixels. It is not immediately relevant to incomplete images. This can lead to an error when attempting to segment nutritional deficient areas when there are missing pixww els. Due to intrinsic faults in imaging equipment or environmental conditions, crop pictures with nutritional deficit may contain missing pixels. Nutrient insufficiency in crop photos is segmented using FCM color clustering.
3. PROPOSED SYSTEM
In this section, an explanation of the proposed scheme is given wherein Figure 1 shows the working procedure of banana leaf disease classification. Initially, the International Center for Tropical Agriculture (CIAT) banana images were taken as input data, which is given to the pre-processing technique. A hybrid segmentation called total generalized variation fuzzy C means (TGVFCMS) is used for segmenting the affected area on the leaves. After segmentation, the data is given to CNN for final classification.
3.1. Data Set
We have a database of over 18,000 real field photographs of bananas in CIAT’s image library. The data sets cover dried/old leaves (DOL), HP, and a balanced 700 images from 5 major diseases such as Fusarium wilt of banana (FWB), black sigatoka (BS), Xanthomas wilt of banana or banana bacterial wilt (BBW), yellow sigatoka (YS), and banana bunchy top disease. The data set consists of entire plant, leaf, pseudo-stem, fruit bunch, cut fruit and corm. But in this proposed research work, we have only used the leaf images to detect the disease BS, BBW, YS, and DOL in HP. Totally, we have only used 9,000 images from the data set. Some of the sample data set images are shown in Figure 2.
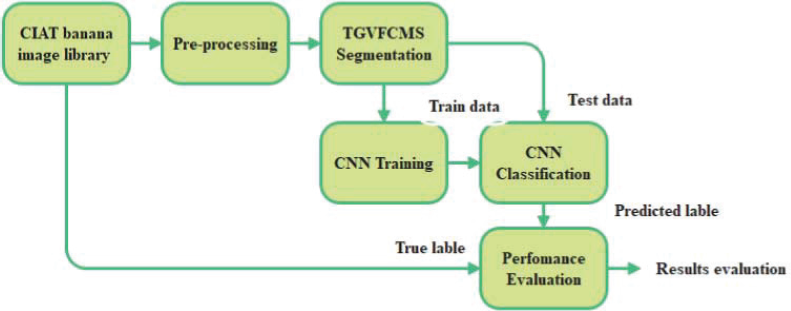 | Figure 1: Working procedure of the proposed methodology. [Click here to view] |
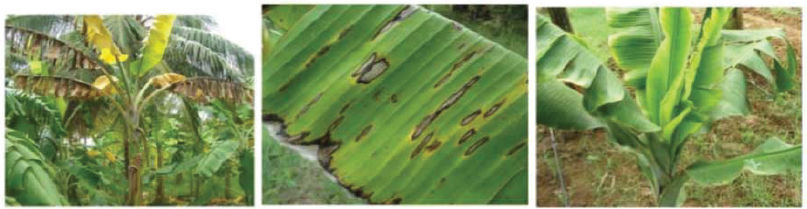 | Figure 2: Some of the sample data set images. [Click here to view] |
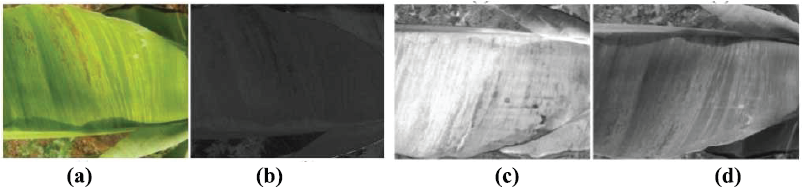 | Figure 3: (a) Input image. (b) Hue component. (c) Saturation component. (d) Intensity component of the HSI color model. [Click here to view] |
3.2. Pre-Processing
Images of the banana leaf will be commonly acquired in the RGB color space model. Color is an important feature as color value shows variations based on disease infection in the plant. Other color space models like RGB, hue saturation intensity (HSI), CMYK, L*a*b, and hue saturation value (HSV) can also be used for analysis. Acquired images are manipulated directly in the RGB color space model and color transformation is carried out over the image to standardize the color model. HSI and HSV color space models are commonly used in leaf disease identification as they are similar to human perception. In the HSI color model, hue and intensity of a color are observed and in the HSV color model, hue and value of a color are considered for manipulation. Hue is an important color component taken into consideration as it shows the perceived color of an object which is shown in Figure 3.
During image pre-processing, an image is altered to provide more information about the affected area of a leaf. With good visual interpretation, it presents leaf image information effectively. This procedure does not modify the leaf image’s inherent information, but it does change the dynamic range of specific aspects for localization, allowing for a more accurate localization. Image resizing and filtering are the common pre-processing techniques used in banana leaf disease diagnosis. The captured leaf image in different resolution sizes are standardized to a fixed resolution size using image resizing. Image filtering is used to remove unwanted region in leaf images as there are more possibilities to have dust particles or due drops on the leaf. The filtering process is carried out using either a low pass or high pass filter. A low pass filter lessens the amplitude of high frequencies and has low frequencies unchanged. A high pass filter retains high frequencies and soothes the amplitude of low frequencies. Median filter and average filter are commonly used filtering techniques to reduce noise in an image. The pre-processed images are given to the segmentation which is described in the section below.
3.3. Segmentation using TGVFCMS
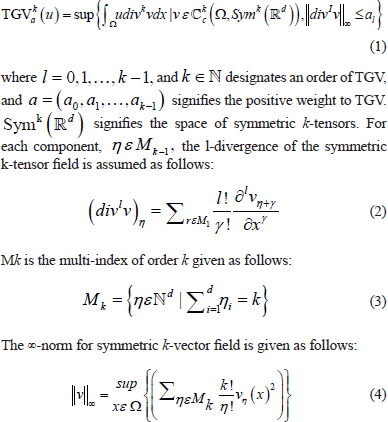
After pre-processing, the segmentation is carried out. TGVFCMS technique is robust to noise and edge-preserving. Regularization of TGV images up to a specific order of separation is particularly beneficial for measuring image attributes like noise removal and edge sharpness. Our TGVFCMS was developed to include TGV regularization in the smoothing term in order to minimize undesirable noise and artifacts from FCM-based approaches. The following is the framework of TGV:
 | [Click here to view] |
This is because the first gradient and the high-order gradients generated in (4) are both restricted to be sparse.
Here, the second-order TGV is as follows:
 | [Click here to view] |
3.4. Classification using Deep Learning Technique
The CNN is a matrix input-based classifier; so, we convert the segmented image into a gray scale image as a 32 × 32 matrix, which is given as an input image for CNN classification. The layer definition of the proposed CNN is defined below.
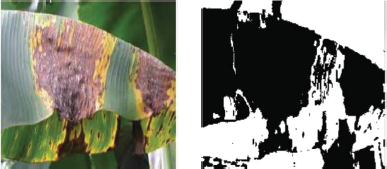 | Figure 4: Sample segmentation image. [Click here to view] |
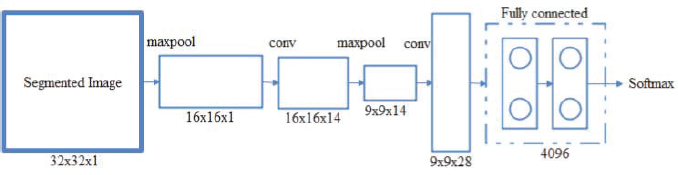 | Figure 5: Typical architecture of deep CNN. [Click here to view] |
3.4.1. CNN classification
It consists of different sorts of layers, such as a convolution layer, a ReLU layer, pooling layers, and output levels with fully connected output layers. An image’s borders and forms are recognized by CNN.
3.4.2. Convolutional layer
In CNN construction, the initial layer is always a convolutional layer. A CNN accepts M × N × 1 as an input layer. A two-dimensional image with single layers has a two-dimensional size of M × N. This filter has the same depth as the input image and is convolved with the image. As a result, the input image is convolved with this curve or form, resulting in the final image. During convolution, the shape that closely approaches the curve in the input image and is signified by the filter ends up with higher values. Equation (8) can be used to represent a convolution process as follows:
s (t) = (x*w)(t) (8)
3.4.3. Pooling layer
To minimize the size of the data, a pooling layer is used. It includes dividing the matrix data into segments and replacing each segment with a single value. Figure 5 shows that the segmented matrices are swapped by the extreme or average of all values within the current segment.
3.4.4. Fully connected layer
Dimensional changes are made in a fully linked layer in order to accommodate the network layer architecture. Each dimension of input and output of a completely connected layer is connected to each other. All activations from a previous layer are passed on to the next layer, as it is in a typical ANN.
3.4.5. Softmax layer
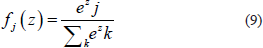
When the Softmax function is called, input from preceding layers is translated into a possibility for the classes that total to 1. As a result, this layer plays a significant part in the anticipated output, as it is the class which has the largest possibility for the given data input. It is given as follows:
 | [Click here to view] |
where ez j is the standard exponential function for output vector and k is a number of classes in the CNN classifier.
Images may be classified using deep neural networks. These networks are pre-trained to categorize different images, but they may be modified to meet our classification problematic via transfer learning by modifying essential parameters.
For all the networks, hyper-parameter training has been maintained. Multiple epochs (maximum 25) were used to divide data into segments. As the name suggests, mini-batch size is the sum of samples that are used to update a model’s parameters. Training mini-batch size was retained at 7 and initial learning rate was fixed at 0.0001.
4. RESULT AND DISCUSSION
The proposed system validations are carried out to test the effectiveness of each objective described in the sub-sections below.
4.1. Evaluation Metrics
For classification, the assessment criteria comprise sensitivity (SE), specificity (SP), and accuracy (AC). The performance criteria are defined as follows:
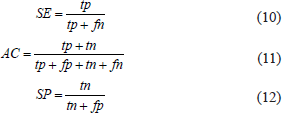 | [Click here to view] |
where tp, tn, fp, and fn signify the number of true positives, true negatives, false positives, and false negatives.
4.2. Performance Analysis of Segmentation and Classification
Table 1 shows the initial performance analysis of the proposed TGVFCMS with CNN for the overall banana disease data set in terms of SE, SP, and ACC. Here, we compared the proposed method by having the whole data set without pre-processing and segmentation.
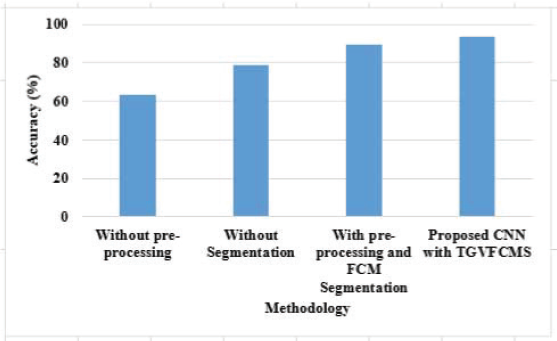 | Figure 6: Graphical representation of proposed CNN with TGVGCMS in terms of accuracy. [Click here to view] |
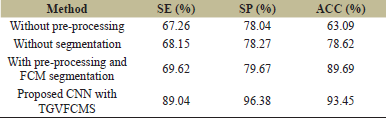 | Table 1: Performance evaluation of the proposed CNN with TGVFCMS. [Click here to view] |
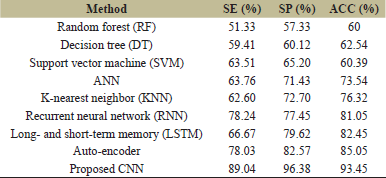 | Table 2: Performance evaluation of CNN. [Click here to view] |
After that, the data set is trained with pre-processing and existing FCM segmentation, which is compared with our proposed TGVFCMS with CNN. Figure 6 shows the proposed method accuracy.
From Table 1 and Figure 6, it is clear that CNN without pre-processing achieved only 67.26% of SE, 78.04% of SP, and 63.09% of ACC. The same CNN method increased 2% of SE and SP by training without segmentation. However, CNN trained with FCM segmentation and pre-processing achieved nearly 69% of SE, 79% of SP, and 89.69% of ACC. The SE, SP, and ACC are gradually increased (nearly 13%–17%) when the classifier CNN is trained with TGVFCM segmentation technique. This proves that our proposed hybrid segmentation technique of FCM achieved better performance than the existing FCM. Table 2 shows the performance analysis of CNN with other existing machine learning and deep learning practices; Figure 7 shows the graphical representation of CNN in terms of accuracy.
Here, the existing techniques, including LSTM, RF, ANN, DT, SVM, KNN, RNN, and auto-encoder, are compared with the CNN technique. Among these techniques, RF and DT achieved very low performance in terms of SE, SP, and ACC. The SVM, KNN, and ANN achieved nearly 63% of SE, 65%–70% of SP, and 71% of ACC, whereas RNN achieved better performance than LSTM in terms of SE. Auto-encoder achieved high performance than RNN and LSTM in terms of all metrics. But, the proposed CNN technique achieved 890.4% of SE, 96.38% of SP, and 93.45% of ACC. This is because CNN is trained with TGVFCMS segmentation technique, which has better performance than the other existing techniques.
5. CONCLUSION
Automatic identification and classification of illnesses in banana leaves are more accurate using image processing techniques. For disease diagnosis, these technologies eliminate the amount of time and money required to complete the project. Various leaf diseases and their symptoms are described in this paper. MATLAB is used to make a system for detecting banana plant diseases. The image acquisition, pre-processing, and segmentation phases are followed by the classification phase, which is then used to further classify the diseases. An affected area is segmented using TGVFCMS and then the classification of diseases on segmented images is carried out by using the CNN technique. The experiments are carried out on CIAT banana image library and validated with existing techniques in terms of SE, SP, and ACC. From the trial results, it is proved that the CNN method achieved 93.45% accuracy, where the existing techniques achieved nearly 75%–85% accuracy. In addition to replacing manual methods for identifying banana illnesses, this approach is more accurate than manual methods and will prove to be a valuable tool for farmers and plant pathologists in determining the disease and its control measures. As a result of this method, the production of crops will grow. The algorithm will be optimized for improved outcomes and great accuracy in the future. It is necessary to study and execute prevention techniques in order to increase the growth and output of banana plantations. In addition, as a future work, the algorithm should be improved to form an early warning system for banana diseases by collecting the data of climatic conditions, such as temperature, humidity, water level, soil conditions, etc.
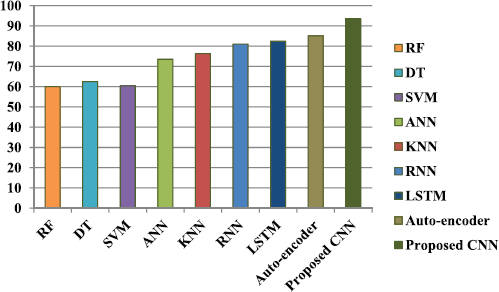 | Figure 7: Graphical representation of proposed CNN in terms of accuracy. [Click here to view] |
AUTHOR CONTRIBUTIONS
All authors made substantial contributions to conception and design, acquisition of data, or analysis and interpretation of data; took part in drafting the article or revising it critically for important intellectual content; agreed to submit to the current journal; gave final approval of the version to be published; and agree to be accountable for all aspects of the work. All the authors are eligible to be an author as per the international committee of medical journal editors (ICMJE) requirements/guidelines.
FUNDING
There is no funding to report.
CONFLICTS OF INTEREST
The authors report no financial or any other conflicts of interest in this work.
ETHICAL APPROVALS
This study does not involve experiments on animals or human subjects.
PUBLISHER’S NOTE
This journal remains neutral with regard to jurisdictional claims in published institutional affiliation.
REFERENCES
1. Ahmad MNB, Fuad NA, Ahmed SK, Abidin AAZ, Ali Z, et al. Image processing of an agriculture produce: determination of size and ripeness of a banana. In: International symposium on information technology 2008. Inst. of Elec. and Elec. Eng. Computer Society, IEEE, Kuala Lumpur, Malaysia, pp 1–7, vol. 1, 2008.
2. Al-Hiary H, Bani-Ahmad S, Reyalat M, Braik M, ALRahamneh Z. Fast and accurate detection and classification of plant diseases. Int J Comput Appl 2011;17:31–8.
3. Behmann J, Mahlein A, Paulus S, Dupuis J, Kuhlmann H, Oerke E. Generation and application of hyperspectral 3D plant models: methods and challenges. Mach Vis Appl 2016;27(5):611–24.
4. Scharr H, Dee H, French AP, Tsaftaris SA. Special issue on computer vision and image analysis in plant phenotyping. Mach Vis Appl 2016;27(5):607–9.
5. Rumpf T, Mahlein AK, Steiner U, Oerke EC, Dehne HW, Plümer L. Early detection and classification of plant diseases with support vector machines based on hyperspectral reflectance. Comput Electron Agri 2010; 74(1):91–9.
6. Mahlein A, Steiner U, Dehne H, Oerke E. Spectral signatures of sugar beet leaves for the detection and differentiation of diseases. Precis Agri 2010;11(4):413–31.
7. Liao W, Ochoa D, Gao L, Zhang B, Philips W. Morphological analysis for banana disease detection in close range hyperspectral remote sensing images. In: IGARSS 2019-2019 IEEE international geoscience and remote sensing symposium, IEEE, pp 3697–700, 2019.
8. Camargo A, Smith J. An image-processing based algorithm to automatically identify plant disease visual symptoms. Biosyst Eng 2009;102(1):9–21.
9. Mohanty SP, Hughes DP, Salathe M. Using deep learning for image-based plant disease detection. Front Plant Sci 2016;7:1419.
10. Intelligence G. The mobile economy Africa 2016. GSMA, London, UK, 2016.
11. Siricharoen P, Scotney B, Morrow P, Parr G. A lightweight mobile system for crop disease diagnosis. In: International conference on image analysis and recognition. Springer, Berlin, Germany, pp 783–91, 2016.
12. Ramcharan A, Baranowski K, McCloskey P, Ahmed B, Legg J, Hughes DP. Deep learning for image-based cassava disease detection. Front Plant Sci 2017;8:1852.
13. Wiesner-Hanks T, Stewart EL, Kaczmar N, DeChant C, Wu H, Nelson RJ, et al. Image set for deep learning: field images of maize annotated with disease symptoms. BMC Res Notes 2018;11(1):440.
14. Mwebaze E, Owomugisha G. Machine learning for plant disease incidence and severity measurements from leaf images. In: 2016 15th IEEE international conference on machine learning and applications (ICMLA). IEEE, New York, NY, pp 158–63, 2016.
15. Kamilaris A, Prenafeta-Boldu FX. Deep learning in agriculture: a survey. Comput Elect Agric 2018;147:70–90.
16. Hughes D, Salathe M. An open access repository of images on plant health to enable the development of mobile disease diagnostics. arXiv 2015;1511.08060.
17. He K, Zhang X, Ren S, Sun J. Deep residual learning for image recognition. In: Proceedings of the IEEE conference on computer vision and pattern recognition, pp 770–8, 2016.
18. Ferentinos KP. Deep learning models for plant disease detection and diagnosis. Comput Electron Agri 2018;145:311–8.
19. Selvaraj MG, Vergara A, Ruiz H, Safari N, Elayabalan S, Ocimati W, et al. AI-powered banana diseases and pest detection. Plant Methods 2019;15(1):1–1.
20. Mathew D, Kumar CS, Cherian KA. Foliar fungal disease classification in banana plants using elliptical local binary pattern on multiresolution dual tree complex wavelet transform domain. Inform Process Agri 2020.
21. Eldem A. An application of deep neural network for classification of wheat seeds. Avrupa Bilim ve Teknoloji Dergisi 2020;19:213–20.
22. Balasubramaniam P, Ananthi VP. Segmentation of nutrient deficiency in incomplete crop images using intuitionistic fuzzy C-means clustering algorithm. Nonlinear Dyn 2016;83(1):849–66.