
1. INTRODUCTION
Medicinal plants remain central to traditional healthcare systems in India and other developing regions, where a substantial proportion of the population relies on traditional and herbal medicine for primary healthcare needs [1,2]. Among the country’s diverse medicinal flora, two closely resembling yet taxonomically distinct species—Hemidesmus indicus (L.) R.Br. ex Schult. (commonly known as Indian sarsaparilla or Anantm?la) and Decalepis hamiltonii Wight & Arn. (swallow root)—hold considerable ethno-pharmacological and commercial significance.
Hemidesmus indicus is officially listed in the Ayurvedic Pharmacopeia of India as the genuine drug “Sariva” and is highly valued for its blood-purifying, anti-inflammatory, and restorative properties [3,4]. It occurs naturally in semi-dry scrub and deciduous forests across the Indian subcontinent, from the Gangetic plains to peninsular regions up to 600 m altitude [5]. However, due to escalating commercial demand, slow regeneration, and habitat degradation, wild populations of H. indicus are declining, resulting in frequent substitution with morphologically similar roots of D. hamiltonii in the herbal trade [6,7].
The D. hamiltonii plant provides higher biomass at a low cost and thrives well in cultivated environments [8]. Because it competes with H. indicus, which is utilized in Ayurvedic herbal medicines, the plant acts as an adulterant. It is challenging to employ conventional macroscopic and microscopic identification procedures, particularly with dried or powdered samples, because the two species exhibit identical organoleptic features, such as light-brown roots, fragrant scents, and a similar texture [9,10]. For Ayurvedic raw medications to remain valid, a molecular foundation for authenticating H. indicus and D. hamiltonii must be developed. Although pharmacognostic investigations show that the two species have differing ash and extractive properties, misidentification and market replacement are nevertheless often observed [9].
According to research, it might be difficult to identify medicinal plants that have close botanical relatives since their physical and therapeutic characteristics overlap. The researchers must identify plant species using a different method that offers greater accuracy than current methods, which present significant obstacles. DNA barcoding, which examines short DNA sequences with certain genetic markers that differ between species while staying conserved within a species, has become a dependable method to address issues.
The Internal Transcribed Spacer 2 (ITS2) region of nuclear ribosomal DNA serves as a primary biological marker that scientists commonly use [10]. The ITS2 sequence enables scientists to identify closely related medicinal plants, owing to its highly variable region plus short segments. It can be easily processed using standard scientific methods. These features make it well-suited for routine identification and authentication studies [11–13]. Recent work has demonstrated that ITS2 performs well in resolving closely related taxa and detecting adulteration, particularly when plant materials are powdered or otherwise processed and traditional identification becomes unreliable [14,15]. According to a study by Polasam et al.[16], researchers were able to construct a dependable molecular identification workflow while performing DNA barcoding and phylogenetic analysis for Indian Phyllanthus species utilizing concatenated nrITS sequences. The work shows that by combining nuclear and plastid DNA markers, researchers can identify Indian medicinal plants at the species level.
The analysis of ITS2 secondary-structure features allows scientists to identify different species that share closely related genetic sequences. The combination of DNA barcoding with Basic Local Alignment Seraching Tool (BLAST) analysis and phylogenetic clustering, and ITS2 secondary structure analysis creates an effective method for species identification. The method authenticates Sariva while identifying contaminating substances and safeguarding the H. indicus genetic resources. The raw drug market becomes more chaotic because people cannot tell apart the dried and powdered roots of H. indicus and D. hamiltonii, which display distinct morphological traits that become less visible after the roots undergo drying, fragmenting, and powdering. The objectives of the study are to genetically characterize both taxa using ITS2-based DNA barcoding.
2. MATERIALS AND METHODS
2.1. Ethical Statement
The research team obtained all required permissions and ethical approvals before beginning their plant sample collection. Written consent was taken from the private growers from whom specimens of H. indicus and D. hamiltonii were collected in Karnataka, India. The Himalaya Wellness Herbaria in Bengaluru received the fresh root and leaf samples. Later samples were verified and registered at their facility with voucher specimens. Stored under the accession numbers HWH-HI-2024 for H. indicus and HWH-DH-2024 for D. hamiltonii. All procedures complied with institutional and national ethical standards for research on medicinal plants.
2.2. Plant Material Preparation
Fresh root and leaf samples were collected from three independent plants of each species from different locations. The researchers conducted DNA extraction for every individual plant sample because they wanted to prevent any combined material usage. The samples underwent a washing process with sterile distilled water and then were shade dried for 24 hours before being kept at −20°C until the DNA extraction process. The researchers used a chilled mortar and pestle to finely powder approximately 100 mg of tissue from each plant before proceeding with the genomic DNA isolation process.
2.3. Genomic DNA Extraction and Analysis
The NucleoSpin® Plant II DNA Kit (MACHEREY-NAGEL, Germany) was used to extract genomic DNA according to the manufacturer's instructions. To verify DNA integrity, 5 µl of extracted DNA was mixed with 5 µl of 6× loading dye (HiMedia Laboratories, India), loaded on a 0.8% agarose gel, and electrophoresed at 100 V for 1 hour together with a 1 kb DNA ladder. The gel was visualized under UV illumination using a Vilber Gel Documentation System (France). The purity and concentration of DNA were determined using a NanoDrop spectrophotometer (Thermo Scientific, UK), which measured A???/A??? nm. Samples with ratios between 1.8 and 2.0 were considered high quality and used for subsequent polymerase chain reaction (PCR) amplification.
2.4. PCR Amplification
2.4.1. ITS2 amplification
The universal primers ITS2-S2F (5′-ATGCGATACTTGGTGTGAAT-3′) and ITS4R (5′-TCCTCCGCTTATTGATATGC-3′) were used to amplify the nuclear ITS2 region. A total reaction volume of 25 µl was used for PCR, which was conducted on the ProFlex™ PCR System (Applied Biosystems, USA) using 2× PCR Taq Master Mix (HiMedia MBT061) and 10 µM of each primer (Sigma-Aldrich, USA) and approximately 50 ng of template DNA and nuclease-free water to reach the final volume.
A single thermal cycling protocol was used for all ITS2 amplifications to ensure consistency across samples. PCR was performed in a thermal cycler (ABI-Applied Biosystems, Veriti, USA) using the following cycling parameters: an initial denaturation step at 95°C for 5 minutes, followed by 30 cycles at 95°C for 30 seconds, an annealing step at 55°C for 30 seconds, an extension step at 72°C for 45 seconds and a final extension step at 72°C for 7 minutes. PCR was repeated three times for each sample to check consistency in amplification. The PCR products, which were generated by the experiment, show a length of ~450 base pairs, which match the amplified region that contains both short flanking sequences and the ITS2 region. Excised the amplicons from the gel and used the NucleoSpin® Gel and PCR Clean-up Kit (MACHEREY-NAGEL, Germany) to purify the samples according to the manufacturer’s instructions.
2.5. DNA Sequencing
The purified ITS2 gene product showed a single distinct band. It was sent to Eurofins Genomics India Pvt. Ltd., Bengaluru, for Sanger sequencing. Then used Chromas v2.6.6 to manually inspect the chromatograms and converted the sequences into FASTA format. The research team created bidirectional reads, which they assembled and verified to produce high-quality consensus sequences for every species before continuing their research. Performed a detailed examination of all consensus sequences to verify base-calling accuracy, and they conducted manual editing to eliminate ambiguous nucleotides before submitting to the NCBI GenBank database.
Conducted five separate ITS2 amplicon sequencing experiments to achieve accurate and reproducible results. The resulting sequences were aligned and compared, and no nucleotide variation was observed among the replicate sequences from the same sample. The identical sequences resulted in the selection of one consensus sequence, which was used for NCBI GenBank submission and phylogenetic analysis.
2.6. Sequence Alignment and Phylogenetic Analysis
Aligned the ITS2 consensus sequences from H. indicus, D. hamiltonii, and NCBI GenBank reference accessions using Geneious Prime software (Biomatters Ltd, New Zealand). Used BioEdit CLUSTALW (version 7.2.5) to create initial alignments, which they manually modified until reaching the deletion of parts that showed less than 80% coverage of original reads. The program Geneious automatically calculated three sequence metrics, which included Guanine & Cytosine (GC) content, alignment percentage, and pairwise similarity. Used NCBI BLASTn to validate the sequence against the GenBank database to determine its taxonomic classification.
Further used combined ITS2 sequence datasets for their phylogenetic reconstruction analysis, which they conducted with MEGA X software version 12 and the Phylogeny. fr tool. The researchers created multiple sequence alignments with either MUSCLE or ClustalW software. The researchers selected reference ITS sequences from GenBank for phylogenetic analysis which required the following criteria to be met: (i) high sequence quality with minimal ambiguous bases, (ii) confirmed species-level identification, (iii) geographic relevance to Indian or closely related Asian populations when available, and (iv) adequate sequence length covering the ITS2 region to ensure reliable alignment and comparison.
Using the Kimura 2-Parameter (K2P) substitution model, evolutionary links were inferred using the Neighbour-Joining (NJ) and Maximum Likelihood (ML) analysis. The researchers used the complete deletion method to exclude all positions that contained either gaps or missing data. Evaluated tree topology reliability by performing bootstrap analysis with 2,000 replicates, while considering bootstrap values above 70% as indicators of strong clade support. Recorded the total number of retained nucleotide positions for each dataset after they deleted nucleotide positions. Selected reference ITS2 sequences based on two criteria, which included complete sequence data and verified species identification, while needing to have minimal ambiguous bases.
2.7. DNA Barcoding and ITS2 Secondary Structure Prediction
The Bio-Rad DNA Barcode Generator tool (version 1.2) was used to generate DNA barcodes. These barcodes showed distinct nucleotide patterns from the aligned ITS2 sequences. The RNAfold WebServer v2.4.18 software from ViennaRNA Package was used to predict RNA secondary structures of ITS2 sequences while the system compared H. indicus and D. hamiltonii minimum free energy (MFE) conformations. Finally used structural models to determine how different DNA sequences would lead to different species classification through their physical characteristics.
3. RESULTS AND DISCUSSION
DNA barcoding has become an important method for the molecular characterization of medicinal plants. It is used to verify the purity and grade of herbal medicinal products. Hemidesmus indicus serves as the authentic drug “Sariva” which people use for its abilities to cleanse blood and produce urine and reduce inflammation. The use of such look-alike species not only compromises therapeutic efficacy but also creates safety hazards. Because they contain different chemical substances [6,7]. The study proves that molecular barcoding, together with phylogenetic analysis, enables accurate identification of the two taxa, which traditional organoleptic and microscopic methods fail to accomplish.
3.1. Collection of Plant Specimens and Morphological Identification
The roots possess a tuberous structure, which generates a thick carrot-shaped root system that produces a strong aroma. The fresh D. hamiltonii roots exhibit distinct characteristics that separate them from the thin fibrous roots of H. indicus. The drying process, followed by cutting and grinding procedures, which traders use to prepare roots for their business activities, causes people to mistakenly identify raw-drug samples because they cannot identify the original root characteristics.
Fresh specimens of H. indicus and D. hamiltonii were collected from naturally occurring populations and cultivated fields in Karnataka, India. Each specimen was authenticated through detailed morphological examination prior to molecular analysis. Researchers compared root and leaf and floral characteristics to the diagnostic features that the Ayurvedic Pharmacopoeia of India and standard floras provide. The Himalaya Wellness Herbaria received representative voucher specimens, which scientists prepared and deposited under accession numbers HWH-HI-2024 (H. indicus) and HWH-DH-2024 (D. hamiltonii) (Fig. 1). The comparative diagnostic morphological characteristics of both species are summarized in Table 1.
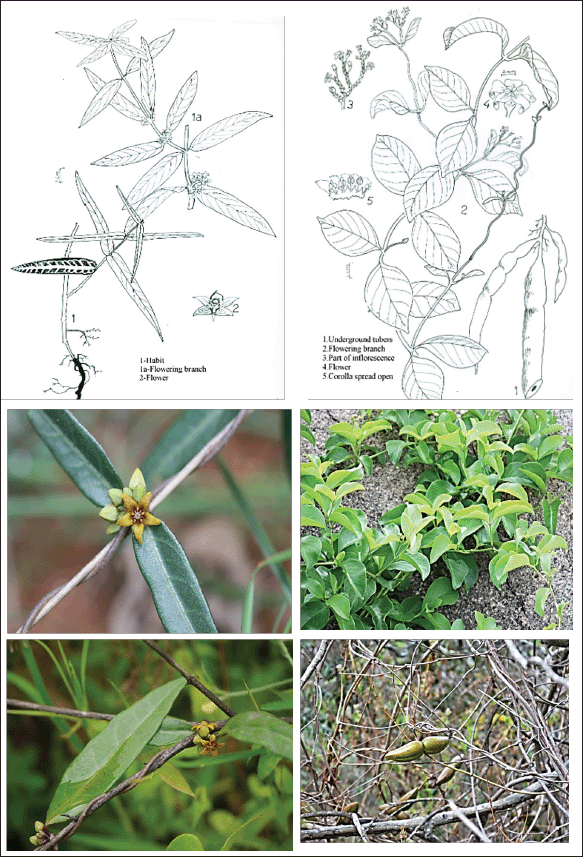 | Figure 1. Comparative morphology of Hemidesmus indicus and Decalepis hamiltonii relevant to molecular authentication. The figure presents key diagnostic features of H. indicus (left) and D. hamiltonii (right), two medicinal species frequently confused in the crude drug trade. Botanical illustrations highlight distinguishing traits such as growth habit, leaf form, floral structure, and underground organs. Field and specimen photographs further show characteristic vegetative, flowering, and fruiting features. Together, these images illustrate the morphological differences between the two taxa and support the need for molecular tools, such as ITS2 barcoding, for accurate species authentication.. [Click here to view] |
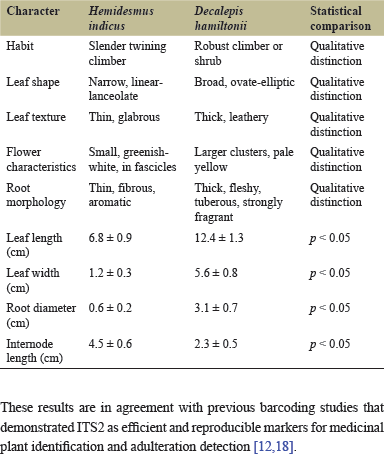 | Table 1. Comparative morphological differentiation. The two species could be clearly distinguished based on. [Click here to view] |
3.1.1. Morphological characters of Hemidesmus indicus
The plant H. indicus grows as a slender climber that develops upward through its twining and prostrate growth, while its leaves grow in opposite pairs as narrowly elliptical to linear-lanceolate shapes, which measure between 5 and 10 cm in length and end in acute tips, while their surfaces remain hairless. The plant produces flexible stems which emit a sweet fragrance when their stalks undergo crushing. The flowers appear in axillary clusters, which display greenish-yellow to creamy white colors and feature a short corolla tube with five lobes that extend outward. The roots display a combination of thin and wiry traits with a light brown color and aromatic properties, which create a distinct fibrous pattern. These features match the traditional description of the authentic Ayurvedic medicine known as "Sariva."
3.1.2. Morphological characters of D. hamiltonii
Decalepis hamiltonii grows as a solid shrub that develops either in an upright position or through climbing. Its leaves grow in opposite directions and develop broad elliptic to ovate shapes with dimensions between 6 and 12 cm. The leaves of the plant display a main central vein that connects to a network of smaller veins. The plant produces its flowers, which grow in compact bundles that resemble umbel formations and have petals that show a color range between cream and pale yellow. The roots of the plant develop thick tuberous structures that resemble carrots, and they emit a strong, pleasant fragrance that sets them apart from the fibrous roots of H. indicus. The distinct physical characteristics of D. hamiltonii confirm its identification as the common adulterating herb known as "swallow root."
The present study used quantitative morphometric analysis to show statistically valid distinctions between H. indicus and D. hamiltonii regarding their vegetative characteristics. Decalepis hamiltonii leaves reached a size which exceeded the leaf dimensions of H. indicus because they showed statistically significant larger leaf dimensions with (p < 0.05) results. Hemidesmus indicus grows narrow leaves which match its growth pattern of climbing. The two species showed a root diameter difference because D. hamiltonii developed thick fleshy tuberous roots while H. indicus produced roots with (p < 0.05) thinner fibrous structure. The study found that H. indicus showed longer internodes than D. hamiltonii because of (p < 0.05) results. The morphometric measurements showed that each species maintained low internal variation while the two species exhibited distinct physical characteristics which scientists used to identify them.
3.1.3. Confirmation of correct taxon sampling
The process of morphological identification succeeded in correctly identifying true "Sariva" (H. indicus) specimens while separating them from the regularly used D. hamiltonii substitutes, which followed DNA extraction. The step was necessary to prevent misidentification, which occurs frequently in the raw-drug trade because of two factors: similar aroma and shared distribution areas. The authenticated and morphologically verified specimens served as the source material for subsequent DNA barcoding, sequence analysis, and phylogenetic confirmation.
3.2. DNA Extraction and PCR Amplification of the ITS2 Gene
Successfully extracted genomic DNA from samples of H. indicus and D. hamiltonii as shown in Figure 2A. The extracted DNA showed high purity because A???/A??? absorbance ratios ranged between 1.84 and 1.92, which showed that only small amounts of protein contamination existed. The NanoDrop spectrophotometric measurements showed that this DNA extraction produced enough material to conduct PCR experiments.
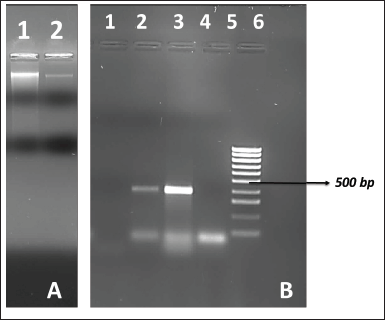 | Figure 2. Agarose gel electrophoresis of genomic DNA and ITS2 PCR amplification in H. indicus and D. hamiltonii. (A) Genomic DNA extraction showing intact high-molecular-weight DNA. Lane 1: Blank; Lane 2: H. indicus; Lane 3: D. hamiltonii. (B) PCR amplification of the ITS2 region. Lane 1: negative control; Lane 2: H. indicus; Lane 3: D. hamiltonii; Lanes 4–5: replicates; Lane 6: 100 bp DNA ladder. A clear band (~450 bp) confirms successful amplification in both species. [Click here to view] |
Agarose gel electrophoresis confirmed the quality of extracted DNA, which showed intact sharp bands that showed no signs of degradation (Fig. 2A). The successful amplification of both the ITS2 regions confirmed the efficiency of the extraction and PCR protocols employed. Universal primers (ITS2-S2F/ITS4R) produced two separate bands, which measured about 450 base pairs in both species (Fig. 2B). This band contains the ITS2 sequence together with short sections that extend from 5.8S and 28S rDNA. Researchers assembled the sequence and trimmed Low-quality terminal bases and flanking regions to obtain final ITS2 barcode lengths which measured 426 base pairs for H. indicus and 369 base pairs for D. hamiltonii. The successful amplification of the ITS2 region from both species confirmed the suitability of this marker for molecular authentication.
The kit-based methodology yielded high-quality DNA, supporting earlier research that validated commercial extraction kits as useful instruments for obtaining high-molecular-weight plant DNA that scientists may employ for genetic and sequencing investigations [16,17]. The amplification findings were constant throughout the whole set, demonstrating the efficacy and repeatability of the enhanced PCR test settings. Researchers utilized the nuclear ITS2 locus as a reliable source of sequence data for their phylogenetic analysis, barcoding procedure, and NCBI BLASTn search.
3.3. NCBI BLASTn and ITS2 Database Analysis
The ITS2 sequences obtained from H. indicus and D. hamiltonii were subjected to BLASTn analysis using the NCBI GenBank database to confirm species identity. Results showed high sequence homology with respective conspecific sequences deposited in GenBank, validating the molecular authenticity of both species.
For H. indicus, BLASTn alignment revealed 99.08% identity with GenBank accession MW090337.1, followed by 98.86% with JN712767.1 and 98.85% with OR910645.1. All top hits corresponded exclusively to H. indicus, with E-values ranging between 10?¹6² and 10?¹74, confirming high statistical significance (Table 2).
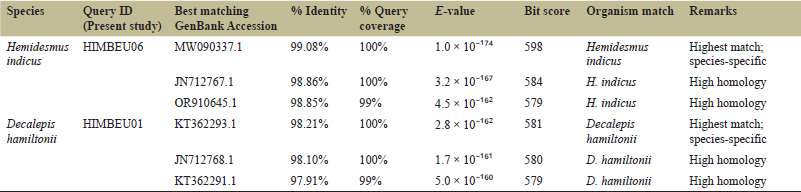 | Table 2. NCBI BLASTn results for ITS2 sequences of H. indicus and D. hamiltonii obtained in the present study. [Click here to view] |
Similarly, D. hamiltonii sequences exhibited 98.21% identity with KT362293.1 and JN712768.1, followed by 97.91% with KT362291.1, all corresponding to D. hamiltonii ITS sequences in GenBank. E-values ranged between 10?¹60 and 10?¹6², and bit scores exceeded 579, verifying precise molecular identification.
No cross-matches were detected between Hemidesmus and Decalepis, confirming that the amplified sequences were free of contamination and species-specific. The high sequence similarity and low E-values further substantiate the discriminatory power of ITS2 as barcode markers for species authentication.
These results are in agreement with previous barcoding studies that demonstrated ITS2 as efficient and reproducible markers for medicinal plant identification and adulteration detection [12,18].
3.3.1. NCBI genbank submission and accession numbers
High-quality ITS2 consensus sequences were generated by the study and subsequently deposited to the NCBI GenBank database. The accession number PX495088 was given to the sequence derived from H. indicus (sample HIMBEU06) and PX495104 to the sequence derived from D. hamiltonii (sample HIMBEU01). All validation requirements, including organism details, sequence measurements, and supplementary data, were met by the material submitted to GenBank. These sequences are available to researchers via GenBank, which enables them to use the information as reference barcodes in future phylogenetic and molecular authentication studies of Hemidesmus and allied species.
3.4. Phylogenetic Tree Analysis
The CLUSTALW alignment of ITS2 sequences from four H. indicus and four D. hamiltonii accessions showed distinctive nucleotide variations that belonged to specific species throughout both conserved and variable genomic sections. The internal sequence similarity of H. indicus sequences remained high while D. hamiltonii showed unique patterns of nucleotide substitutions together with specific insertion or deletion characteristics. The diagnostic Single Nucleotide Polymorhism (SNPs) together with the alignment signatures function as molecular markers which establish a genetic difference between authentic Sariva and its counterfeit version (Fig. 3). The evolutionary relationships among H. indicus, D. hamiltonii, and related taxa were inferred using the Neighbour-Joining (NJ) algorithm implemented in MEGA X version 12 under the Kimura 2-Parameter (K2P) model. Bootstrap analysis with 2,000 replications evaluated the robustness of the tree topology. Pairwise genetic distance analysis based on the Kimura 2-Parameter (K2P) model revealed very low intraspecific divergence within each species, whereas interspecific divergence between H. indicus and D. hamiltonii was markedly higher. The absence of overlap between intra- and interspecific distances indicates a clear barcode gap, confirming the strong discriminatory power of the ITS2 marker for distinguishing these two taxa.
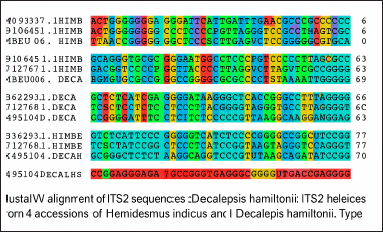 | Figure 3. Color-coded CLUSTALW multiple sequence alignment of ITS2 regions from Hemidesmus indicus and Decalepis hamiltonii. Alignment of ITS2 sequences from four accessions of each species showing conserved and variable nucleotide positions. Conserved regions indicate sequence similarity, while species-specific substitutions and indels distinguish H. indicus from D. hamiltonii, particularly within structurally important ITS2 regions. These diagnostic differences support species identification and downstream phylogenetic and molecular marker analyses.. [Click here to view] |
The phylogenetic tree for H. indicus showed that all accessions, including the present study sequence (HIMBEU06), formed a distinct monophyletic clade supported by moderate to strong bootstrap values (Fig. 4). The present sample clustered closely with the Kerala accession (MW090337.1); however, the bootstrap value (44%) indicates moderate support for this node. In contrast, D. hamiltonii accessions clustered separately into another well-supported monophyletic clade with bootstrap values of 33%–75% (Fig. 5). The study sequence (HIMBEU01) grouped tightly with Bengaluru accessions (KT362297.1, KT362299.1, KT362296.1), confirming species-level coherence. The two Apocynaceae species maintained evolutionary distance from one another, as evidenced by the outgroup species Catharanthus roseus (MH069885.1) occupying a distinct branch that established proper tree roots. For H. indicus and D. hamiltonii, the optimized trees' total branch lengths were 1.299 and 1.338, respectively. After using the pairwise deletion procedure to eliminate all ambiguous sites, the final dataset had 852 aligned positions and 893 aligned positions.
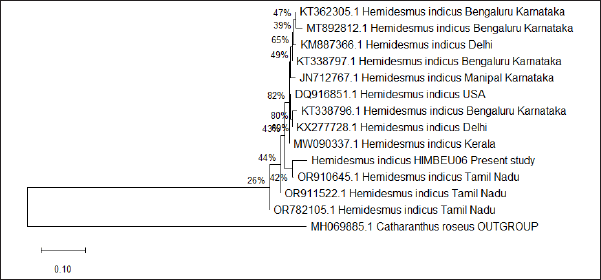 | Figure 4. Neighbour-Joining (NJ) phylogenetic tree of Hemidesmus indicus based on ITS2 sequences. Tree constructed using the Kimura 2-Parameter model with 2,000 bootstrap replications. The present study sequence (HIMBEU06) clusters within a monophyletic H. indicus clade comprising authenticated accessions from multiple regions. Bootstrap values are shown at nodes. Catharanthus roseus was used as the outgroup. The clustering confirms species identity and supports ITS2-based molecular authentication. [Click here to view] |
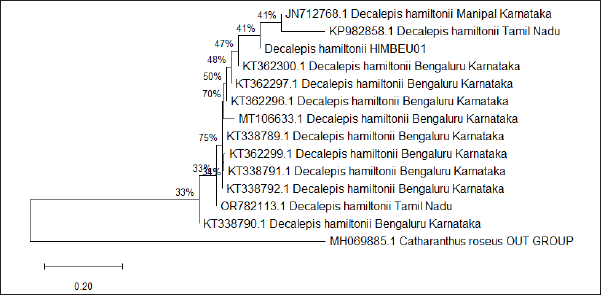 | Figure 5. Neighbour-Joining (NJ) phylogenetic tree of Decalepis hamiltonii based on ITS2 sequences. The tree was constructed through the Kimura 2-Parameter model by using 2,000 bootstrap replications. The present study sequence (HIMBEU01) groups within a well-supported monophyletic Decalepis hamiltonii clade with reference accessions from different regions. The bootstrap values were displayed at the nodes while Catharanthus roseus served as the outgroup for the study. The clustering results confirm the species identity of the specimen while showing that ITS2 functions as an effective barcode marker. [Click here to view] |
3.4.1. ML phylogenetic analysis
Using ML Phylogenetic reconstruction with ITS2 sequencing data, the study produced two unique monophyletic clades for H. indicus and D. hamiltonii that could be recognized as different species. The research used C. roseus as an outgroup which established a separate branch while showing the required genetic distance from all other taxa.
The H. indicus ML tree showed all reference accessions forming a tight cluster which demonstrated that samples from different regions maintained consistent genetic traits. The sequence generated in the present study (HIMBEU06) established itself as a member of the H. indicus clade because it showed close genetic relationships with existing Indian sequences (Fig. 6). The study confirmed evolutionary patterns through bootstrap testing which showed strong to moderate support at essential nodes for the ITS2 evolutionary pattern within this group of species.
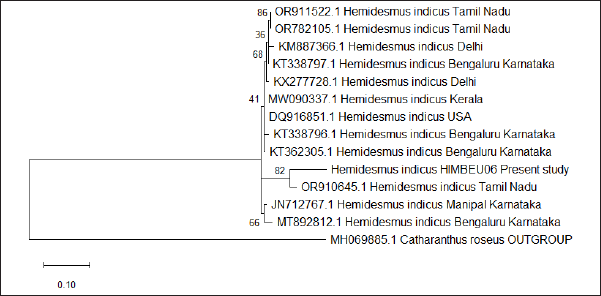 | Figure 6. Maximum Likelihood (ML) phylogenetic tree of Hemidesmus indicus based on ITS2 sequences. The present study sequence clusters within the H. indicus clade, with Catharanthus roseus as the outgroup, confirming species identity. [Click here to view] |
The D. hamiltonii ML tree showed all accessions forming a tight grouping which established clear species-level connections among them. The researchers obtained the sequence from study (HIMBEU01) which showed D. hamiltonii lineage relationships with different GenBank reference sequences, while strong bootstrap support confirmed these relationships (Fig. 7). The sequences shared a tight grouping which showed that species maintained low genetic differences, while the study proved that ITS2 can be trusted for taxonomic analysis.
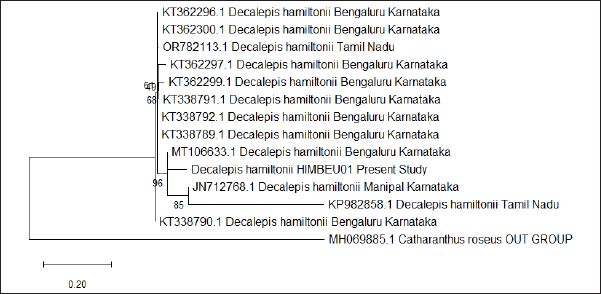 | Figure 7. ML phylogenetic tree of D. hamiltonii based on ITS2 sequences. The present study sequence clusters within the D. hamiltonii clade, with C. roseus as the outgroup, confirming species identity. [Click here to view] |
The ML phylogenetic analysis results show strong species-level clustering together with minimal intraspecific divergence and clear outgroup separation from the studied species. The current research used sequence data, which placed their results into reference clades to establish correct species identification while demonstrating ITS2 functioned as a dependable molecular authentication marker.
The two clustering methods NJ and ML produced identical results which demonstrate that the ITS2 dataset successfully determines species relationships among the studied taxa. The two phylogenetic inference methods produced consistent results which proved ITS2 functioned as an effective barcode marker to differentiate between closely related medicinal plant species.
The study demonstrated separate genetic boundaries between two species which made it impossible to determine their shared evolutionary development. The study results demonstrate that DNA barcoding together with phylogenetic reconstruction establishes a dependable molecular method for identifying authentic H. indicus which represents the real Sariva of Ayurveda from its common adulterant D. hamiltonii in herbal drug commerce.
The K2P model served as the basis for genetic distance analyses because it functions as the standard substitution model which researchers use in plant DNA barcoding studies to analyze genetic material. The study used ITS2 sequences which were combined with reference sequences from GenBank to create an alignment which MUSCLE produced in FASTA/PHYLIP format for later examination. The MEGA X software calculated K2P pairwise distances through the Compute Pairwise Distances function which users accessed from the Models/Methods menu to select the K2P substitution model that applied uniform rates across all sites. A strong barcode gap is established by the clear divergence between maximum intraspecific distances and lowest interspecific distances. Additionally, boxplot and histogram analyses that showed distinct genetic divergence ranges were used to represent the distribution of K2P distances (Table 3).
 | Table 3. K2P genetic divergence values for ITS2 sequences of H. indicus and D. hamiltonii. [Click here to view] |
The study calculated interspecific divergence by examining all Hemidesmus and Decalepis accessions which produced a matrix of inter-taxon distances (Table 4). The study used divergence values to assess whether a barcode gap existed which showed interspecific variation that was much greater than intraspecific variation because this factor serves as the main test for determining barcode marker discrimination capacity. The quantitative metrics provide additional evidence for species delimitation while enhancing the precision of ITS2-based authentication.
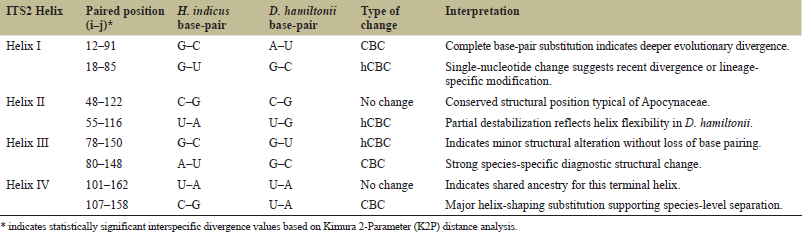 | Table 4. Comparative CBC and hCBC analysis of ITS2 helices between H. indicus and D. hamiltonii. [Click here to view] |
The researchers discovered compensatory base changes (CBCs) and hemi-CBCs through their structural research of ITS2 secondary structure. The researchers used ITS2 Database/Workbench and RNAfold to create secondary structure models which they verified through sequence-structure alignment. The researchers discovered CBCs and hemi-CBCs by analyzing paired nucleotide positions within homologous helices of the ITS2 structure. The researchers confirmed all changes through their manual examination of aligned base-pairing regions which ensured they correctly interpreted structural changes. The combined computational method together with the manual method established strong proof of structural variations that existed between the different taxa.
The analysis of ITS2 motifs serves as an effective method that scientists use to determine species boundaries and trace evolutionary relationships among plants. The ITS2 region contains several highly conserved sequence motifs such as the characteristic Thymine-Guanine-Guanine-Thymine motif and cytosine-adenine-adenine-guanine motif motifs which exist near the 5′ and 3′ ends of the ITS2 transcript. The structural motifs serve as necessary rRNA processing anchors that retain their architectural function across different genera, while their internal sections develop unique changes that distinguish various species. The researchers used H. indicus and D. hamiltonii to map these motifs, which confirmed the correct placement of ITS2 boundaries and showed which parts were stable and which were unstable.
The NJ method enabled phylogenetic reconstruction which confirmed the observed taxonomic differentiation. The two taxa established two separate monophyletic clades which received strong support when researchers used C. roseus as an outgroup to demonstrate their evolutionary relationship with Apocynaceae. The research conducted by Yao et al. [19] and Mishra et al. [8] demonstrated identical clustering patterns while they used ITS-based trees to identify hidden species in Indian medicinal plants. The genetic separation between H. indicus and D. hamiltonii becomes evident through their completely distinct genetic branches which demonstrate that D. hamiltonii does not represent the authentic "Sariva" but instead functions as an alternative plant. The ITS2 region contains species-specific identification markers which exist beyond its conserved sequence elements and particularly occur within ITS2 secondary structure loop regions and helices. Scientists can use the diagnostic SNP positions to create molecular signatures which will help them identify the different species through ITS2 sequence comparison between both species. The diagnostic SNPs can develop SCAR markers which will create species-specific tools that improve herbal authentication practices.
The study of RNA secondary structure through comparative analysis helps researchers detect CBCs and hemi-CBCs which exist in the paired helices. A CBC occurs when both nucleotides in a paired base change, but the base-pairing remains intact (e.g., GC → AU), indicating deeper evolutionary separation. In contrast, hCBCs involve a change in only one nucleotide of the pair (e.g., GC → GU), which often shows more recent evolutionary development. The existence of one CBC between two plant taxa establishes a strong connection to reproductive isolation, while hCBCs demonstrate species-level differentiation that does not require the existence of speciation barriers. Scientists should use CBCs and hCBCs to compare H. indicus and D. hamiltonii because this method will provide structural evidence that supports sequence-based distinctions between the two species, which will enhance animal species identification (Table 4).
The researchers evaluated the phylogenetic inference strength by comparing the results from NJ and ML methods. The two approaches created matching tree diagrams which showed H. indicus and D. hamiltonii as separate monophyletic groups. The study results show that the present research generated sequences which consistently matched their reference clades because the ITS2 dataset maintained its phylogenetic signal across different analytical methods. The different phylogenetic methods produce matching results which demonstrate that ITS2 can effectively distinguish between species and validate the medicinal plant identification process.
3.5. DNA Barcoding and ITS2 Secondary Structure Prediction
The Bio-Rad DNA Barcode Generator tool enabled the creation of separate DNA barcodes for H. indicus and D. hamiltonii through its analysis of the aligned ITS2 sequences. The barcode's colored stripes function as visual markers that display distinct nucleotide differences throughout the ITS2 region, enabling quick identification of the two different species (Fig. 8).
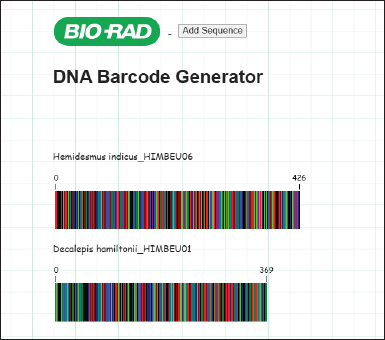 | Figure 8. DNA barcode visualization of ITS2 sequences for H. indicus and D. hamiltonii. The ITS2 consensus sequences of the two species produce different species-specific barcodes which display unique color patterns based on nucleotide differences. The two species show distinct molecular authentication through their different barcode profiles which allow for fast visual identification. [Click here to view] |
The barcode generated for H. indicus (Hemidesmus_indicus_06) spanned 426 bp, while D. hamiltonii (Decalepis_hamiltonii_ITS2) showed a shorter sequence of 369 bp, reflecting locus-specific variation. The barcode generated for H. indicus displayed a higher density of alternating color bands, reflecting greater nucleotide variation along the ITS2 region. The uniform color pattern in D. hamiltonii showed that the species contained conserved sequence blocks which had only a few polymorphic sites. The unique barcode signatures of each species function as molecular identity codes which digital databases use to store their information, enabling authentication and adulterant detection in raw herbal materials.
The two species showed distinct length differences because their aligned ITS2 sequences produced different results. The ITS2 barcode region measured 426 bp in H. indicus and 369 bp in D. hamiltonii. The difference in length occurs because different species have unique insertions and deletions (indels) that affect their ITS2 spacer region, a characteristic that exists in all nuclear ribosomal DNA. The process of alignment required removing low-quality terminal bases which resulted in shorter consensus sequences for barcode analysis.
The two species showed MFE structures which displayed typical stem-loop patterns found in ITS2 transcripts. The predicted MFE structure for H. indicus showed ΔG = −171.30 kcal mol?¹ and contained five separate helices that extended from a central loop which had properly matched stems and secure end loops. The centroid structure (Fig. 9) showed a strong resemblance to the MFE model which demonstrated high folding stability and reliable base-pairing probabilities throughout the central area. The mountain plot showed moderate positional entropy (0.2–0.4) which demonstrated that conserved helices had restricted ability to change their structure.
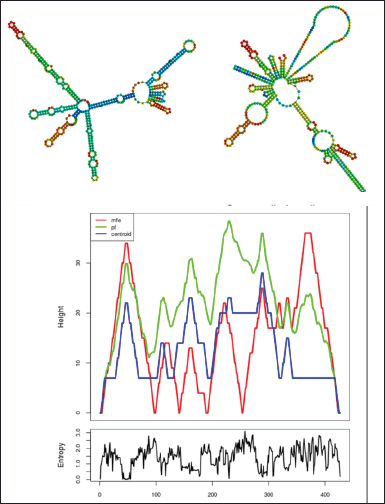 | Figure 9. Shows the predicted ITS2 RNA secondary structure of H. indicus (HIMBEU06) which was produced by RNAfold (ViennaRNA Package). The MFE results together with centroid structures demonstrate a multi-helical ITS2 folding pattern which occurs through the central loop. The mountain and entropy plots display the folding profile together with positional variability, which demonstrates that the ITS2 structure remains stable and can be used to identify different species. [Click here to view] |
Decalepis hamiltonii showed an MFE value of ΔG = −156.80 kcal mol?¹ while it had a longer asymmetric secondary structure element, which we show in Figure 10. The model showed three primary helices which included larger internal loops together with unpaired sections that resulted in reduced thermodynamic stability. The mountain plot showed elevated entropy peaks within the 150–300 bp range which indicated that the section of the ITS2 molecule displayed increased variation together with less strict base pairing.
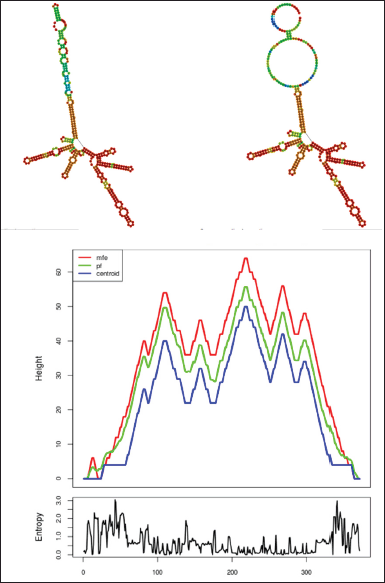 | Figure 10. Shows D. hamiltonii RNA secondary structure prediction through ITS2 RNA testing which RNAfold (ViennaRNA Package) generated. The MFE and centroid structures demonstrate an asymmetric folding pattern which includes extended helices and loop regions that show different lengths. The mountain and entropy plots display structural variations which demonstrate specific ITS2 characteristics that differentiate D. hamiltonii from H. indicus. [Click here to view] |
The analysis of ITS2 secondary structures showed that the two species exhibited different folding patterns and energy characteristics which demonstrated their genetic distinction through RNA structural differences. The greater stability observed in H. indicus may reflect conserved ITS2 motifs whereas D. hamiltonii shows reduced stability because of sequence changes that occur in its loop regions. The combined results from barcode patterns and RNAfold models create two types of molecular evidence that scientists use to authenticate species and identify irregularities within the Hemidesmus–Decalepis complex.
The ITS2 fold of H. indicus demonstrates greater thermodynamic stability because its structure contains five distinct helices and shows minimal molecular movement. The D. hamiltonii organism displays a structural design which extends beyond normal limits while showing reduced structural integrity because it contains extensive loops and fewer helices and exhibits increased movement freedom at its various positions. The structural variations between both species demonstrate that ITS2 functions as an effective species identification marker for these two organisms (Table 5).
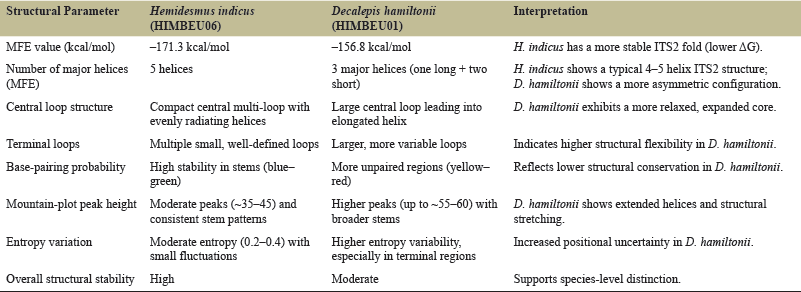 | Table 5. Comparative summary of ITS2 secondary-structure features of H. indicus and D. hamiltonii predicted using RNAfold. [Click here to view] |
The ITS2 secondary-structure predictions from RNAfold provide an extra validation method. Hemidesmus indicus showed better stability through its MFE structure, which had an energy value of ΔG = –171.30 kcal mol?¹ and its design included distinct helical structures together with preserved loop patterns. The D. hamiltonii specimen displayed a more relaxed configuration which had an energy value of ΔG = –156.80 kcal mol?¹ and its design included longer loops together with increased positional disorder. Scientists have successfully used secondary-structure differences to distinguish between medicinal species that belong to the same genus [20]. The relationship between sequence divergence and RNA-structural topology establishes ITS2 as a reliable genetic and structural marker used for authentication purposes.
3.5.1. ITS2 secondary structure comparison
Comparative analysis of ITS2 secondary structure revealed clear structural differences between H. indicus and D. hamiltonii. Hemidesmus indicus exhibited a more complex folding pattern characterized by longer helical extensions, multiple internal loops, and extensive branching. In contrast, D. hamiltonii showed a comparatively compact architecture with fewer branches and a more prominent terminal loop. These consistent structural distinctions provide additional evidence for species-level differentiation. The principal structural features distinguishing the two taxa are summarized in a simplified schematic diagram (Fig. 11).
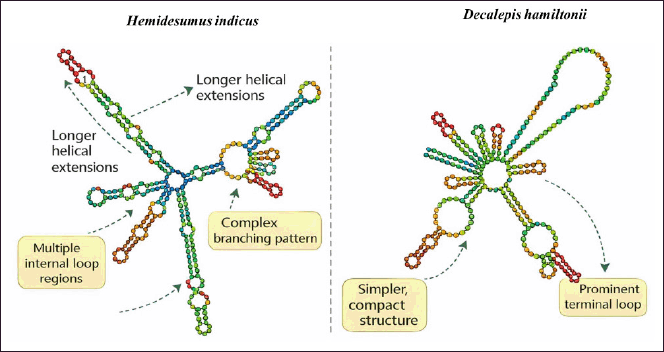 | Figure 11. Schematic comparison of ITS2 secondary structures in H. indicus and D. hamiltonii, highlighting key structural differences. [Click here to view] |
Species identification needs to be correct because it serves as the basis for understanding which bioactive compounds exist in the species and how those compounds will produce consistent therapeutic results. The presence of D. hamiltonii in Ayurvedic products through incorrect identification or through product contamination will result in changes to the phytochemical profile which brings about unpredictable medicinal effects. The application of DNA barcoding within raw-material procurement pipelines allows companies to conduct swift checks on their products' species origins which results in better quality control practices that the World Health Organization recommends for traditional medicines. The ITS2 molecular authentication system enables businesses to conduct standard quality checks on their herbal products which include raw materials and processed powders and commercial products. The system provides an accurate identification method that works better than visual methods which use morphology to identify materials in their crushed or processed conditions.
The herbal industry cannot use molecular authentication because it brings multiple operational difficulties which affect their regular business processes. The operational challenges include expenses related to molecular reagents and sequencing which create a need for particular laboratory equipment and for experts who can perform DNA extraction and amplification and bioinformatic analysis. The particular requirements create obstacles for small-scale herbal producers and traditional supply chains because they need institutional or regulatory assistance to meet those requirements. Future research needs to create budget-friendly testing solutions which use rapid diagnostic technologies such as PCR-based marker assays and portable sequencing systems that can be integrated into standard quality control processes.
The study results show essential conservation value for their research. Hemidesmus indicus populations have declined in several regions of peninsular India due to overharvesting and habitat loss [6]. The use of precise molecular markers enables tracing genuine germplasm which supports ex-situ conservation efforts and prevents illegal harvesting of wild species. The medicinally valuable species will reach permanent sustainability through the use of genetically confirmed breeding materials. Regulatory bodies can use molecular traceability to track commercial activities while discovering trade practices that endanger at-risk wildlife populations.
The use of ITS2 barcodes, supported by BLAST confirmation, phylogenetic inference, and RNAfold-based secondary-structure prediction, provides a comprehensive molecular framework for the accurate identification of H. indicus and its adulterant D. hamiltonii. The research results show that molecular data serve as essential elements for attaining exact taxonomic identification and confirming pharmacognostic validity and managing medicinal plant conservation efforts throughout India and other countries. Previous studies have similarly demonstrated the effectiveness of ITS2 as a highly discriminatory barcode for medicinal plants [11–13,16]. The current study findings validate these previous reports which demonstrate that ITS2 shows strong power to identify various species.
ITS2 demonstrates strong ability to discriminate between species but faces challenges when it needs to differentiate between different populations that exist in geographically separate areas or between closely related species with recent evolutionary changes. The genetic structure of populations and the identification of small-scale phylogeographic differences require more than the information provided by ITS2. The present study used ITS2 as a reliable method to authenticate species at the species level. The present study shows that ITS2-based barcoding can accurately identify different species for pharmacognostic authentication, but its diagnostic capabilities improve when researchers use multiple genetic markers to achieve better genetic identification. Researchers should conduct studies that use multiple geographic areas to examine how different populations vary while developing straightforward diagnostic tests based on confirmed barcode sequences that industries can easily implement.
4. CONCLUSION
This study established a reliable molecular framework for authenticating H. indicus and distinguishing it from the common adulterant D. hamiltonii using ITS2-based DNA barcoding. Based on its high amplification success, short sequence length, and strong interspecific variability, the ITS2 region was selected as the primary barcode marker in this study to differentiate H. indicus from its common substitute D. hamiltonii. The ITS2 sequences showed species-specific lengths (426 bp in H. indicus and 369 bp in D. hamiltonii) with distinct nucleotide substitutions and indels that generated a clear barcode gap between the taxa. Phylogenetic reconstruction using both Maximum Likelihood and Neighbor-Joining methods consistently resolved each species into separate monophyletic clades. In addition, comparative ITS2 secondary-structure analysis revealed distinct folding topologies and minimum free energy values between the two species. These combined molecular features provide reliable diagnostic markers for authenticating Sariva in the herbal drug trade and support the use of ITS2 as a robust barcode for medicinal plant quality control.
5. ACKNOWLEDGMENTS
The authors express their gratitude to The Himalaya Wellness Company for providing the technical support together with research facilities and scientific guidance. This enabled successful completion of the study. This work forms a part of the doctoral research of the first author.
6. AUTHORS’ CONTRIBUTIONS
All authors made substantial contributions to conception and design, acquisition of data, or analysis and interpretation of data; took part in drafting the article or revising it critically for important intellectual content; agreed to submit to the current journal; gave final approval of the version to be published; and agree to be accountable for all aspects of the work. All the authors are eligible to be author as per the International Committee of Medical Journal Editors (ICMJE) requirements/guidelines.
7. FUNDING
There is no funding to report.
8. CONFLICTS OF INTEREST
The authors declare that some of them (Raghavendra Polasam, Gururaj Chalageri, Kannan Ramamirtham, and Uddagiri Venkanna Babu) are affiliated with the Botanical Extraction Unit at Himalaya Wellness Company, Bengaluru, India. This affiliation did not influence the study design, methodology, data collection, analysis, interpretation, or the decision to publish. The company provided only logistical and infrastructural support, and no commercial or financial interests influenced the outcomes of this work.
9. ETHICAL APPROVALS
This study does not involve experiments on animals or human subjects.
10. DATA AVAILABILITY
All the data is available with the authors and shall be provided upon request.
11. PUBLISHER’S NOTE
The authors of this article present their claims which do not reflect the views of the publisher or the editors or the reviewers. The journal maintains its neutral stance about jurisdictional claims which appear in the institutional affiliation information of its published content.
12. USE OF ARTIFICIAL INTELLIGENCE (AI)-ASSISTED TECHNOLOGY
The authors declare that they have not used artificial intelligence (AI)-tools for writing and editing of the manuscript, and no images were manipulated using AI.
REFERENCES
1. World Health Organization. WHO Traditional Medicine Strategy 2014–2023. World Health Organization, Geneva, 2013.
2. World Health Organization. WHO Global Atlas of Traditional, Complementary and Alternative Medicine. WHO, Geneva, 2005.
3. Ministry of AYUSH, Government of India. The Ayurvedic Pharmacopoeia of India. Part I, Volume IX. Government of India, New Delhi, 2016. Monograph: Sariva (Hemidesmus indicus (L.) R.Br.).
4. Chatterjee A, Pakrashi SC. The Treatise on Indian Medicinal Plants. Publications and Information Directorate (CSIR), New Delhi, pp 55–60, Vol. 4, 1995. (Section covering Hemidesmus indicus).
5. Ved DK, Saha D, Ravikumar K. Medicinal Plants of India: Guidelines for Conservation Assessment and Management. Foundation for Revitalisation of Local Health Traditions (FRLHT), Bengaluru, 2016.
6. Ravikanth G, Ved DK, Ganeshaiah KN, Uma Shaanker R. Conservation and sustainable utilization of medicinal plants of India: priorities and approaches. Curr Sci 2000;79(9):1229–34.
7. Mishra P, Kumar A, Nagireddy A, Mani DN, Shukla AK, Tiwari R, et al. DNA barcoding: an efficient tool to overcome authentication challenges in the herbal market. Plant Biotechnology Journal. 2015;14(1):8–21. CrossRef
8. Mishra P, Kumar A, Sivaraman G, Shukla AK, Kaliamoorthy R, Slater A, et al. Character-based DNA barcoding for authentication and conservation of IUCN Red listed threatened species of genus Decalepis (Apocynaceae). Sci Rep 2017:2;7(1). CrossRef
9. Vassou SL, Nithaniyal S, Raju B, Parani M. Creation of reference DNA barcode library and authentication of medicinal plant raw drugs used in Ayurvedic medicine. BMC Complement Altern Med 2016;16:186. CrossRef
10. Rai PS, Bellampalli R, Dobriyal RM, Agarwal A, Satyamoorthy K, Anantha Narayana DB. DNA barcoding of authentic and substitute samples of herbs belonging to Asparagaceae and Asclepiadaceae based on ITS2 region. J Ayurveda Integr Med 2012;3(3):136–40. CrossRef
11. Chen S, Yao H, Han J, Liu C, Song J, Shi L, et al. Validation of the ITS2 region as a novel DNA barcode for identifying medicinal plant species. PLoS One 2010;5(1):e8613. CrossRef
12. Li De Z, Gao LM, Li HT, Wang H, Ge XJ, Liu JQ, et al. Comparative analysis of a large dataset indicates that internal transcribed spacer (ITS) should be incorporated into the core barcode for seed plants. PNAS 2011;108(49):19641–19646.. CrossRef
13. Pang X, Shi L, Song J, Chen X, Chen S. Use of the potential DNA barcode ITS2 to identify herbal materials. J Nat Med. 2012:67(3):571–5. CrossRef
14. Gao T, Yao H, Song J, Zhu Y, Liu C, Chen S. Evaluating the feasibility of using candidate DNA barcodes in discriminating species of medicinal plants. BMC Evol Biol 2010;10:324. CrossRef
15. Mahima K, Kumar KNS, Rakhesh KV, Rajeswaran PS, Sharma A, Sathishkumar R. Advancements and future prospective of DNA barcodes in the herbal drug industry. Front Pharmacol 2022;13:947512. CrossRef
16. Polasam R, Ganesh P, Chalageri G, Kannan R, Babu UV. DNA barcoding and phylogenetic analysis of Indian Phyllanthus using nrITS and chloroplast rbcL gene sequences for molecular identification. J Appl Biol Biotech. 2025;13(2):232–241. CrossRef
17. Inglis PW, Mata LR, da Silva MJ, Vieira RF, Alves RBN, Silva DB, et al. DNA barcoding for the identification of Phyllanthus taxa used medicinally in Brazil. Planta Med 2018;84(17):1300–10. CrossRef
18. CBOL Plant Working Group, Hollingsworth PM, Forrest LL, Spouge JL, Hajibabaei M, Ratnasingham S, van der Bank M, et al. A DNA barcode for land plants. Proc Natl Acad Sci USA 2009;106(31):12794–7. CrossRef
19. Yao H, Song J, Liu C, Luo K, Han J, Li Y, et al. Use of ITS2 region as the universal DNA barcode for plants and animals. PLoS One 2010;5(10):e13102. CrossRef
20. Coleman AW. ITS2 is a double-edged tool for eukaryote evolutionary comparisons. Trends Genet 2003;19(7):370–5. CrossRef