
1. INTRODUCTION
Estimates of the number of species in Phyllanthus, the largest genus in the Phyllanthaceae family, range from 750 to 1200 highlighting its remarkable diversity [1,2]. This genus, includes shrubs, climbers, floating aquatics, annual and perennial herbs, and pachycaulous succulents. Certain species are characterized by cladodes or flattened stems resembling leaves. Phyllanthus is one of the most diverse genera of seed plants, and it exhibits an astounding range of pollen types, chromosome counts, and floral morphologies. For precise species identification and classification using genetic data, molecular taxonomy is essential because it sheds light on evolutionary links that are sometimes not evident from morphology alone. It assists in resolving intricate taxonomic problems, guaranteeing accurate species identification and a genetic understanding of biodiversity.
The most commonly used species for treating human ailments belongs to the sub-genera Cicca, Kirganelia, and Phyllanthus. These plants have been utilized in herbal remedies for centuries in China, Brazil, India, and Southeast Asian countries [3]. They contain various bioactive compounds, including alkaloids, flavonoids, lignans, tannins, and phenolic compounds. These substances exhibit numerous pharmacological activities, including hepatoprotective, immunomodulatory, antibacterial, antioxidant, and anti-inflammatory properties [4]. For instance, Phyllanthus niruri, commonly known as “Chanca Piedra” or “Stone Breaker,” is renowned for its effectiveness in treating viral infections, liver conditions, and kidney stones [5,6].
However, identifying Phyllanthus species based on morphology poses significant challenges. Due to their physical similarities, different species are frequently confused with one another, resulting in misidentification—substituting genuine plant materials with unrelated or similarly shaped plants [7]. This problem jeopardizes the safety and efficacy of herbal products. In response to these issues, DNA barcoding has emerged as an important method for species identification. In order to reliably identify species, DNA barcoding entails sequencing a short, standardized segment of the genome, which is then compared against a reference database.
Due to its high variability among species and adequate conservation within species, the internal transcribed spacer 2 (ITS2) region located between the 5.8S and 28S ribosomal RNA gene has been identified as a reliable DNA barcode for distinguishing closely related species, ensuring the authenticity and quality of botanical substances used in various plant-based product. It provides accurate species-level identification unaffected by intraspecific variations, making it the preferred choice for distinguishing Phyllanthus species when compared to other areas such as Maturase K (matK) and trnH-psbA spacer [8,9,10]. Additionally, the extensive reference databases for ITS2 enhance its reliability by providing comprehensive comparison resources. The ribulose 1,5-biphosphate carboxylase (rbcL) gene, which encodes the large subunit of the ribulose-1,5-bisphosphate carboxylase/oxygenase enzyme, plays a vital role in photosynthesis. The rbcL gene is a critical component in plant biology, being a valuable tool for genetic identification, evolutionary studies, and ecological research [11].
Many Phyllanthus species share overlapping morphological traits, leading to misidentification or confusion in species classification. The genus has over 60 species in India, but there is a lack of precise diagnostic tools for accurate identification. Although DNA barcoding (using genes like rbcL, matK, ITS, and so on) has been used to some extent, the coverage is sparse, and many species remain uncharacterized at the molecular level. There is a lack of whole-genome sequencing or comprehensive genomic resources for most Indian Phyllanthus species. This limits our understanding of genetic diversity, population structure, and evolutionary relationships within the genus. There is a gap in exploring and documenting the medicinal properties and bioactive compounds of lesser-known species compared to well-researched ones like Phyllanthus amarus. The primary aim of this study is to molecularly identify Phyllanthus species, specifically focusing on the ITS2 region and rbcL gene. This approach is designed not only to advance taxonomic and pharmacological research but also seeks to prevent adulteration and ensure the authenticity of herbal products. By accurately identifying species, DNA barcoding supports evidence-based herbal medicine development, promotes biodiversity conservation, and fosters the sustainable use of Phyllanthus species.
2. MATERIALS AND METHODS
2.1. Ethical Statement
All necessary authorizations were obtained in compliance with ethical standards for collecting plant samples used in this study. The landowners of the farms from which the samples were taken consented. Furthermore, the specimens were evaluated and authenticated at the Himalaya Wellness Herbaria, Bengaluru, in adherence to national and local plant collection regulations. It is important to note that the plant material used in this study was collected from the wild.
2.2. Collection of Plant Materials
Five Phyllanthus species—P. maderaspatensis, P. amarus, P. urinaria, P. virgatus, and P. tenellus were carefully collected as mature specimens from various locations in Karnataka and Tamilnadu. Strong, fresh, and healthy plant parts served as the basis for selecting these species (Fig. 1; Table 1). The specimens were examined and validated at the Herbaria of the Himalaya Wellness Company in Bengaluru, ensuring accurate identification and verification. This organization offers reliable reference materials and plant specimens for scientific research. By adhering to rigorous identification and authentication protocols, researchers ensured the authenticity of the plant samples, with leaves being the primary source of DNA for each specimen.
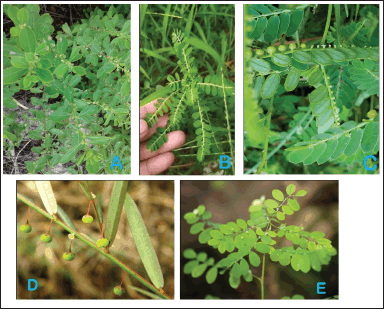 | Figure 1. Systematic collection of mature Phyllanthus species and DNA barcoding. The systematic collection of mature plants of five Phyllanthus species, including (A) Phyllanthus maderaspatensis, (B) Phyllanthus amarus, (C) Phyllanthus urinaria, (D) Phyllanthus virgatus, and (E) Phyllanthus tenellus, from diverse locations across India is illustrated. The plants were carefully selected for their healthy, fresh, and succulent appearance. [Click here to view] |
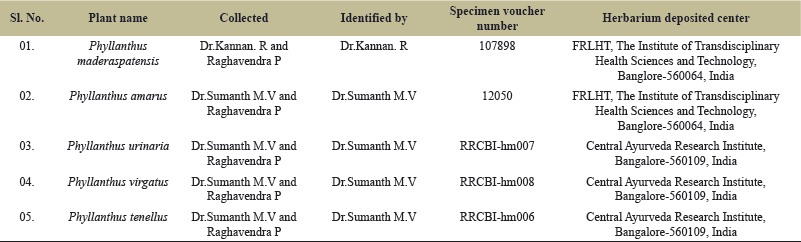 | Table 1. Collection, identification, specimen voucher, and herbarium deposition details of Indian Phyllanthus species. [Click here to view] |
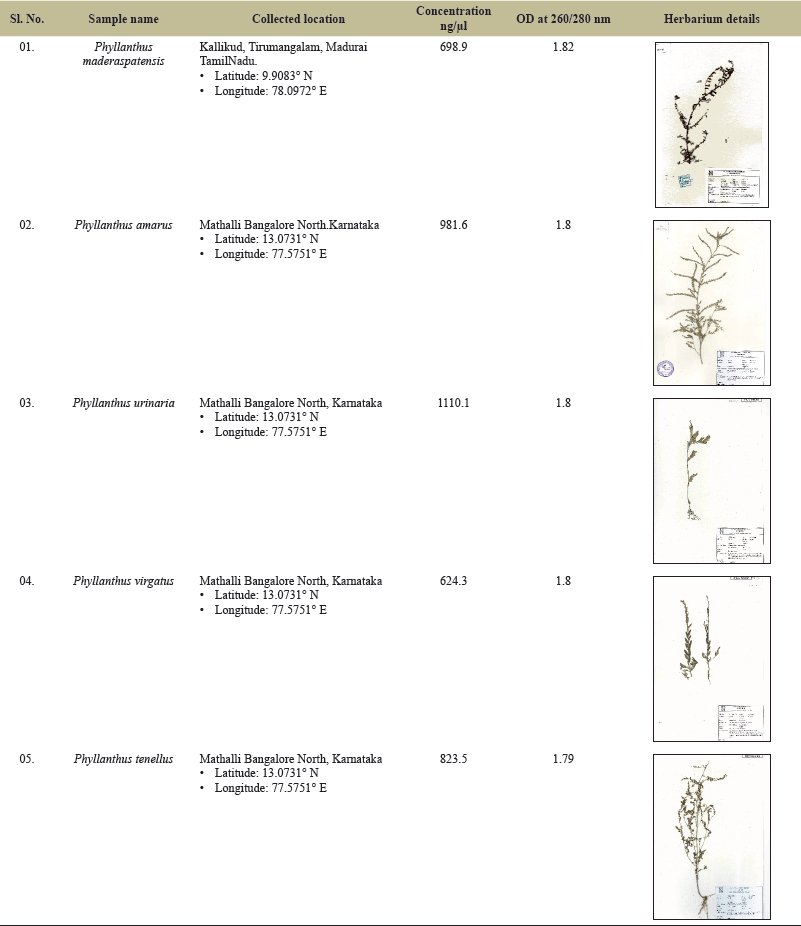 | Table 2. Analysis of concentration, wavelength absorbance readings and rates for the Phyllanthus plant samples. [Click here to view] |
2.3. DNA Extraction and Analysis
DNA extraction was performed using the NucleoSpin® Plant II DNA Kit (MACHEREY-NAGEL, Germany). To evaluate the quality of the extracted DNA, 5 µl of the sample and 5 µl of 6X loading dye (HiMedia Laboratories, India) were loaded onto a 0.8% agarose gel along with a 1 kb DNA ladder and electrophoresed at 100 V for 1 hour. The gel was visualized using a UV Gel documentation system (Vilber, France) [12]. DNA quantification was carried out with a NanoDrop One spectrophotometer (Thermo Scientific, UK), measuring 2 µl of the DNA sample at 260/280 nm OD.
2.4. PCR Amplification of ITS2 and rbcL Gene
2.4.1. ITS2 amplification
Universal primers ITS2-S2F (5’-ATGCGATACTTGGTGTGAAT-3’) and ITS4R (5’-TCCTCCGCTTATTGATATGC-3’) were used in PCR with the ProFlexTM PCR system (Applied Biosystems). The reaction mixture contained 2X PCR Taq master mix (MBT061-HiMedia), 10 µM forward and reverse primers (Sigma), DNA template (20 ng/µl for ITS2), and nuclease-free water. The PCR cycling conditions were: initial denaturation at 94°C for 1 minute; 30 cycles of 94°C for 30 seconds, 55°C for 20 seconds, and 72°C for 30 seconds; final extension at 72°C for 7 minutes.
2.4.2. rbcL amplification
Primers rbcL1F (5’-ATGTCACCACAAACAGAAACTAAAGC-3’) and rbcL724R (5’-TCGCATGTACCTGCAGTAGC-3’) were used. The PCR reaction included 2X PCR Taq master mix, 10 µM forward and reverse primers, DNA template (~50 ng for rbcL), and nuclease-free water. The PCR conditions were: initial denaturation at 95°C for 5 minutes; 30 cycles of 95°C for 30 seconds, 55°C for 30 seconds, and 72°C for 1 minute; final extension at 72°C for 7 minutes.
Amplified products were analyzed on a 1.5% agarose gel stained with ethidium bromide and purified using the NucleoSpin® Gel and PCR Clean-up Kit.
2.5. DNA Sequencing
To evaluate the successful amplification of ITS2 and rbcL gene from Phyllanthus species, PCR products were analyzed using 1.5% agarose gel electrophoresis. With confirmation of successful amplification, the amplicons were subjected to Sanger sequencing [13] at Eurofins Genomics India Pvt Ltd, Bengaluru. After sequencing, chromatograms were obtained and converted into FASTA format using Chromas software version 2.6.6. This process guaranteed the accurate identification of the DNA sequences for further investigation and analysis.
2.6. ITS2 and rbcL Sequence Alignment and Phylogenetic Analysis
The ITS2 and rbcL gene sequences from various Phyllanthus species were aligned and analyzed using Geneious Prime software [14,15]. This alignment process identified conserved regions and variations crucial for species differentiation. Manual adjustments and trimming ensured high-quality sequences, generating consensus sequences with at least 80% coverage of the original read length, and alignments were performed using CLUSTALW [16]. Geneious Prime enabled statistical analyses of sequence composition, GC content, pairwise residue percentages, alignment percentages, and sequence length [17]. Consensus sequences were then validated by comparing them to nucleotide databases using NCBI BLAST [18].
For phylogenetic analysis, datasets comprising ITS2 and rbcL sequences from NCBI GenBank and specimens were assembled and analyzed using MEGA-X [19] and Phylogeny.fr [20]. Sequences were aligned with MUSCLE or ClustalW in MEGA-X, and The Neighbor-Joining (NJ) method was employed to construct the tree, with complete deletion (removing sites with any gaps) was applied. The number of nucleotide sites used in the analysis was recorded after deletions were applied. Bootstrapping with 2000 replicates was performed to assess the robustness of the tree, with bootstrap values displayed at the nodes, where values above 70% indicate well-supported clades.
2.7. DNA Barcoding and ITS2 Secondary Structure Predictions
This study used the Bio-Rad DNA barcode generator to create DNA barcodes for the Phyllanthus genotypes based on aligned ITS2 nucleotide sequences. RNA secondary structure predictions were also performed using the same ITS2 sequences with the RNAfold WebServer v2.4.18 [21].
3. RESULT AND DISCUSSION
The Phyllanthus genus is prevalent in tropical and subtropical regions and is used in traditional medicine for its bioactive compounds. Traditional identification methods rely on morphological traits such as growth patterns and leaf form, which can be unreliable due to phenotypic plasticity and environmental variations. Accurate species identification is crucial for biodiversity conservation and effective plant use. DNA barcoding, particularly using the ITS2 region and rbcL gene, has emerged as a rapid and precise alternative to morphological methods, offering a more reliable means of species classification [22].
3.1. DNA Extraction and PCR Amplification of ITS2 and rbcL Gene
Genomic DNA was effectively extracted from Phyllanthus species samples from Bengaluru, Karnataka, using a kit-based method, yielding substantial DNA quantities as confirmed by NanoDrop spectrophotometer analysis. The result, detailed in Table 2 and Figure 2, and was further validated by successful amplification and sequencing of a known amplicon. The successful amplification of the ITS2 region and rbcL gene highlights the robustness of these markers for plant DNA barcoding. The ITS2 region, approximately 545 base pairs long, was successfully amplified in all five Phyllanthus samples, with gel electrophoresis clearly showing its presence in each sample, thereby confirming the effectiveness of the amplification process.
The effectiveness of the enhanced DNA extraction kit in obtaining substantial genomic DNA from Phyllanthus species supports prior research [23], in which successful extraction of high-quality DNA from P. amarus using a similar commercial kit was demonstrated. This consistency underscores the reliability and efficiency of kit-based methods for Phyllanthus DNA extraction. The high yields confirmed by NanoDrop spectrophotometer analysis further validate the method’s suitability for genomic studies of Phyllanthus, enhancing our understanding of effective DNA extraction techniques in plant genomics. Another study [24] has analyzed the nucleotide sequences of internal transcribed spacers of ribosomal DNA using data from 56 plant samples, including 23 Phyllanthus species collected from various environments in Thailand. Inglis et al 2018 [25] identified medicinal Phyllanthus taxa in Brazil through DNA barcoding. Their study assessed the potential of several chloroplast regions (rbcL, matK, psbA-trnH, trnL, and trnL-trnF) as DNA barcodes for identifying 48 Phyllanthus taxa in Brazilian medicinal plant germplasm. This analysis also included internal transcribed spacer 2 (ITS2), ITS1–5.8S rRNA-ITS2, and other nuclear ribosomal subregions.
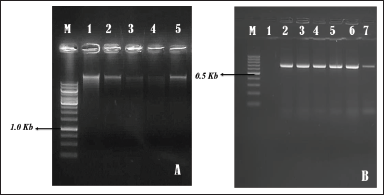 | Figure 2. (A) Visualization of genomic DNA samples from Phyllanthus Species Using 0.8% Agarose Gel Stained with Ethidium Bromide. Legends: M- Molecular Weight Marker (1.0kb Thermo Scientific, USA). Lane1- Phyllanthus maderaspatensis; Lane2- Phyllanthus amarus; Lane3- Phyllanthus urinaria; Lane4- Phyllanthus virgatus; Lane5- Phyllanthus tenellus; (B) Gel electrophoresis of PCR products from Phyllanthus species using internal transcribed spacer (ITS) Gene with 1.5% Agarose Gel. Legends: M- molecular weight marker (100 bp, Thermo Scientific, USA). Lane1- Phyllanthus maderaspatensis; Lane2- Phyllanthus amarus; Lane3- Phyllanthus urinaria; Lane4- Phyllanthus virgatus; Lane5- Phyllanthus tenellus. [Click here to view] |
3.2. NCBI BLASTn and ITS2 Database Analysis
The amplified ITS2 and rbcL gene regions from Indian Phyllanthus samples were sequenced and analyzed using NCBI BLASTn. The analysis revealed high sequence similarity with known Phyllanthus species: the ITS2 region showed 98.51% similarity with P. maderaspatensis, 99.70% with P. amarus and P. urinaria, 99.64% with P. virgatus, and 100% with P. tenellus. Similarly, rbcL gene sequences across Phyllanthus species exhibited strong conservation, with consistently high similarity percentages, reflecting the gene’s conservation within the genus. The alignments were robust, as indicated by high identity values (98%–100%) and high query cover percentages, affirming the reliability of species identification. BLAST’s bit scores and E-values further validated the biological significance of sequence alignments.
 | Table 3. Maximum composite likelihood estimate of the pattern of nucleotide substitution in Phyllanthus species. [Click here to view] |
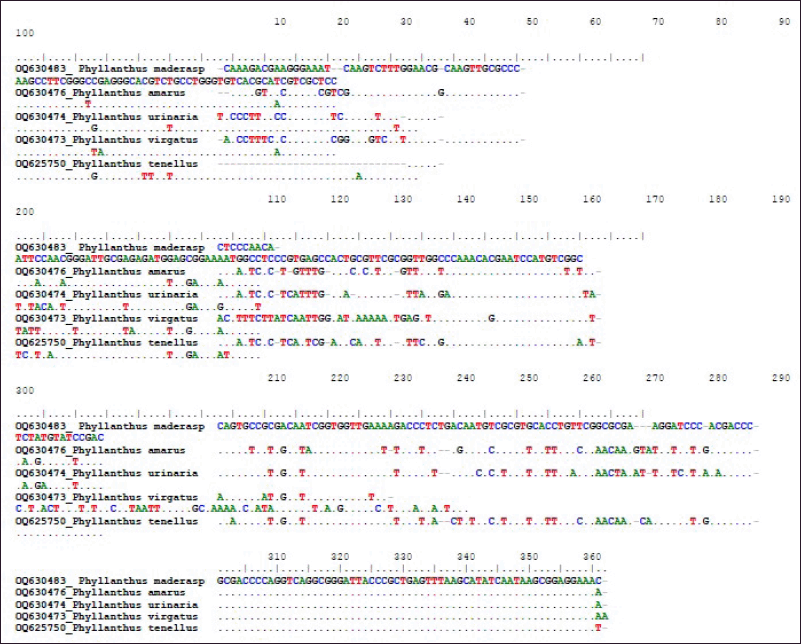 | Figure 3. The ClustalW Alignment of ITS gene sequences from Phyllanthus species genotypes: a comprehensive comparison. This multiple sequence alignment (MSA) method, using ClustalW, aims to align sequences accurately, allowing for the visualization of identities, similarities, and differences among Phyllanthus species genotypes. Notably, the comparison of ITS gene sequences from various Phyllanthus species demonstrated a lack of mismatches, indicating the absence of sequencing errors and a strong alignment with the Phyllanthus genus. [Click here to view] |
The nucleotide sequences were deposited in the NCBI GenBank with the following accession numbers: P. maderaspatensis (ITS2-OQ630483; rbcL-MK244691), P. amarus (ITS2-OQ630476; rbcL-OP626307), P. urinaria (ITS2-OQ630474; rbcL-PQ130161), P. virgatus (ITS2-OQ630473; rbcL-PQ130160), and P. tenellus (ITS2-OQ625750; rbcL-PQ130159). These unique identifiers ensure traceability and facilitate future research.
3.3. Phylogenetic Analysis
The maximum composite likelihood estimate of nucleotide substitution patterns in Indian Phyllanthus species is detailed in Table 3, showing substitution rates between different nucleotide bases which offers insights into nucleotide substitution dynamics. ITS2 gene sequences from Phyllanthus species (P. maderaspatensis, P. amarus, P. urinaria, P. virgatus, and P. tenellus) were aligned using ClustalW (Fig. 3), highlighting conserved regions and variations. The analysis, corroborated by BLASTn searches, confirms high sequence similarity and reliable phylogenetic relationships. An NJ analysis produced tree topologies similar to those of the parsimony tree (Fig. 4), reinforcing the reliability of both methods and the phylogenetic analysis.
The findings for each voucher specimen are as follows:
- Phyllanthus maderaspatensis (OQ630483): 98.09% similarity with some Indian species and close relationships with sequences from Austria and France.
- Phyllanthus amarus (OQ630476): 98.54% similarity with a sequence from Odisha, India, and related to sequences from various global locations.
- Phyllanthus urinaria (OQ630474): 100% similarity with a sequence from Manipal, Karnataka, and close relationships with sequences from several countries.
- Phyllanthus virgatus (OQ630473): 99.59% similarity with a sequence from Karkala, Karnataka, and clustering with sequences from Taiwan, China, Austria, and Thailand.
- Phyllanthus tenellus (OQ625750): 100% similarity with a sequence from Mysore, Karnataka, and related to sequences from Austria, Taiwan, and other regions.
The rbcL gene-based phylogenetic tree (Fig. 5) offers additional insights into the evolutionary relationships within Phyllanthus, supporting previous research and suggesting avenues for future study. The rbcL gene-based phylogenetic analysis confirms the separation of species from diverse geographical regions, including India, China, the USA, Korea, and Thailand, and aligns with recent studies. This analysis supports the low genetic diversity observed in P. amarus populations, attributed to gene flow and seed dispersal mechanisms that maintain genetic homogeneity across regions [26,27]. Our findings are consistent with Zhang [28], who used rbcL sequences to explore Phyllanthus phylogeny and identified a close relationship between P. amarus and P. virgatus, as indicated by high bootstrap values. Furthermore, the global distribution and genetic diversity within the genus, including species from the USA, align with Kim [29], who emphasized the widespread nature of Phyllanthus and its genetic implications.
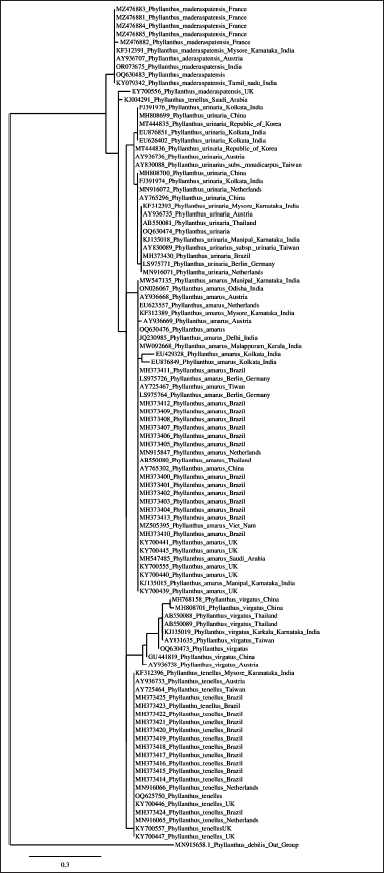 | Figure 4. Indian Phyllanthus nrITS2 gene phylogenetic neighbor-joining (NJ) tree with bootstrap support. The neighbor-joining (NJ) tree, constructed with 2000 bootstrap replicates, illustrates the clustering of various Phyllanthus species collected from diverse geographical locations. The tree is based on the ribosomal sequences of the internal transcribed spacer (ITS) gene. In this analysis, Phyllanthus debilis was employed as an outgroup to provide context for the relationships among the studied Phyllanthus species. The bootstrap support values indicate the robustness of the tree’s branching patterns, reflecting the reliability of the inferred phylogenetic relationships among these plant species. [Click here to view] |
 | Figure 5. Indian Phyllanthus rbcL gene phylogenetic NJ tree with bootstrap support. The evolutionary history was inferred using the neighbor-joining method. The optimal tree is shown. The percentage of replicate trees in which the associated taxa clustered together in the bootstrap test (2000 replicates) are shown next to the branches. (next to the branches). The evolutionary distances were computed using the maximum composite likelihood method and are in the units of the number of base substitutions per site. The proportion of sites where at least 1 unambiguous base is present in at least 1 sequence for each descendent clade is shown next to each internal node in the tree. This analysis involved 27 nucleotide sequences. Codon positions included were 1st+2nd+3rd+Noncoding. All ambiguous positions were removed for each sequence pair (pairwise deletion option). There were a total of 1462 positions in the final dataset. [Click here to view] |
DNA barcoding of the ITS2 region revealed genetic distinctions among Phyllanthus species, with Phyllanthus virgatus (OQ630473) having the longest barcode at 363 base pairs. The other species had barcodes of 356 base pairs, providing crucial genetic data for species identification and understanding evolutionary relationships (Fig. 6). Despite the limited knowledge on Phyllanthus phylogenetics, this study builds upon previous research, particularly that of Wurdack et al. [30]. Their work focused on the Phyllanthoideae subfamily within the Euphorbiaceae family, utilizing plastid rbcL DNA sequences to explore genetic diversity and evolutionary relationships among Phyllanthaceae. This comprehensive analysis has significantly advanced our understanding of plant evolution and systematics. Further contributions by other researchers [1,31,32] underscore the collaborative nature of scientific research. Thus, barcoding techniques have furthered our ability to decode the evolutionary complexity of Phyllanthus species.
3.4. ITS2 Secondary Structure Predictions
The secondary structure predictions of the ITS2 region revealed notable variations among Phyllanthus genotypes, particularly in the helical orientations of the core ring (Fig. 6). Differences included the number, location, size, and angular positioning of loops relative to the centroid. Specifically, Phyllanthus virgatus exhibited a more intricate secondary structure with variable loop counts and angles than other genotypes. The estimated minimal free energy values, depicted in Figure 6 further emphasize differences in structural stability. This analysis enhances the precise identification and molecular characterization of Phyllanthus genotypes by providing detailed insights into their structural and genetic features.
These findings are crucial for developing species-specific primers, which can improve the efficiency of identifying less well-known Phyllanthus species. The unique genetic structures observed in the conserved ITS2 region offer opportunities to design primers that accurately differentiate between species, which is vital for preventing adulteration in herbal products and maintaining their authenticity and quality. The effectiveness of DNA barcoding and secondary structure analysis is corroborated by Engelmann et al. [33], who demonstrated the value of ITS2 microarrays in distinguishing species with high sequence identities. Their work highlights the robustness of these methodologies in dealing with degraded DNA and ensuring the authenticity of herbal products. In the present study, the use of DNA barcoding and secondary structure predictions contributes to the development of tools for verifying Phyllanthus species identities, addressing adulteration issues, and supporting the herbal industry’s integrity and consumer safety.
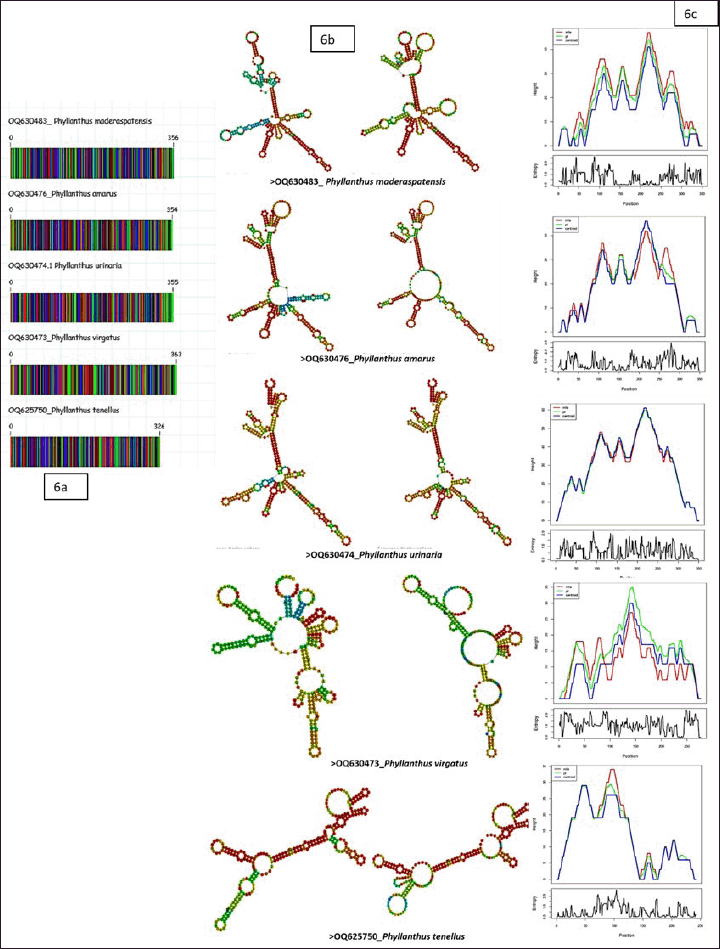 | Figure 6. Comparative analysis of Phyllanthus genotypes, (a) DNA barcodes (b) consensus structure of ITS2 region (c) predicted minimum free energy (MFE). Panel (a) displays the DNA barcodes, highlighting variations among the genotypes. Panel (b) represents the consensus structure of the ITS2 region, demonstrating the secondary structures of the genotypes. Panel (c) provides information on the predicted minimum free energy (MFE), indicating structural stability differences among the genotypes. This comprehensive analysis offers valuable insights into the genetic and structural attributes of Phyllanthus genotypes, aiding in their accurate identification and molecular characterization. [Click here to view] |
4. CONCLUSION
The present study demonstrates the effectiveness of DNA barcoding, particularly using the ITS2 and rbcL regions, for accurate identification and validation of Phyllanthus species in India. The analysis of DNA barcodes and secondary structures reveals significant divergence within and between species in the ITS2 region, aiding in the quality control of herbal products and the protection of Phyllanthus biodiversity. The constructed phylogenetic tree based on ITS2 sequences provides valuable insights for conservation and highlights the impact of adulteration on genetic variation. Deposited nucleotide sequences offer crucial genetic references for future research and quality control. The rbcL gene analysis supports these findings, showing high similarity and strong conservation across Phyllanthus species. Utilizing ITS2 and rbcL markers enhances species identification accuracy, providing a comprehensive genetic framework for Phyllanthus studies. This research highlighted the importance of advanced molecular methods in botanical research and conservation, contributing to sustainable use and conservation of Phyllanthus species and maximizing their medicinal potential.
5. ACKNOWLEDGMENTS
The authors extend their gratitude to the Botanical Extraction Unit and Himalaya Wellness Company for their invaluable assistance and resources, pivotal in facilitating this research. Their dedication to biodiversity preservation and advocacy for sustainable living strongly resonates with our research objectives, playing a pivotal role in the success of this project. This contribution is a significant segment of the first author’s PhD thesis.
6. DISCLOSURE
Portions of this article have been uploaded to a preprint server. Please note that preprints and early-stage research are preliminary and have not yet undergone peer review. The preprint can be accessed at DOI: 10.21203/rs.3.rs-3893650/v1.
7. AUTHOR CONTRIBUTIONS
All authors made substantial contributions to conception and design, acquisition of data, or analysis and interpretation of data; took part in drafting the article or revising it critically for important intellectual content; agreed to submit to the current journal; gave final approval of the version to be published; and agree to be accountable for all aspects of the work. All the authors are eligible to be an author as per the international committee of medical journal editors (ICMJE) requirements/guidelines.
8. FUNDING
There is no funding to report.
9. CONFLICTS OF INTEREST
The authors report no financial or any other conflicts of interest in this work.
10. DATA AVAILABILITY
All the data is available with the authors and shall be provided upon request.
11. PUBLISHER’S NOTE
All claims expressed in this article are solely those of the authors and do not necessarily represent those of the publisher, the editors and the reviewers. This journal remains neutral with regard to jurisdictional claims in published institutional affiliation.
12. USE OF ARTIFICIAL INTELLIGENCE (AI)-ASSISTED TECHNOLOGY
The authors declares that they have not used artificial intelligence (AI)-tools for writing and editing of the manuscript, and no images were manipulated using AI.
REFERENCES
1. David J. Mabberley. 2008. Mabberley’s plant-book. 3rd edition, Cambridge University Press, Cambridge, UK, 2008.
2. Kathriarachchi H, Hoffmann P, Samuel R, Wurdack KJ, Chase MW. Molecular phylogenetics of Phyllanthaceae inferred from five genes (plastid atpB, matK, 3′ ndhF, rbcL, and nuclear PHYC). Mol Phylogenet Evol 2005 Jul 1;36(1):112–34; CrossRef
3. Mao X, Wu LF, Guo HL, Chen WJ, Cui YP, Qi Q, et al. The genus Phyllanthus: an ethnopharmacological, phytochemical, and pharmacological review. Evid Based Complementary Altern Med 2016;2016(1):7584952; CrossRef
4. Nisar MF, He J, Ahmed A, Yang Y, Li M, Wan C. Chemical components and biological activities of the genus Phyllanthus: a review of the recent literature. Molecules 2018 Oct 8;23(10):2567; CrossRef
5. Barros ME, Schor N, Boim MA. Effects of an aqueous extract from Phyllantus niruri on calcium oxalate crystallization in vitro. Urol Res 2003 Feb;30:374–9; CrossRef
6. Calixto JB, Santos AR, Filho VC, Yunes RA. A review of the plants of the genus Phyllanthus: their chemistry, pharmacology, and therapeutic potential. Med Res Rev 1998 Jul;18(4):225–58; CrossRef
7. Chen S, Yao H, Han J, Liu C, Song J, Shi L, et al. Validation of the ITS2 region as a novel DNA barcode for identifying medicinal plant species. PLoS One 2010 Jan 7;5(1):e8613; CrossRef
8. Kress WJ, Wurdack KJ, Zimmer EA, Weigt LA, Janzen DH. Use of DNA barcodes to identify flowering plants. Proc Natl Acad Sci 2005 Jun 7;102(23):8369–74; CrossRef
9. Techen N, Parveen I, Pan Z, Khan IA. DNA barcoding of medicinal plant material for identification. Curr Opin Biotechnol 2014 Feb 1;25:103–10; CrossRef
10. Yao H, Song J, Liu C, Luo K, Han J, Li Y, et al. Use of ITS2 region as the universal DNA barcode for plants and animals. PLoS One 2010 Oct 1;5(10):e13102; CrossRef
11. Kress WJ, Erickson DL. A two-locus global DNA barcode for land plants: the coding rbcL gene complements the non-coding trnH-psbA spacer region. PLoS One 2007;2:e508.
12. Sambrook J, Russell DW. Molecular cloning: a laboratory manual. 3rd edition. Cold Spring Harbor Laboratory Press, New York, NY, 2001.
13. Sanger F, Nicklen S, Coulson AR. DNA sequencing with chain-terminating inhibitors. Proc Natl Acad of Sci 1977 Dec;74(12):5463–7; CrossRef
14. Kearse M, Moir R, Wilson A, Stones-Havas S, Cheung M, Sturrock S, et al. Geneious basic: an integrated and extendable desktop software platform for the organization and analysis of sequence data. Bioinformatics 2012 Jun 15;28(12):1647–9; CrossRef
15. Shendure J, Ji H. Next-generation DNA sequencing. Nat Biotechnol 2008 Oct;26(10):1135–45; CrossRef
16. Thompson JD, Gibson TJ, Plewniak F, Jeanmougin F, Higgins DG. The CLUSTAL_X windows interface: flexible strategies for multiple sequence alignment aided by quality analysis tools. Nucleic Acids Res 1997 Dec 1;25(24):4876–82; CrossRef
17. Drummond AJ, Ashton B, Buxton S, Cheung M, Cooper A, Duran C, et al. Geneious, version 5.4. Geneious, Auckland, New Zealand, 2011.
18. Altschul SF, Gish W, Miller W, Myers EW, Lipman DJ. Basic local alignment search tool. J Mol Biol 1990 Oct 5;215(3):403–10; CrossRef
19. Kumar S, Stecher G, Li M, Knyaz C, Tamura K. MEGA X: molecular evolutionary genetics analysis across computing platforms. Mol Biol Evol 2018 Jun 1;35(6):1547–9; CrossRef
20. Dereeper A, Guignon V, Blanc G, Audic S, Buffet S, Chevenet F, et al. Phylogeny. fr: robust phylogenetic analysis for the non-specialist. Nucleic Acids Res 2008 Apr 19;36(suppl_2):W465–9; CrossRef
21. Lorenz R, Bernhart SH, Höner zu Siederdissen C, Tafer H, Flamm C, Stadler PF, et al. ViennaRNA Package 2.0. Algorithms Mol Biol 2011 Dec;6:1–4; CrossRef
22. Bhat AR, Hegde S, Kammar SS, Muthamma MB, Mudgal G, Mohan TC. Identification and validation of ITS2-specific universal primers for DNA barcoding in plants. bioRxiv. 2024;2024:2024–01; CrossRef
23. Alade GO, Iyede N, Okpoji KM, Ajibesin KK. Molecular identification of Phyllanthus amarus Schumach. & Thonn. Phyllanthaceae. Glob J Pharmaceu Sci 2023;10(4):555793 doi: 10.19080/GJPPS.2023.10.555793
24. Manissorn J, Sukkaew P, Sumranwanich T. Molecular identification of medicinal Phyllanthus species (Euphorbiaceae) using internal transcribed spacer (ITS) sequences. Gen Mol Res 2010;9(2):705–11.
25. Inglis PW, Mata LR, da Silva MJ, Vieira RF, de BN Alves R, Silva DB, et al. DNA barcoding for the identification of Phyllanthus taxa used medicinally in Brazil. Planta Med 2018 Nov;84(17):1300–10; CrossRef
26. Nambiar, N. Genetic diversity and population structure of Phyllanthus amarus in India. J Med Plants Res 2022;16(2):34–45.
27. Rao R. Phylogenetic relationships among Phyllanthus species using rbcL gene sequences. Plant Sys Evol 2021;307(4):745–58.
28. Zhang Y. Phylogenetic analysis of Phyllanthus species based on rbcL and ITS sequences. Bot Stud 2020;61(1):22.
29. Kim S. Global distribution and genetic diversity of Phyllanthus species. Int J Plant Sci 2023;184(1):56–68.
30. Wurdack KJ, Hoffmann P, Samuel R, De Bruijn A, Van Der Bank M, Chase MW. Molecular phylogenetic analysis of Phyllanthaceae (Phyllanthoideae pro parte, Euphorbiaceae sensu lato) using plastid rbcL DNA sequences. Am J Bot 2004 Nov;91(11):1882–900; CrossRef
31. Rout GR, Das P, Das L. Molecular identification of Phyllanthus amarus using rDNA-ITS region. Am Eur J Bot 2010;3(4):149–54.
32. Müller K, Borsch T, Legendre L, Porembski S, Theisen I, Barthlott W. Evolution of carnivory in Lentibulariaceae and the Lamiales. Plant Biol 2004 Jul;6(04):477–90; CrossRef
33. Engelmann JC, Rahmann S, Wolf M. Accurate and efficient genome-wide assembly of extremophilic ITS2 sequences. BMC Bioinfor 2009;10(Suppl 14):S7.