
1. INTRODUCTION
The ever-growing global demand for sustainable protein sources has significantly propelled extensive exploration and research into alternative food options, aiming to effectively address the pressing challenges of ensuring food security, promoting environmental sustainability, and mitigating environmental degradation on a global scale [1]. In recent years, insects have emerged as a promising solution in the quest for sustainable food sources due to their rich protein and nutrient content. They have gained significant relevance as a viable food source, aligning with sustainability goals for food production, including the reduced utilization of natural resources [2]. Among regions, the Asia Pacific boasts the most diverse range of edible insect species, and with its growing population and increasing food demand, it has witnessed a rise in reliance on edible insects. Tropical countries such as Thailand are well-known for both the consumption and trade of edible insects. Thailand alone boasts more than 190 species of edible insects from crickets to beetles, bees, and many others [3]. According to the Thai Ministry of Public Health, the consumption of insects is highly endorsed to address the nutritional needs of both the urban and agrarian communities [4].
Specifically in urban regions, this practice has gained immense popularity by showcasing a remarkable diversity of insect-based foods, with consumers incorporating insects into their diets as main dishes, food ingredients, or snacks [5]. Including edible insects as ingredients in food menus facilitates culinary creativity, preserves traditions, promotes the study of novel techniques, and provides information about historical aspects of human nutrition and the development of new technologies [6]. As the number of published studies on using insects in various food products continues to increase, researchers are exploring distinct avenues, such as the nutritional values of existing products with insects [7] and the creation of alternative meat protein substitutes [8].
In the field of edible insects, honey bees present a promising alternative for a new protein food source. The Department of Agriculture, Thailand, has formally acknowledged and endorsed honey bees as economically significant insects to emphasize their potential value. According to Ghosh et al. [9], there is a discernible upward trend in protein content (including total amino acids) as the developmental stages of worker honey bees advance in both Apis cerana and Apis dorsata species. Remarkably, the protein content of adult A. dorsata was found to be 55.7% on a dry matter (DM) basis, which is comparable to soybean [10]. In Thailand, native honey bee species, including Apis florea A. cerana, and A. dorsata, are traditionally harvested for their honey and brood for consumption, while the adult bees are often overlooked and discarded due to their chitin exoskeleton. Therefore, one possible solution is to repurpose adult bees into novel food products rather than discarding them. However, responsible harvesting practices, such as partially collecting the adult bee population, can minimize ecological impact. By examining the potential of integrating adult A. dorsata bees into the culinary development of products such as fermented sauces, we can extend the variety of insect-based food offerings. The substantial protein content inherent in adult honey bees provides them a compelling option for substituting traditional protein sources and innovating novel protein-based food products. Utilizing adult giant honey bees, which are typically overlooked or discarded during honey and brood collection, provides a unique opportunity to reduce agricultural food waste and enhance protein recovery from locally available resources. By converting these underused insects into value-added fermented products, this study aims to directly contribute to environmental sustainability and improved protein utilization. Furthermore, adult A. dorsata offer high nutritional value, especially in protein and essential amino acids Ghosh et al. [9] which aligns with the dual goals of advancing food security and supporting ecologically responsible consumption.
Fermentation is a technique used in traditional food preservation and is known to enhance the nutritional value and flavor of food products. Before fermentation, edible insects are often subjected to processes such as boiling and crushing to make available essential nutrients required for microbial treatment during the fermentation process [11,12]. Several studies have employed bacterial or fungal cultures to enable the modification of essential components within the insects through fermentation. For instance, the effectiveness of Aspergillus oryzae fungi in fermenting Galleria mellonella larvae and Locusta migratoria as substrates was demonstrated, underscoring its practical feasibility [13]. Similarly, when imitating soy sauce fermentation using Tenebrio molitor larvae, sauces produced with A. oryzae and Bacillus licheniformis showed promising outcomes, resulting in compound generation that contributed to the desirable flavor of products [14].
Although fermentation procedures have been widely used in many food sources, relatively limited studies have been done on using fermentation techniques to transform edible insects into food mediators or to add them to common fermented food [15]. Therefore, this research describes the potential benefits, challenges, and opportunities related to utilizing insects in fermented food production. This study aims to investigate the feasibility of adult A. dorsata bees as a sustainable protein food source through the development of a novel fermented seasoning sauce. This study demonstrates that fermentation of adult A. dorsata using A. oryzae yields a protein-enriched condiment with clear changes in nutritional profile and physicochemical properties. These findings underscore the value of utilizing underused insect resources to develop novel, sustainable food products with the potential to contribute to both food security and innovative protein solutions.
2. MATERIALS AND METHODS
2.1. Preparation of Koji Starter
Twenty milliliters of potato dextrose broth were prepared and inoculated with a stock culture of A. oryzae (Thailand Institute of Scientific and Technological Research [TISTR] 3014), a standard strain obtained from the TISTR. This filamentous fungus was originally isolated from fermented salted soybean and is widely recognized as a safe, non-pathogenic fermentation mold. It has been extensively used in both traditional and industrial fermentation processes due to its high enzymatic activities and long history of safe use in food production. The inoculated broth was incubated at 150 rpm at 30°C for 3 days using a digital orbital shaker (Onilab SK-O330-PRO, USA) to promote fungal growth. In parallel, 20 g of fresh weight of adult honey bees were homogenized with 10 mL of sodium citrate buffer (pH 5.5) to serve as the koji substrate. A. oryzae spores were then added to the substrate at a concentration of 0.5% (w/w), and the mixture was incubated at 30°C for 7 days to allow solid-state fermentation.
2.2. Fermentation of Honey Bee Sauce
The A. dorsata samples utilized in this experiment were sourced from the Mae Rim district, Chiang Mai province, Thailand. To ensure sterility and prevent microbial contamination, adult bee samples used for the main fermentation substrate were autoclaved at 121°C for 15 min. Three sets of samples were prepared in triplicate for the experiment. Four formulations were subsequently evaluated: (1) D53, serving as the control (bee: water = 5:3); (2) D431, consisting of bee, water, and rice flour in a ratio of 4:3:1 (w/w/w); (3) D53A, identical to the control but supplemented with 1.0% (w/w) koji starter; and (4) D431A, identical to D431 but with the addition of 1.0% (w/w) koji starter. The samples were incubated at 30°C for 30 days. During the incubation period, they were thoroughly stirred once daily to ensure uniform distribution of the koji culture throughout the substrate. To prepare the honey bee sauces, a 23% (w/w) salt solution (23% Brine) was added at a ratio equal to twice the weight of the fermented substrate (1:2, substrate: salt solution). The mixture was then incubated at 30°C for an additional 30 days, resulting in a total fermentation period of 60 days.
2.3. Evaluation of Fermentation Parameters
Samples obtained from days 0 and 60 of fermentation were analyzed for their physical and chemical properties. All experiments were conducted in triplicate to ensure reproducibility.
2.3.1. Browning
The browning intensity of the samples was evaluated based on a modified method adapted from Cho et al. [14]. The samples were subjected to absorbance measurement at 420 nm using a ultraviolet (UV)-vis spectrophotometer (MAPADA V-1100D, Shanghai, China). A420 was used as an index of browning intensity.
2.3.2. pH, electrical conductivity (EC), salinity, acidity, total soluble solids (TSS)
The pH of the sauce samples was measured using a bench-top pH meter (OHAUS Starter 3100, Parsippany, NJ, USA). Salinity and EC were measured using a portable conductivity meter and a salt refractometer. Titratable acidity was assessed by diluting 10 mL of the sample with 20 mL of distilled water, followed by titration with 0.05 N NaOH to an endpoint pH of 8.30 [16]. TSS were determined using a digital hand-held refractometer with a measurement range of 0.0–53.0% Brix (ATAGO PAL-1, Model 3810, Tokyo, Japan).
2.3.3. Total nitrogen
Total nitrogen content was determined using the Kjeldahl method based on a modified method adapted from Cho et al. [14]. A 2 mL aliquot of the sauce sample was placed into a Kjeldahl digestion flask, followed by the addition of 25 mL of concentrated sulfuric acid (H2SO4). The mixture was digested using an accelerator (Kjeltabs K2SO4 - 3.5 g, Se - 3.5 mg; Gerhardt, Königswinter, Germany). After digestion, the samples were distilled and neutralized using a Vapodest distillation apparatus (Gerhardt). The amount of nitrogen was quantified by titration with 0.1 N sulfuric acid (H2SO4), and the volume of titrant consumed was used to calculate the total nitrogen content. The observed increases in total nitrogen content during fermentation served as indirect biochemical evidence of proteolytic activity exerted by A. oryzae, reflecting enzymatic hydrolysis of proteins within the bee substrate.
2.3.4. Total sugar content
Total sugar content was determined by the phenol-H2SO4 method [17]. A 0.1-mL aliquot of sauce was diluted with distilled water to 100 mL. One milliliter of the filtered sample solution was mixed with 1 mL of a 5% phenol solution and 5 mL of concentrated sulfuric acid. The absorbance was measured at 470 nm after 30 min.
2.3.5. Color analysis
Ten mL of each sauce sample was measured using a colorimeter (Konica Minolta Chroma Meter CR-400, Chiyoda, Japan) based on the Hunter Lab system (CIELAB). Color values were recorded as L* (lightness) represents lightness (ranging from 0 = Black to 100 = White), a* is the red–green axis (positive a* = Red, negative a* = Green), b* is the yellow–blue axis (positive b* = Yellow, negative b* = Blue), and h* is the hue angle, indicating the qualitative attribute of color and total color difference (ΔE) were calculated to assess color characteristics and overall color change, respectively, following the methodology of Zahidah and Lo [18].
2.3.6. Proximate analysis
Chemical composition analyses were carried out in triplicate. The samples were first ground to pass through a 1.0 mm sieve. Determinations of DM, crude protein, crude fat, crude fiber, and ash content were performed following standard methods outlined by the Association of Official Analytical Chemists (AOAC; Latimer, 2016) [19].
2.4. Statistical Analysis
Data are presented as mean ± standard deviation from triplicate measurements. Significant differences among treatment means (P < 0.05) were determined using one-way analysis of variance, followed by Duncan’s multiple range test conducted with Statistical Package for the Social Sciences software version 27.0 (IBM Corp., Armonk, NY, USA). In addition, principal component analysis (PCA) was employed as a multivariate statistical tool to identify patterns and relationships among treatments. An orthogonal transformation was performed according to the method described by Brereton [20]. Mean centering of data, PCA calculations, and graphical representations were carried out using JMP version 10.0 (SAS Institute Inc., Cary, NC, USA). Results were displayed as a two-dimensional biplot illustrating principal component (PC) scores and loadings, with particular focus on the association between the first two PCs (PC1 and PC2).
3. RESULTS AND DISCUSSION
After 30 days of fermentation, the honey bee sauce samples exhibited notable changes in their physicochemical properties, as detailed in Table 1. These parameters, including browning intensity, pH, EC, salinity, titratable acidity, TSS, total nitrogen, total sugar, and reducing sugar, offer critical information on both the fermentation process and the resulting product quality. Each variable displays specific biochemical transformations that occurred during fermentation, and a more comprehensive analysis follows in the subsequent sections.
Table 1: The physicochemical characteristics of sauce samples after 60 days of fermentation.
| Treatments | Browning (A420) | pH | EC (mS/cm) | Salinity (%) | Acidity (%) | Brix (%) | Total n (%) | Total sugar (%) |
|---|---|---|---|---|---|---|---|---|
| D53 | 1.03±0.11c | 5.85±0.00a | 0.173±0.00a | 21.66±0.28 | 0.06±0.00b | 20.50±0.10ab | 0.24±0.00c | 1.37±0.21b |
| D53A | 2.11±0.08a | 5.06±0.13b | 0.171±0.00a | 21.63±0.32 | 0.10±0.00a | 18.36±0.15c | 0.44±0.00a | 6.89±0.12a |
| D431 | 1.04±0.01c | 6.02±0.04a | 0.172±0.00a | 21.76±0.25 | 0.06±0.00b | 20.73±0.05a | 0.28±0.00b | 1.47±0.19b |
| D431A | 1.36±0.15b | 5.13±0.06b | 0.164±0.00b | 21.06±0.20 | 0.10±0.00a | 20.16±0.25b | 0.45±0.00a | 8.42±1.64a |
| P-value | <0.001 | <0.001 | 0.002 | 0.05 | <0.001 | <0.001 | <0.001 | <0.001 |
EC: Electrical conductivity, SD: Standard deviation. The data were analyzed using an analysis of variance test, with results expressed as mean±SD. Means within the same column with different superscript letters are significantly different
Browning intensity, in particular, increased significantly (P < 0.05) in samples D53A and D431A over a 60-day fermentation period, with absorbance values reaching 2.11 and 1.36, respectively. This browning was evaluated using UV-vis spectrophotometry at 420 nm, a standard approach for monitoring non-enzymatic browning reactions in fermented products [21]. The primary contributors to browning in these sauces are non-enzymatic processes, most notably the Maillard reaction and Amadori rearrangement. These involve interactions between reducing sugars and amino acids, resulting in the formation of compounds such as melanoidins and reductones, which are central to the color, flavor, and aroma profile of the final product. With continuing fermentation, the increased presence of free amino acids enables more extensive reactions with reducing sugars and oxidative products, further intensifying browning [22,23]. The addition of rice flour appears to provide extra reducing sugars, thereby enhancing Maillard reactions; in the absence of rice flour, browning is less pronounced. For a more precise assessment of browning, it is advisable to measure 2,4-DNPH derivatives and 3DG, as previously recommended in the literature [23].
By day 60 of fermentation, a marked decrease in pH was evident across all samples: D53A reached 5.06, D431 settled at 6.02, and D431A measured at 5.13. These values reflect a significantly greater degree of acidification compared to the control (D53), whose initial pH was 7.0. Regarding TSSs, all treatments showed some reduction, with the largest decrease observed in D53A. In contrast, D431A maintained higher soluble solids, likely due to the rice flour’s starch content. Starches, being long-chain glucose polymers, are more resistant to breakdown during fermentation, which may explain the retention of soluble solids in this sample.
These observations are consistent with findings reported by Wu et al. [24], who documented a decrease in pH from 7.00 to 4.88 when fermenting moromi sauce in brine at 25–35°Cover 30 days. The decline in pH during fermentation is generally attributed to microbial autolysis and the accumulation of free fatty acids, amino acids, and peptides with carboxylic side chains resulting from the hydrolysis of sauce components [25]. Although organic acid quantification (e.g., lactic, acetic acid) was not performed in this study, titratable acidity measurements showed a significant increase correlating to acid accumulation during fermentation.
The EC and salinity of the samples showed minimal changes after fermentation, with no significant differences observed among most treatments. However, treatment D431A exhibited the most notable decrease in EC, reaching a value of 0.164 mS/cm. This reduction can be attributed to the metabolic activity of microorganisms during fermentation, which leads to the consumption and transformation of ions present in the substrate. The observed decline in conductivity aligns with findings by Li et al. [26], who reported a similar trend of decreasing EC during alcoholic fermentation as fermentation time increased. Furthermore, Mizutani et al. [27] noted that the reduction in salt content in commercially produced fish sauce resulted from salt precipitation occurring during the fermentation process. Total acidity content is used to determine the quality index in fermented food [28]. The overall titratable acidity of all samples increased in response to microbial inoculation (D53A and D431A) and extended fermentation duration, consistent with the findings of Song and Lee [29].
Sample D53A exhibited a more significant decrease compared to the other samples. The decline in °Bx indicated the consumption of sugars during the fermentation process due to the production of alcohol, acids, or gases [30]. Samples D431 and D431A contain starch from the addition of rice flour, which is composed of long chains of glucose molecules. During fermentation, enzymes produced by microorganisms can break down starch into simpler sugars like glucose [31]. However, this conversion may not be as efficient as the breakdown of readily available sugars. In the case of D53A, the higher concentration of easily accessible sugars, which originates from the honey present on the bodies of adult bees, is due to a higher percentage weight of bees used during the formulation of the D53A sauce sample as opposed to D431. Consequently, the rice flour in D431 A may contribute to fewer fermentable sugars, thereby resulting in a higher °Bx value. Furthermore, a higher TSS found in sample D431 may also be a result of higher amylase and protease activity levels from the addition of rice flour [14]. Although direct enzymatic hydrolysis assays were not conducted, the increase in total sugar content and changes in TSS suggest active starch degradation in rice flour-containing samples, likely mediated by microbial amylases.
In contrast, samples D431 and D431A, which contain starch from added rice flour, retained higher °Bx values. This may be due to less efficient starch breakdown compared to readily available sugars. D53A, formulated with a higher proportion of honey bees, likely had more accessible sugars from honey residues, leading to greater sugar utilization. In addition, the higher °Bx in D431 may be linked to increased amylase and protease activity from rice flour [14].
The observed increases in total nitrogen content and changes in TSS during fermentation serve as indirect biochemical evidence of both proteolytic and amylolytic activity exerted by A. oryzae, reflecting enzymatic hydrolysis of proteins and carbohydrates within the adult bee substrate. Although direct microbial enumeration or enzymatic activity assays (such as protease or amylase quantification) were not conducted in this study, these measured biochemical changes are widely accepted as reliable indicators of fungal activity, as supported by the previous research [14,24]. This approach aligns with established practices in food fermentation, where increases in nitrogen and protein content have been used as proxy markers of A. oryzae-mediated proteolysis in fermented substrates.
The increases in total nitrogen and protein contents strongly suggest effective proteolytic degradation of adult honey bee proteins by A. oryzae, consistent with its role as a protease-producing koji mold. While direct enzymatic activity assays were not performed in this study, the measured biochemical changes align with the literature [14,24], where such increases serve as reliable indirect markers of fungal proteolysis during fermentation. Total nitrogen content is an essential parameter used to determine and evaluate the quality of sauce products [32]. A good quality soy sauce should consist of 1.00–1.65% total nitrogen [33]. Similar results were also observed by Kim and Lee [25], such that the nitrogen content of soybean fermentation increased significantly after a 30-day incubation period at 30°C. However, the total nitrogen content for all samples was found to be >0.7% (w/v), which was not the case for this study conducted with adult honey bees. In addition, on the sauce fermentation of T. molitor larvae had a total nitrogen content of approximately 1.06–1.31% only after 20 days of fermentation, which was significantly higher when compared to the results obtained from this study [14].
The low nitrogen content from this experiment could be a result of the tough chitin exoskeleton of the adult honey bees, which may be difficult to hydrolyze by A. oryzae. According to the studies conducted by Klunder et al. [11] and Borremans et al. [12], insects should be subjected to processing methods to expose and make available the essential nutrients required for microbial activities during the fermentation process. Therefore, further consideration should be given to the preparation steps for adult honey bees, such as implementing additional steps such as grinding or crushing, to break the bees into smaller fragments before fermentation. Total acidity content is requisitely used to determine the quality index in fermented food [28].
As shown in Table 1, the mean total sugar of the sauce samples. A substantial increase in total sugar content was observed in samples D53A and D431A, reaching 6.89 and 8.42%, respectively. These increases suggest active enzymatic hydrolysis and efficient conversion of complex carbohydrates into simpler sugars during the fermentation process. Sugar serves a vital function in soy sauce products by mitigating its saltiness. It also influences flavor and color formation through the Maillard reaction when subjected to heating processes [34]. On the other hand, reducing sugars such as glucose and fructose contributes to the sweetness and overall flavor profile of sauce products. The analysis of reducing sugar content is crucial for monitoring the progress of fermentation. Measuring the reducing sugar content allows for precise control and optimization of fermentation parameters, ensuring the desired fermentation outcomes [35].
As shown in Table 2, D53 had a significantly higher (P < 0.05) L*, b*, h, and ΔE values compared to D431. As fermentation progressed to day 30, the L*, h, and ΔE values of all samples decreased. Conversely, the a* and b* values increased over time, although a* values for D53A, D431, and D431A did not differ significantly on day 60. The lower L* values observed in D431 and D431A could be attributed to the presence of rice flour in the formulation, where larger flour particles may form a suspension in the liquid, causing a residual cloudiness. The a* values were found generally higher for D53, indicating a redder liquid, while higher b* values reflected a more yellowish hue, likely linked to higher insect fat composition from adult honey bees due to formulation differences [14,24]. The ΔE values observed in this study ranged from 35.54 to 58.56, substantially exceeding the perceptibility threshold of 5.0. According to established color difference standards [36], ΔE values >5.0 indicate that colors are fundamentally different and highly perceptible to the human eye. Therefore, the color changes observed in fermented honey bee sauces represent visually distinct and easily noticeable differences compared to the control samples. These color changes can primarily be explained by Maillard reaction-driven browning and melanoidin formation, supported by increased absorbance at 420 nm. The fungal enzymatic hydrolysis of proteins and sugars enhances these non-enzymatic browning reactions. In addition, our findings distinguish between pigment oxidation and Maillard reaction effects, with the latter being the dominant mechanism responsible for the observed color reductions in lightness (L*) and blue–yellow (b*) parameters during fermentation [36].
Table 2: CIELAB color space values of sauce samples after 60 days of fermentation.
| Treatments | L* | a* | b* | h | ΔE |
|---|---|---|---|---|---|
| D53 | 47.28±1.57a | 3.460±0.55a | 33.48±0.68a | 84.09±0.96bc | 58.56±0.35a |
| D53A | 47.89±3.02a | 0.94±0.34b | 24.87±0.93b | 88.50±1.66a | 54.21±0.27b |
| D431 | 44.33±1.01a | 0.903±0.06b | 16.06±0.9c | 87.29±1.07ab | 47.96±1.26c |
| D431A | 33.15±3.20b | 1.30±0.04b | 12.59±2.15d | 82.83±2.86c | 35.54±0.35d |
| P-value | <0.001 | <0.001 | <0.001 | <0.001 | <0.001 |
SD: Standard deviation, L*: Lightness, a*: Red-green coordinate, b*: Yellow-blue coordinate, h*: Hue angle (all per CIELAB color space conventions). The data were analyzed using an analysis of variance test, with results expressed as mean±SD. Means within the column that have different superscripts are considered significantly different at the P<0.05 level.
Table 3 presents the proximate analysis of the honey bee sauce samples, including moisture, protein, carbohydrate, fat, and ash content. Comparisons were made among samples D53A, D431, and D431A and their respective control (D53). Notably, both D53A and D431A exhibited significantly higher protein content than the control, suggesting the impact of fungal activity. The elevated protein level in D53A may also be attributed to a greater proportion of adult honey bees in its protein formulation. Samples D431 and D431A showed higher carbohydrate content compared to D53, probably due to the addition of rice flour. Interestingly, D431A had significantly lower fat content than the other samples. While the moisture content in D431 and D431A did not differ significantly, both were considerably lower than that in D53 and D53A. In addition, D431 recorded the highest ash content among all samples. According to the Thai Ministry of Public Health, Notification on food seasonings derived from the hydrolysis or fermentation of soybean protein, soy sauce products containing added flavor or color must have a minimum protein content of 1.5% (w/w), a requirement that was met by all sauce samples in the present study [37]. While traditional soy sauces and fish sauces may achieve these higher protein levels due to differences in raw materials and processing [14,24], the adult honey bee substrate presents unique challenges related to its chitinous exoskeleton, which can limit protein accessibility during fermentation. Therefore, to enhance protein hydrolysis and increase protein content in the insect-based sauce, further optimization of fermentation conditions is necessary. Adjustments in fermentation parameters such as temperature, duration, and the proportion of A. oryzae koji starter could also support more effective proteolysis and free amino acid release. These targeted strategies focused on the biological and physical characteristics of adult honey bees will be critical for developing insect-based fermented sauces with protein content and functional qualities comparable to or surpassing those of traditional fermented condiments.
Table 3: Proximate composition (% w/w) of sauce samples after 60 days of fermentation.
| Treatments | Moisture | Protein | Carbohydrate | Fat | Ash |
|---|---|---|---|---|---|
| D53 | 84.91±0.00a | 1.58±0.11b | 0.816±0.04b | 0.26±0.04a | 13.10±0.28b |
| D53A | 84.68±0.05ab | 3.08±0.13a | 0.440±0.27b | 0.16±0.13ab | 12.76±0.17bc |
| D431 | 82.82±0.00c | 1.49±0.17b | 3.28±0.27a | 0.13±0.02ab | 14.02±0.18a |
| D431A | 82.78±0.79c | 2.80±0.07a | 2.83±0.98a | 0.10±0.02b | 12.59±0.21c |
| P-value | <0.001 | <0.001 | <0.001 | <0.001 | <0.001 |
SD: Standard deviation. The data were analyzed using an analysis of variance test, with results expressed as mean±SD. Means within the same column with different superscript letters are significantly different
Figure 1 represents a PCA biplot of physicochemical characteristics of sauces after fermentation. The linear feature extraction clearly explained the studied parameters’ relationship and provided each treatment’s behavior. The first two PCs explained 92.7% of the total variance of the dataset, meaning the PC scores of the samples projected on the different places in the PC space had highly different characteristics. The sauces from the D431A and D53A treatments demonstrated a unique quality compared to their closely clustered controls. Treatments with no fungal supplementation showed high similarity in physicochemical quality. PC loadings, the vector’s direction and length indicating the parameters’ contribution to the first two PCs, revealed that acidity, total N, total sugar, and pH were the key quality parameters separating sauces from control and fungal-supplementing treatments. Furthermore, the sauce from the D53A treatment contained distinct browning and Brix values.
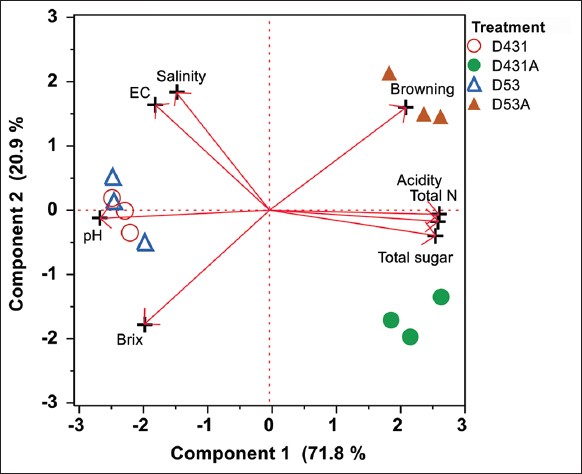 | Figure 1: Principal component analysis biplot of physicochemical characteristics of sauce samples after 60 days of fermentation. [Click here to view] |
The PC scores for color values from sauce fermented using the D53 treatment exhibited distinct characteristics, standing out the most compared to other sauce samples (PC1: 63.3%, PC2: 33.5%). The PC loadings indicated that this product had variations in a*, b*, and ΔE compared to others [Figure 2], which aligned with the findings presented in Table 2. These analyses revealed strong groupings and clear separation of treatments based on fermentation conditions, with key physicochemical parameters such as acidity, total nitrogen, and total sugar showing significant associations with color values [Table 1 and Figure 1]. The multivariate approach confirms that physicochemical changes during fermentation are closely linked to overall color development and product quality.
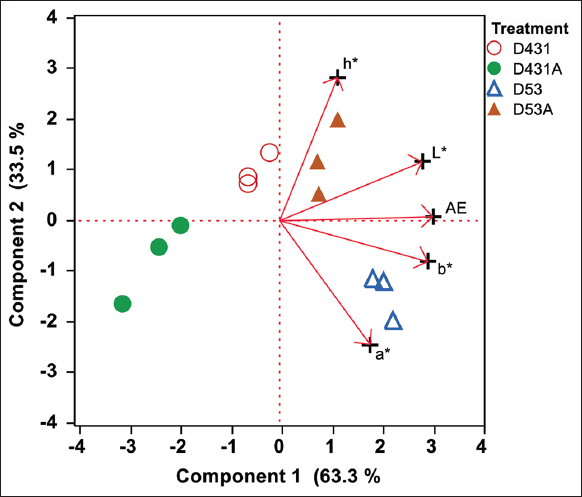 | Figure 2: Principal component analysis biplot of CIELAB Color Space values of sauce samples after 60 days of fermentation. [Click here to view] |
The PC scores in Figure 3 clearly showed the differences in proximate analysis between the standard treatments and those enhanced with fungal supplements. The PC loading on the PC2 axis, which explained 35.3% of the dataset variation, indicated that protein was an important factor influencing the D431A and D53A sauces. This study effectively utilized linear feature extraction through PCA to elucidate sauce quality resulting from the fermentation of adult giant honey bees.
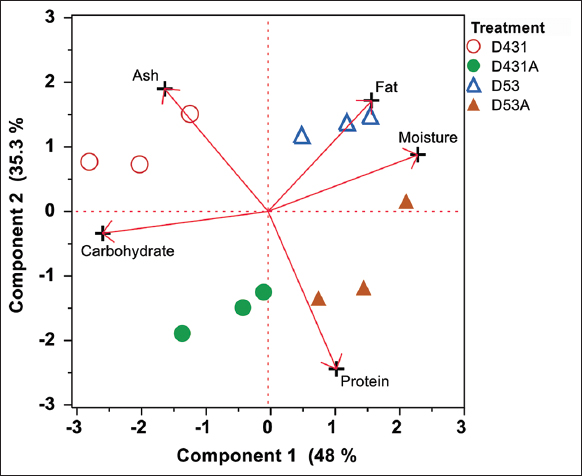 | Figure 3: Principal component analysis biplot of proximate of sauce samples after 60 days of fermentation. [Click here to view] |
PCA is a widely used chemometric technique for examining data features. The application of PCA allows for the observation of sample and variable behavior [38]. Danmek et al. [39] performed a PCA to analyze bee-based fermented sauce and found that the proximate and amino acids of the product from a novel fermentative formula had completely distinct qualities compared to conventional methods, with an 80% variance explanation depicted on PC1 and PC2 [Figure 3]. Luo et al. [40] analyzed 14 amino acids from 12 kinds of soy sauces and successfully graded a special soy sauce through the PCA technique. Therefore, this study and the aforementioned literature supported the usefulness of PCA for analyzing food quality and evaluating food characteristics.
4. CONCLUSION
The utilization of insects such as honey bees in fermented sauce production presents a promising direction for innovation within the food industry. Honey bees offer not only a sustainable protein source but also unique flavors and nutritional attributes. This study investigated the fermentation of adult A. dorsata using traditional soy sauce fermentation techniques with varying levels of rice flour supplementation. The results demonstrated notable changes in physicochemical properties throughout fermentation. The pH, TSS, salinity, and EC decreased over time, reflecting ongoing fermentation activity. In contrast, total nitrogen and protein content significantly increased, suggesting active protein degradation driven by fungal enzymes. Color changes (ΔE) indicated pronounced browning, while titratable acidity, total sugar, and reducing sugar also increased during fermentation. Differences were observed between sauces produced with and without rice flour, highlighting the influence of substrate composition on fermentation outcomes.
Future research should aim to optimize fermentation conditions to enhance protein recovery and improve product quality, particularly given the structural challenges posed by the chitinous exoskeleton of insects. Direct measurements of protease activity, along with detailed microbial profiling, will help clarify the role of microorganisms in protein degradation and overall fermentation performance. In addition, comprehensive analyses including organic acid profiling, amino acid and peptide characterization, and volatile compounds are recommended to deepen understanding of acidification pathways. Food safety and allergenicity are critical for insect-based fermented products. However, insect proteins may cross-react with shellfish allergens such as tropomyosin and arginine kinase, and comprehensive allergenicity testing was not performed. Future work should include a detailed analysis of allergenic proteins. Product labeling and consumer education are important for individuals with arthropod allergies. Further sensory evaluation and consumer acceptance studies will be crucial to ensure that insect-based fermented sauces meet desirable flavor and quality benchmarks and to assess their market potential. The fermented honey bee sauce shows strong potential as a natural umami enhancer due to its release of glutamic acid and other umami-active amino acids, making it suitable for use in processed foods, seasonings, and flavoring agents. With its elevated protein content and complex flavor profile, it can also function as a protein-rich condiment and a versatile flavor base. Overall, the integration of insects into fermented sauce production offers a novel and sustainable opportunity to develop value-added food products while promoting resource efficiency and reducing biological waste.
5. ACKNOWLEDGMENT
We gratefully acknowledge the researchers from Gyeongkuk National University, Republic of Korea, for their support and collaboration in this study. Special thanks to Kritjutha Bunprathueang, Chindanai Chanmaneevech, and Burit Luecha from the School of Agriculture and Natural Resources, University of Phayao, for their assistance.
6. AUTHORS’ CONTRIBUTIONS
All authors made substantial contributions to conception and design, acquisition of data, or analysis and interpretation of data; took part in drafting the article or revising it critically for important intellectual content; agreed to submit to the current journal; gave final approval of the version to be published; and agree to be accountable for all aspects of the work. All the authors are eligible to be author as per the International Committee of Medical Journal Editors (ICMJE) requirements/guidelines.
7. FUNDING
This was supported by grant no. N24A680011 from the National Research Council of Thailand and partially supported by Chiang Mai University and the National Research Foundation of Korea (NRF 2018R1A6A1A03024862).
8. CONFLICT OF INTEREST
The authors report no financial or any other conflicts of interest in this work.
9. ETHICAL APPROVAL
The study protocol was approved by the Institutional Animal Care and Use Committee of the Laboratory Animal Research Center, University of Phayao, Thailand (Approval No.: 1-015-68).
10. DATA AVAILABILITY
All the data is available from the authors and shall be provided upon request.
11. PUBLISHER’S NOTE
All claims expressed in this article are solely those of the authors and do not necessarily represent those of the publisher, the editors and the reviewers. This journal remains neutral with regard to jurisdictional claims in published institutional affiliation.
12. USE OF ARTIFICIAL INTELLIGENCE (AI)-ASSISTED TECHNOLOGY
The authors declare that they have not used artificial intelligence (AI)-tools for writing and editing of the manuscript, and no images were manipulated using AI.
REFERENCES
1. Wahbeh S, Anastasiadis F, Sundarakani B, Manikas I. Exploration of food security challenges towards more sustainable food production:A systematic literature review of the major drivers and policies. Foods. 2022;11(23):3804. [CrossRef]
2. Gravel A, Doyen A. The use of edible insect proteins in food:Challenges and issues related to their functional properties. Innov Food Sci Emerg Technol. 2020;59:102272. [CrossRef]
3. Yhoung-Aree J, Viwatpanich K. Edible insects in the Laos PDR, Myanmar, Thailand, and Vietnam. In:Paoletti MG, editor. Ecological Implications of Minilivestock. New Hampshire, USA:Science Publishers;2005. 415-40.
4. DeFoliart GR. Insects as food:Why the western attitude is important. Annu Rev Entomol. 1999;44(1):21-50. [CrossRef]
5. Krongdang S, Phokasem P, Venkatachalam K, Charoenphun N. Edible insects in Thailand:An overview of status, properties, processing, and utilization in the food industry. Foods. 2023;12(11):2162. [CrossRef]
6. Dogan E, Çekal N. Sustainable food alternative in gastronomy:Edible insects (entomophagy). Int J Agric Environ Food Sci. 2022;6(2):246-53. [CrossRef]
7. Akande AO, Jolayemi OS, Adelugba VA, Akande ST. Silkworm pupae (Bombyx mori) and locusts as alternative protein sources for high-energy biscuits. J Asia Pac Entomol. 2020;23(1):234-41. [CrossRef]
8. Scholliers J, Steen L, Fraeye I. Partial replacement of meat by superworm (Zophobas morio larvae) in cooked sausages:Effect of heating temperature and insect:Meat ratio on structure and physical stability. Innov Food Sci Emerg Technol. 2020;66:102535. [CrossRef]
9. Ghosh S, Meyer-Rochow VB, Jung C. Honey bees and their brood:A potentially valuable resource of food, worthy of greater appreciation and scientific attention. J Ecol Environ. 2021;45(1):31. [CrossRef]
10. Wongsiri S, Lekprayoon C, Thapa R, Thirakupt K, Rinderer TE, Sylvester HA, et al. Comparative biology of Apis andreniformis and Apis florea in Thailand. Bee World. 1997;78(1):23-35. [CrossRef]
11. Klunder HC, Wolkers-Rooijackers J, Korpela JM, Nout MJ. Microbiological aspects of processing and storage of edible insects. Food Control. 2012;26(2):628-31. [CrossRef]
12. Borremans A, Lenaerts S, Crauwels S, Lievens B, Van Campenhout L. Marination and fermentation of yellow mealworm larvae (Tenebrio molitor). Food Control. 2018;92:47-52. [CrossRef]
13. Mouritsen OG, Duelund L, Calleja G, Frøst MB. Flavour of fermented fish, insect, game, and pea sauces:Garum revisited. Int J Gastron Food Sci. 2017;9:16-28. [CrossRef]
14. Cho JH, Zhao HL, Kim JS, Kim SH, Chung CH. Characteristics of fermented seasoning sauces using Tenebrio molitor larvae. Innov Food Sci Emerg Technol. 2018;45:186-95. [CrossRef]
15. Kewuyemi YO, Kesa H, Chinma CE, Adebo OA. Fermented edible insects for promoting food security in Africa. Insects. 2020;11(5):283. [CrossRef]
16. Tyl C, Sadler GD. pH and titratable acidity. In:Nielsen S, editor. Food Analysis;Food Science Text Series. Cham, Switzerland:Springer;2017. [CrossRef]
17. Miller GL. Use of dinitrosalicylic acid reagent for determination of reducing sugar. Anal Chem. 1959;31(3):426-8. [CrossRef]
18. Zahidah HL, Lo D. The physicochemical properties of soy sauce made from tempeh. IOP Conf Ser Earth Environ Sci. 2022;1115(1):012094. [CrossRef]
19. Latimer GW. Official Methods of Analysis of AOAC International. Rockville, MD, USA:AOAC International;2016.
20. Brereton RG. Chemometrics for Pattern Recognition. Chichester:John Wiley &Sons;2009. [CrossRef]
21. Ajandouz EH, Tchiakpe LS, Ore FD, Benajiba A, Puigserver A. Effects of pH on caramelization and Maillard reaction kinetics in fructose? lysine model systems. J Food Sci. 2001;66(7):926-31. [CrossRef]
22. Lopetcharat K, Choi YJ, Park JW, Daeschel MA. Fish sauce products and manufacturing:A review. Food Rev Int. 2001;17(1):65-88. [CrossRef]
23. Hashiba H. Non-enzymic browning of soy sauce:Comparison of the browning of soy sauce with that of a sugar-amino acid model system. Agric Biol Chem. 1972;36(3):390-7. [CrossRef]
24. Wu TY, Kan MS, Siow LF, Palniandy LK. Effect of temperature on moromi fermentation of soy sauce with intermittent aeration. Afr J Biotechnol. 2010;9(5):702-6. [CrossRef]
25. Kim JS, Lee YS. A study of chemical characteristics of soy sauce and mixed soy sauce:Chemical characteristics of soy sauce. Eur Food Res Technol. 2008;227:933-44. [CrossRef]
26. Li C, Wang Y, Sha S, Yin H, Zhang H, Wang Y, et al. Analysis of the tendency for the electronic conductivity to change during alcoholic fermentation. Sci Rep. 2019;9(1):5512. [CrossRef]
27. Mizutani T, Kimizuka A, Ruddle K, Ishige N. Chemical components of fermented fish products. J Food Compos Anal. 1992;5(2):152-9. [CrossRef]
28. Jaisan C, Lee DS. A mathematical model to predict ripening degree of kimchi, a Korean fermented vegetable for meeting consumer preference and controlling shelf life on real time basis. Food Packag Shelf Life. 2017;12:23-7. [CrossRef]
29. Song YC, Lee SP. Evaluation in physicochemical properties of soy sauce fortified with soymilk residue (Okara koji). Korean J Food Preserv. 2013;20(6):818-26. [CrossRef]
30. Walker GA, Nelson J, Halligan T, Lima MM, Knoesen A, Runnebaum RC. Monitoring site-specific fermentation outcomes via oxidation reduction potential and uv-vis spectroscopy to characterize “hidden”parameters of pinot noir wine fermentations. Molecules. 2021;26(16):4748. [CrossRef]
31. Sharma R, Garg P, Kumar P, Bhatia SK, Kulshrestha S. Microbial fermentation and its role in quality improvement of fermented foods. Fermentation. 2020;6(4):106. [CrossRef]
32. Chou CC, Ling MY. Biochemical changes in soy sauce prepared with extruded and traditional raw materials. Food Res Int. 1998;31(6-7): 487-92. [CrossRef]
33. Luh BS. Industrial production of soy sauce. J Ind Microbiol. 1995;14:467-71. [CrossRef]
34. Li Y, Zhao H, Zhao M, Cui C. Relationships between antioxidant activity and quality indices of soy sauce:An application of multivariate analysis. Int J Food Sci Technol. 2010;45(1):133-9. [CrossRef]
35. Lee KH, Kim EJ, Choi HS, Park SY, Kim JH, Song J. Quality characteristics of popped rice Doenjang prepared with Bacillus subtilis strains. Food Sci Preserv. 2015;22(4):545-52. [CrossRef]
36. Sharma G, Wu W, Dalal EN. The CIEDE2000 color-difference formula:Implementation notes, supplementary test data, and mathematical observations. Color Res Appl. 2005;30(1):21-30. [CrossRef]
37. Food Division, Ministry of Public Health. Notification of the Ministry of Public Health Re:Food Seasoning Derived from Hydrolysis or Fermentation of Soybean Protein. Bangkok (Thailand):Ministry of Public Health;2010. Available from: https://food.fda.moph.go.th/food-law/f2-fermt-soy-prot [Last accessed on 2025 Jan 01].
38. Theanjumpol P, Maniwara P. Physico-chemical and cooking qualities of fresh and stored pumpkins. Hortic Environ Biotechnol. 2022;63(1):101-13. [CrossRef]
39. Danmek K, Ghosh S, Jung C, Wu MC, Maniwara P, Hongsibsong S, et al. Fermentation and physicochemical properties of sauce made from adult worker honey bees (Apis mellifera) using Aspergillus oryzae. Int J Food Sci Technol. 2025;60(1):vvaf095. [CrossRef]
40. Luo T, Xie Y, Dong Y, Liu A, Dong Y. Quality assessment of soy sauce using underivatized amino acids by capillary electrophoresis. Int J Food Prop. 2017;20(suppl 3):S3052-61. [CrossRef]