
1. INTRODUCTION
Many by-products and waste of plants generated from the processing of plants and food come to the stage in the agro-industrial sector. Most of this waste is generated from vegetables and fruits, which are processed to produce various items, including juice, jam, and canned products. Many fruits have been used in the cosmetics and drug industries, generating considerable waste [1]. It is estimated that one-third of the food produced globally is lost annually, including fruits. In 2020, worldwide fruit production was over 800 million tonnes, with citrus, bananas, grapes, and apples ranking top in production and consumption, fresh and processed. Therefore, a lot of by-products and wastes are created in fruit processing. About one-third of fruits are wasted throughout the production and processing chain from farm to market [2].
Koi fish (Cyprinus rubrofuscus) are considered ornamental fishes that have won the hearts of many enthusiasts due to colorful variations of colors, coloration patterns, and swimming patterns. Among ornamental fishes, Japans leading export species is Koi. In 2022, ornamental fish exports accounted for nearly 48.6 million USD in Japan, more than doubling during 14 years, when the export accounted for nearly 6.5% of global or world trade in ornamental fish [3]. Maintaining water conditions following standards for parameters such as temperature, pH, salinity, amount of oxygen dissolved, nitrate, ammonia, nitrogen dioxide, phosphate, and iron shows a practical setting for Koi fish to exist under good living conditions [4]. Aspects of sustainability in agriculture are fundamentally necessary for soil health, environment, and future production. The most interesting of the modern technologies gaining attention is organic bio-effluents, including fish effluents, as viable substitutes for synthetic fertilizers. Aquacultural wastes give fish effluents rich in nutrients and micronutrients such as phosphorus, nitrogen, and potassium, making those significant organic amendments for crop growth and soil fertility [5]. Due to the high value of nutrition and various functional compounds, fruit wastes could be used to formulate aquafeeds, which will also contribute to the sustainable management of waste and resource utilization [6].
Strawberry is a small, herbaceous plant that spreads via runners. A hybrid of Fragaria chiloensis and Fragaria virginiana, Fragaria × ananassa is a cultivated variety. India contributes about 10.5% of the total fruit production of strawberries in the world and is the second largest among fruit growers worldwide. The country produces 97.55 million tons of fruits harvested from 6.50 million hectares, with a productivity of about 14.96 MT/ha [7]. The importance of optimizing production practices to enhance yield and fruit quality is seen as increasing global demand for strawberries, especially for cultivars like Camarosa. Strawberries are economically valuable and highly nutritious due to their high vitamin, antioxidant, and phytochemical content [8]. Unfortunately, rigorous cultivation practices based on chemical fertilizers have created significant obstacles to soil health and long-term environmental sustainability [9]. Increasing awareness of the sustainability alternative will improve the productivity of strawberries while minimizing the ecological footprints associated with strawberry production.
The application of fish effluents to agriculture is very beneficial. These bio-effluents have all the nutrient requirements of plants and stimulate soil microbial activity, improving the availability of nutrients and nutrient uptake. The organic matter in fish effluents also helps reduce bulk density, improve soil structure, and retain soil moisture [10]. It has been shown that plants treated with fish effluents have improved growth parameters, higher yield, and enhanced fruit quality, which can be used as an alternative chemical fertilizer [11-13]. Nutrient release from fish effluent also reduces the risks of nutrient leaching and enhances environmental conservation [14]. Evaluated the growth and production of hot peppers in a field experiment using aquaculture effluent. The wastewater accumulated from a catfish pond [15] irrigated water spinach (Ipomoea aquatica) ponds. Fish effluent was used as a foundation of nutrients and irrigation for sustainable agriculture [16]. They made up a nutrient-rich aqueous solution of carboxymethylcellulose-thickened fish effluent using water.
Several studies have documented the utilization of feeds made from spoiled fruit, including the preparation of feeds from pineapple waste [17,18], sweet orange peels [19], papaya peels [20], and lemon peel extract [21]. However, this study aims to explore the application of fish effluents, derived from feeding fruit peels, in growing Camarosa strawberries, with a particular focus on the effects on growth, yield, and fruit quality. Integrating fish effluents with fruit peels — an abundantly available agricultural by-product enhances nutrient profiles and presents a sustainable fertilizer solution, aligning with circular economy principles. These principles aim to reduce waste and pollution, extend product life, and regenerate nature. The selection of pineapple and banana peels as feed sources for Koi fish effluents is based on their rich nutrient profiles and environmental benefits. Banana peels, for example, are known to contain significant amounts of phosphorus, iron, calcium, magnesium, sodium, zinc, copper, potassium, and manganese [22]. Using these peels addresses waste management issues by recycling organic waste into valuable agricultural inputs, contributing to environmental sanitation and promoting sustainable agriculture. However, contradictory results have been observed in studies investigating the influence of fish effluent on strawberry growth, especially where the type of feed is not specified [23,24]. Furthermore, various studies indicate that fish feed made from fruit wastes has positive effects on fish health. The innovation of this research lies in its hypothesis that the effluent produced from Koi fish-fed pineapple and banana peels can enhance the growth, quality, and yield of strawberries. This research combines organic waste recycling with fish-based nutrient delivery to promote sustainable agricultural practices. The objectives of the research are to evaluate the impact of fish effluents from pineapple and banana peel feeds on the growth of Camarosa strawberries, assess the effects of these effluents on the yield and fruit quality of strawberries, investigate the nutrient profiles of the fish effluents and their contribution to strawberry growth and quality, and explore the environmental and waste management benefits of using fruit peels as feed sources for Koi fish.
2. MATERIAL AND METHODS
2.1. Site of Experimentation
The study was started in November 2023–2024 at the Agricultural Farm of Lovely Professional University, Phagwara, Punjab (India). The experimental area is longitudinally situated at 75°42’4” and at a latitude of 31°14’41”. The experimental region from November 2023 to June 2024 received an annual rainfall of 0.9 mm, having a maximum temperature of up to 27.2°C, and a minimum temperature of 12.5°C. The relative humidity was measured to be 86.5%.
2.2. Treatment Details
In the current study, the Camarosa plants were subjected to five treatments of different types of irrigation applied, namely absolute water (AW), water + RDF (WR), commercial fish feed effluent (CFE), pineapple peel fish feed effluent (PFE), and banana peel fish feed effluent (BFE) [Table 1]. AW is considered a control for the study as there is no application of fish effluent or RDF to the plants.
Table 1: Treatment details of different fish feed effluents used for strawberry production.
| Treatments | Type of irrigation | Quantity applied |
|---|---|---|
| AW | Absolute water | 250 mL |
| WR | Water+RDF | 250 mL |
| CFE | Commercial fish feed effluent | 250 mL |
| PFE | Pineapple peel fish feed effluent | 250 mL |
| BFE | Banana peel fish feed effluent | 250 mL |
2.2.1. Effluent preparation
These effluents were prepared by feeding the Koi fish with commercial feed for fish, and feed prepared from pineapple peel and banana peel. While the effluents were used for irrigation purposes, the Koi fish were fed 3 times a day with different feeds. As per recommendation by the pet fish store seller, the feeds were given to the fish only as much as they can consume in 2–5 min. The effluents were taken every 3rd day. When the fish tank water needed to be changed, the effluent mixed with fish waste was collected and was then provided as irrigation to Camarosa plants.
2.3. Agronomic Practices
Camarosa plants were planted in polybags in which the soil was mixed with cow dung or FYM. Recommendations suggest that for field study, 25–50 tonnes per hectare of FYM is applied; thus, for growing plants in polybags, 20–30% FYM by volume was mixed with the soil. The mixture had a pH of 6.5, and the electrical conductivity (EC) was measured at 0.22 dSm−1 [Table 2]. This mixture was used only for WR. RDF is the recommended dose of fertilizer which is 44:32:40 kg/acre for strawberries as per Punjab Agriculture University, Ludhiana, Punjab, India.
Table 2: Physico-chemical properties of soil pre-treatment.
| Parameters | Average values |
|---|---|
| pH | 6.5 |
| EC (dS/m) | 0.22 |
| Available Nitrogen (%) | 48.72 |
| Potassium (mg/g) | 2.28 |
| Phosphorus (mg/g) | 16.12 |
In the remaining treatments, only soil was used. This procedure was performed to see the dynamic effect of fish effluents on plants with no additional fertilizer sources, which may help better understand the results. In each replication 10 plants were planted; however, 3 random were selected for observation. The polybags afterward were placed at 20 cm × 25 cm spacing.
2.4. Observations Recorded
2.4.1. Plant growth parameters
The leaf number and plant spread for each plant at 30 days, 60 days, and 90 days after planting were observed. The leaf number was measured by counting the leaves on the plant, and the plant spread was measured in the directions of North-South and East-West across the crown of the plant, and the average plant spread was calculated.
2.4.2. Flowering and fruiting parameters
The days to flowering were predetermined from the planting date, and the flower count was totaled for each plant. The fruit set percentage was calculated using the formula presented herewith [25].
 |
2.4.3. Biochemical parameters
The present study observed parameters such as total phenols (TPs), total proteins, total soluble solids TSS, titratable acidity (TA), and ascorbic acid content.
2.4.3.1. TPs (mg/g)
The TPs were estimated by Folin Ciocalteau Reagent [26]. Aqueous Na2CO3 (4 mL, 1 M) and Folin Ciocalteau Reagent of 5 mL volume diluted in 1:10 ratio with distilled water were combined with the leaf extract samples. The combination was then kept still for around 15 min, and the phenols were determined by a spectrophotometer at a wavelength of 765 nm. It is expressed as gallic acid equivalent per gram.
2.4.3.2. Total Protein (mg/g)
A plant sample weighing 100 mg was obtained and put into a mortar. Cold extraction (10 mL) was added. Until a fine slurry was created, the mortar was kept in the ice bucket and crushed with a pestle. For 15 min, the homogenates were centrifuged at 15,000 revolutions per minute. A crude protein extract was made from the collected supernatant. Mix thoroughly and let the color develop for at least 5 min, but no more than 30 min, using 5 mL of diluted dye, 0.2 mL of crude protein extract obtained from the leaf, and 0.8 mL of distilled water. When the red dye attaches to proteins, it turns blue. Measure the absorbance in a spectrophotometer at 595 nm [27].
2.4.3.3. TSS (°B) and TA (%)
10 mL of fruit juice was titrated against 0.1 N Sodium hydroxide, yielding the titratable acidity (TA) as a citric acid percentage. Brix degree (°Brix), a measurement of TSS, was ascertained using a refractometer [28].
2.4.3.4. Ascorbic acid (mg/g)
The reagent solution was combined with 5.322 g sodium phosphate, 2.471 g ammonium molybdate, and 0.6 M sulfuric acid (500 mL) [29]. 0.3 mL of the sample and 3 mL of the reagent were combined, and the combination was incubated in a water bath at a temperature of 95°C for about 90 min. Before the absorbance measurement at a wavelength of 695 nm, it was cooled in water for 5 min following incubation. Findings presented in mg/g of ascorbic acid equivalent. V is the pipette sample volume (L), W is the sample weight (g), Fp is the dilution factor, and C is the concentration of the sample (mg/L) to compute vitamin C levels.
 |
2.5. Yield Parameters
The fruit was manually harvested every 5–6 days. An electronic balance was used to weigh the fruits, and the average weight of the berries was calculated and displayed in grams (g). The total fruit number from each plant was multiplied by the average fruit weight (FW) to observe the average yield of fruits expressed in g/plant [30].
Yield (g) = Total number of fruits × Average fruit weight
2.6. Statistical Analysis
The data were designed in Completely Randomized Design in 3 replications. The observed data were statistically analyzed by the one-way analysis of variance test using OPSTAT and R studio. The statistical significance difference among the treatments was analyzed at P < 0.05 using the Duncan’s test. The average value of each trait was analyzed statistically to estimate correlation. Pearson’s correlation and PCA were computed in R studio using the corrupt and factoMineR packages to quantify each trait’s impact on strawberry yield [31].
3. RESULTS AND DISCUSSION
3.1. Plant Growth Parameters
The data recorded for growth attributes are presented in Table 3, which indicates that the application of different types of irrigation significantly influenced the growth of Camarosa strawberry. There was a significant difference (P < 0.05) among the treatments.
Table 3: Mean value of various physiological and biochemical parameters of strawberry under different irrigation application.
| Observations | Different irrigation water | ||||
|---|---|---|---|---|---|
| Absolute water | Water + RDF | Commercial fish feed effluent | Pineapple peel feed effluent | Banana peel feed effluent | |
| Leaf count (30 DAP) | 13.40±0.88b | 14.27±0.75ab | 14.40±0.84a | 14.82±0.72a | 14.42±0.81a |
| Leaf count (60 DAP) | 16.64±0.50a | 17.64±0.61a | 17.20±0.37a | 17.27±0.55a | 17.29±0.63a |
| Leaf count (90 DAP) | 19.58±0.31a | 20.36±0.25a | 20.04±0.18a | 19.82±0.26a | 20.31±0.22a |
| Plant spread (30 DAP) | 16.53±0.23a | 16.87±0.15a | 17.68±0.18a | 17.21±0.20a | 16.73±0.24a |
| Plant spread (60 DAP) | 22.11±0.29c | 26.63±0.18b | 28.87±0.23a | 28.19±0.14a | 25.88±0.18b |
| Plant spread (90 DAP) | 25.21±0.35b | 29.76±0.26a | 30.24±0.30a | 30.53±0.21a | 29.89±0.20a |
| Days to flowering | 67.00±0.30a | 66.67±0.16a | 66.00±0.25ab | 65.00±0.11b | 66.33±0.21ab |
| Flower count | 20.20±0.48c | 21.62±0.66b | 22.16±0.71ab | 23.20±0.73a | 22.40±0.77ab |
| Fruit count | 15.16±0.21c | 16.71±0.26b | 17.18±0.17a | 18.20±0.21a | 17.33±0.32a |
| Fruit volume (cc) | 10.42±0.70b | 11.69±0.64ab | 12.02±0.66a | 12.09±0.66a | 11.96±0.71ab |
| Fruit weight (g) | 11.66±1.12b | 12.40±1.19ab | 12.95±1.27ab | 13.45±1.41a | 13.80±1.30a |
| Fruit set (%) | 74.77±1.12b | 76.96±0.88a | 77.26±0.69a | 78.25±0.67a | 77.04±0.74a |
| Total phenols (mg/g) | 0.14±0.01a | 0.15±0.01a | 0.16±0.01a | 0.17±0.01a | 0.16±0.01a |
| Total protein (mg/g) | 0.33±0.02b | 0.39±0.03b | 0.44±0.03a | 0.48±0.03a | 0.50±0.03a |
| TSS (ºB) | 8.29±0.53c | 8.93±0.50bc | 9.50±0.50ab | 9.70±0.49a | 9.86±0.47a |
| Titratable acidity (%) | 0.40±0.02b | 0.42±0.01b | 0.47±0.03ab | 0.53±0.05a | 0.51±0.04ab |
| Ascorbic acid (mg/100 g) | 41.23±0.32d | 43.40±0.26c | 46.74±1.21b | 50.80±0.38a | 51.36±0.35a |
| Fruit yield per plant (g) | 183.06±23.28c | 216.31±28.16b | 232.83±31.77ab | 255.69±35.56a | 249.12±32.28a |
*All values of the parameters are the mean and standard error of three replications. The superscript letters represent the significance of the mean values at P<0.05. TSS: Total soluble solids
3.1.1. Leaf number at different days of planting
At 30 days after planting, the maximum leaf number was observed in plants treated with pineapple effluent (14.82), followed by banana peel effluent (14.42). In contrast, the lowest was recorded under the absolute control (13.40). The highest leaf count at 60 days after planting was found with banana peel effluent (17.29), and the lowest under absolute control (16.64). On the other hand, at 90 days after planting, WR treatment produced the highest number of leaves (20.36), whereas the lowest was again under absolute control (19.58). Maximum leaf number was observed in strawberries when fish effluent was applied [23]. Maximum leaf number and increased root and shoot dry weight was observed in strawberries under the aquaponics system [32].
3.1.2. Plant spread at different days of planting
All treatments significantly influenced the plant spread, with the highest spread deriving from the Commercial fish feed effluent at 30 days after planting (17.68 cm) and 60 days after planting (28.87 cm), with pineapple peel effluent following closely at 60 days after planting (28.19 cm). After 90 days from planting, the plant was spread on treatments with pineapple peel effluent, which recorded a maximum of 30.53 cm. On the contrary, absolute control marked the least spread in all stages with values of 16.53 cm, 22.11 cm, and 25.21 cm at 30, 60, and 90 days, respectively.
3.1.3. Days to flowering
Pineapple peel effluent is responsible for hastening flowering by increasing the time from application to flowering by nearly 65 days in plants, thereby hastening the transition between the vegetative and reproductive phases in plants. The nutrient or component composition from pineapple peel effluent would, thus, probably augment several physiological phenomena critical to triggering flowering, such as hormonal regulation and nutrient availability. Plants, however, were delayed in flowering under absolute control at 67 days. This was primarily associated with limited nutrient input and ineffective growing conditions, which could affect the switch from vegetative to reproductive development. Strawberry plants flowered in shorter days when treated to organic fish effluent [23].
3.1.4. Flower and fruit count
Applying effluent from pineapple peel led to the highest flowering (23.20) and fruiting (18.20), proving its great advantage in the reproductive performance of Camarosa strawberry plants. This advantage results from the effluent nutrient composition that probably optimizes physiological activities like flowering induction, fruit set, and nutrient uptake. On the contrary, Absolute control produced the lowest flowering (20.20) and fruit count (15.16) values, indicating that the availability of nutrients was insufficient and not very conducive to reproductive development. Specifically, the highest fruit counts were recorded where strawberries were grown in an aquaponics system [32].
3.1.5. Fruit volume (FV) (cc) and weight (g)
The higher volume of fruit seen in plants treated with pineapple peel effluent (12.09 cc) was caused by an increase in the effluent’s overall nutrient-dense condition, thereby enhancing cell division and expansion during fruit formation. Where an effluent is rich in macro- and micronutrients, it is likely to optimize metabolic and enzymatic activities and thus contribute to good fruit size. The smallest was, however, recorded under absolute control (10.42 cc), indicating little nutrient availability, thus limiting fruit growth.
Also, banana peel effluent recorded the top-most FW (13.80 g); this might indicate that the effluent enhanced nutrient uptake and internal movement, leading to improved fruit filling and biomass accumulation, possibly due to the high organic content in the banana peel effluent, continuous supply of nutrients and bioactive substances furnished better quality of the fruit per se. On the other hand, the lowest FW in absolute control (11.66g) was due to unfavorable growing conditions and an insufficient nutrient supply, which inhibited the capacity of plants to use their resources for fruit development efficiently. Strawberries performed the best in closed-loop aquaponic systems, from which the maximum FW per plant was obtained [32].
3.1.6. Fruit set (%)
The highest percentage of fruit set was recorded from the plants treated with pineapple peel effluent (78.25%), while those irrigated with commercial fish feed effluent recorded a close second (77.26%). Much of the comparatively better performance can be due to the nutrient-rich organic effluent composition that may have positively influenced flower fertilization, ovary development, and eventual fruit formation by improving physiological processes such as pollen viability, fertilization efficiency, and hormonal regulation. On the contrary, the lowest percentage of fruit set was recorded in absolute control treatment (74.76%) due to the likely low nutrient availability and poor physiological conditions that might have limited the reproductive success of the plants and the effectiveness of turning flowers into fruits.
3.2. Biochemical Parameters
Biochemical parameters like TPs, total proteins, TSS, TA, and ascorbic acid are presented in Table 3 and are significantly influenced at P < 0.05 by the application of different irrigation waters. The highest TP content (0.17 mg/g) was recorded in plants treated with pineapple peel effluent, reflecting its potential to enhance antioxidant accumulation. The banana peel effluent contained the maximum protein content (0.50 mg/g), making it superior in nitrogen assimilation and protein biosynthesis. The maximum TSS was also obtained from banana peel effluent (9.86 °Brix), indicating increased sugar accumulation and sweetness of fruits. For TA, the highest value was recorded from pineapple peel effluent (0.53%), whereas Absolute control had the lowest acidity (0.40%), thus showing the impact of nutrient supplementation on acid metabolism. Ascorbic acid content was the highest in banana peel effluent (53.31 mg/100g)-one of the critical parameters for nutritional quality, which increased the nutritive value of fruits. On the contrary, most parameters consistently showed the lowest values under Absolute control. This suggests the effect of nutrient limitation concerning these quality traits. Ascorbic acid, TSS, and TA increased with the application of fish effluent at the phenological stages of cherry tomato [33].
3.3. Fruit Yield Per Plant (YPP) (g)
With the highest YPP (255.69 g), pineapple peel effluent demonstrated exceptional effectiveness in raising crop productivity overall. Its nutrient-rich makeup may have contributed to this, as it likely improved plant growth, reproduction, and resource allocation. On the contrary, the least YPP was measured under Absolute control (183.06 g), showing the antagonistic effects of limited nutriments on the crop’s growth and fruiting potential with significance at P < 0.05. An increase in the yield of strawberries was observed when the plants were grown in the aquaponic system [34]. Maximum YPP was observed in sweet pepper when applied with 100% fish pond water [11]. Applying fish effluent (aquaculture) resulted in a higher average tomato fruit YPP [35].
3.4. Pearson’s Correlation for Different Parameters of Camarosa Strawberry under Different Irrigation Applications
The analysis for the correlation may well be characteristics of the multifactorial influence on YPP of Camarosa strawberries [Figure 1]. In addition, yield could correlate with some very strong positive physiologically vegetative correlated yield components or parameters: FW (r = 0.99), FV (r = 0.98), and fruit set percentage (r = 0.98). Further, total protein (r = 0.97), TPs (r = 0.96), and TSS (r = 0.97) strongly collaborated to yield as they exposed the underlying metabolic and nutritional roles. Plant spread and leaf count at different development stages also gave strong positive correlations (r = 0.76–0.91), showing how robust vegetative growth supported higher gains through improved photosynthesis and resource allocation. Conversely, a negative correlation with days to flowering (r = −0.82) indicates an increase in early transition by reproduction to gain a good yield. Therefore, growth physiology traits and biochemical quality intertwine to maximize straw yield. Such findings were attained by [36], whereby agronomic characteristics such as fruit count and weight showed a positive correlation. Strongly to moderately correlated traits to several commercial fruits and mass thereof found a relationship [37].
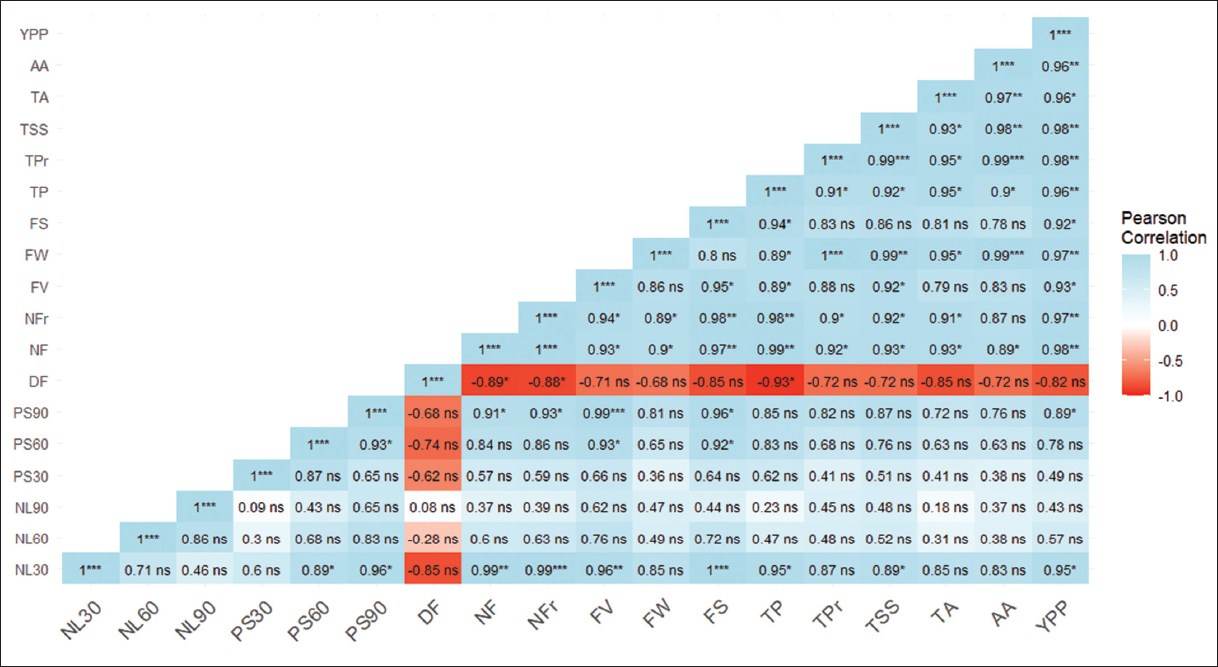 | Figure 1: Pearson correlation for different characters under study (significance at probability of 0.001, 0.01 and 0.05 is represented by ***, ** and * correspondingly. NL30: Leaf count at 30 DAP, NL60: Leaf count at 60 DAP, NL90: Leaf count at 90 DAP, PS30: Plant spread at 30 DAP, PS60: Plant spread at 60 DAP, PS90: Plant spread at 90 DAP, DF: Days to flowering, NF: Flower count per plant, NFr: Fruit count per plant, FV: Fruit volume [cc], FW: fruit weight [g], FS: Fruit set percentage [%], TP: Total phenols, TPr: Total protein [mg/g], TSS: Total soluble solids [°B], TA: Titrable acidity [%], AA: Ascorbic acid [mg/100g] and YPP: fruit yield per plant [g]). [Click here to view] |
3.5. Principal Component Analysis Biplot and Scree Plot Interpretation
The PCA biplot depicts variable relationships along treatments concerning their contributions to the first two principal components [Figure 2], explaining up to 90% of the total variance (79.7% by Dim.1 and 10.3% by Dim.2) in Figure 3. Dim. 1 is the principal axis because this dimension has the most variability as treatments like AW and WR are positioned far away from the origin. AW has a negative correlation, whereas WR adds up positively with yield-related variables such as leaf count (NL90) and plant spread (PS90), indicating increased growth parameters. Dim.2, as the secondary axis, separates treatments into Pineapple peel fish feed effluent, which shows unique characteristics on quality-related traits such as total phenols (TP) and anthocyanin (TA). The clustering of TP, TP-related (TPr), and TA thus depicts a high positive correlation among these quality traits but aligned with productivity-enhancing treatments such as WR-defined growth parameters (e.g., NL90, PS90). AW is set quite apart from all other treatments, perhaps because this reflects low measure-related performance. The Pineapple peel fish feed effluent positions positively along Dim.2, highlighting the unique influence on fruit quality. This biplot, therefore, clearly differentiates all the treatments and shows variability among them, as WR is indicated as the best representative treatment regarding growth and yield while considering Pineapple peel fish feed effluent as its contribution to the enhancement of fruit quality. Discreet representation by scree plot indicates variance shared by all principal components for the contribution of each dimension to total variability in the dataset [Figure 3]. The steep discrepancy between Dim.1 and Dim.2 denotes a sharp reduction in the capacity to explain further coordinate axes. The PCA analysis in the nursery samples was carried out during the Nile tiapia removal in fish farming sites, suggesting the advantage of large ponds for obtaining better quality fish effluent [38]. PCA analysis for the nutrient profiling in onion bulbs was performed [39]. The fish effluent treatment showed a homogenous nutrient profile amongst other treatments, which showed higher variability.
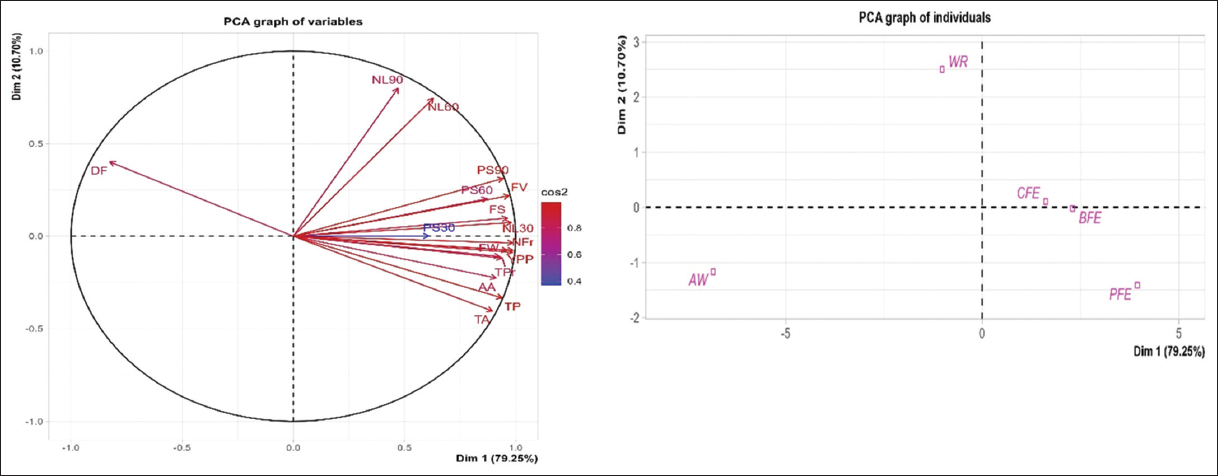 | Figure 2: Principal Component Analysis Biplot (NL30: Leaf count at 30 DAP, NL60: Leaf count at 60 DAP, NL90: Leaf count at 90 DAP, PS30: Plant spread at 30 DAP, PS60: Plant spread at 60 DAP, PS90: Plant spread at 90 DAP, DF: days to flowering, NF: flower count per plant, NFr: fruit count per plant, FV: fruit volume [cc], FW: Fruit weight [g], FS: Fruit set percentage [%], TP: Total phenols, TPr: Total protein [mg/g], TSS: Total soluble solids [°B], TA: Titrable acidity [%], AA: Ascorbic acid [mg/100 g] and YPP: Fruit yield per plant [g], AW: Absolute water, WR: Water + RDF, CFE: Commercial fish feed effluent, PFE: Pineapple peel fish feed effluent, BFE: Banana peel fish feed effluent). [Click here to view] |
 | Figure 3: Scree plot illustrating how each variable (5 treatments) of strawberry reflects variability. [Click here to view] |
3.6. Direct and Indirect Effects of Physical and Chemical Traits on the Yield of Camarosa Strawberry
A path analysis diagram [Figure 4] and correlation matrix [Table 4] offered insight into the relationship between vegetative, reproductive, and biochemical traits that affect YPP in strawberries. Most fruit-related traits exert a significant influence on YPP: FW (0.86), FV (0.89), TSS (0.99), TA (0.93), TPs (0.91), traits (TPr: 0.99), and antioxidant activity (AA: 0.96) have very high direct path effects. Support for these through the correlation matrix indicates YPP being significantly positively correlated with FV (0.801), FW (0.827), TSS (0.969), TA (0.975), AA (0.981), and TPr (0.953), confirming that improvement in quality and biochemical nature of fruits is instrumental in increasing yield. Conversely, traits associated with vegetative growth, namely number of leaves (NL30: −0.686, 60 days: −0.405, 90 days: −0.431), plant spread (PS30: −0.562, 60 days: −0.526, 90 days: −0.548), and days to flowering (DF: −0.542), show low, even negative correlation with YPP.
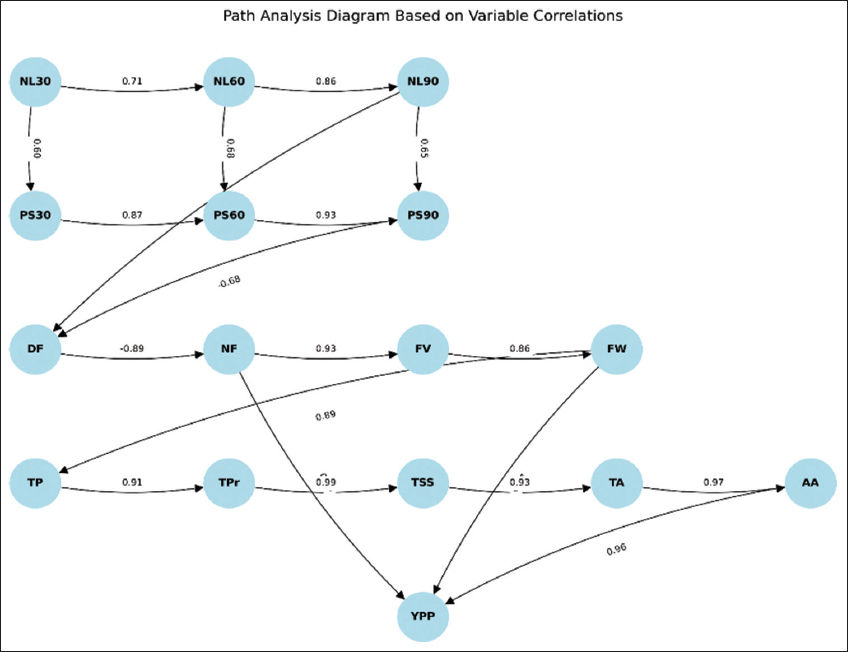 | Figure 4: Path analysis (1: Leaf count at 30 DAP, 2: Leaf count at 60 DAP, 3: Leaf count at 90 DAP, 4: Plant spread at 30 DAP, 5: Plant spread at 60 DAP, 6: Plant spread at 90 DAP, 7: Days to flowering, 8: Flower count per plant, 9: Fruit count per plant, 10: Fruit volume [cc], 11: Fruit weight [g], 12: Total phenols, 13: Total protein [mg/g], 14: Total soluble solids [°B], 15: Titrable acidity [%], 16: Ascorbic acid [mg/100 g] and 17: Fruit yield per plant [g]). [Click here to view] |
Table 4: Correlation matrix of various parameters of Camarosa strawberry.
| NL30 | NL60 | NL90 | PS30 | PS60 | PS90 | DF | NF | NFr | FV | FW | FS | TP | TPr | TSS | TA | AA | YPP | |
|---|---|---|---|---|---|---|---|---|---|---|---|---|---|---|---|---|---|---|
| NL30 | 1.00 | |||||||||||||||||
| NL60 | 0.01 | 1.00 | ||||||||||||||||
| NL90 | 0.04 | 1.00 | 1.00 | |||||||||||||||
| PS30 | 0.14 | 0.97 | 0.99 | 1.00 | ||||||||||||||
| PS60 | 0.06 | 0.96 | 0.98 | 0.99 | 1.00 | |||||||||||||
| PS90 | 0.07 | 0.96 | 0.98 | 1.00 | 1.00 | 1.00 | ||||||||||||
| DF | 0.64 | -0.50 | -0.45 | -0.29 | -0.30 | -0.29 | 1.00 | |||||||||||
| NF | 0.68 | -0.50 | -0.45 | -0.30 | -0.31 | -0.30 | 1.00 | 1.00 | ||||||||||
| NFr | -0.31 | -0.83 | -0.82 | -0.85 | -0.81 | -0.83 | 0.12 | 0.11 | 1.00 | |||||||||
| FV | -0.47 | -0.75 | -0.74 | -0.78 | -0.72 | -0.74 | 0.04 | 0.02 | 0.98 | 1.00 | ||||||||
| FW | -0.50 | -0.76 | -0.75 | -0.80 | -0.74 | -0.77 | 0.00 | -0.02 | 0.98 | 1.00 | 1.00 | |||||||
| FS | -0.52 | -0.75 | -0.75 | -0.80 | -0.75 | -0.77 | -0.04 | -0.06 | 0.97 | 0.99 | 1.00 | 1.00 | ||||||
| TP | -0.22 | -0.65 | -0.61 | -0.58 | -0.51 | -0.54 | 0.35 | 0.32 | 0.87 | 0.88 | 0.85 | 0.83 | 1.00 | |||||
| TPr | -0.62 | -0.53 | -0.54 | -0.63 | -0.58 | -0.60 | -0.32 | -0.33 | 0.90 | 0.93 | 0.94 | 0.95 | 0.72 | 1.00 | ||||
| TSS | -0.64 | -0.51 | -0.52 | -0.62 | -0.57 | -0.60 | -0.36 | -0.38 | 0.88 | 0.91 | 0.93 | 0.94 | 0.68 | 1.00 | 1.00 | |||
| TA | -0.63 | -0.49 | -0.50 | -0.61 | -0.56 | -0.59 | -0.39 | -0.40 | 0.87 | 0.90 | 0.92 | 0.93 | 0.66 | 1.00 | 1.00 | 1.00 | ||
| AA | -0.65 | -0.46 | -0.47 | -0.58 | -0.53 | -0.56 | -0.43 | -0.44 | 0.84 | 0.88 | 0.90 | 0.91 | 0.63 | 0.99 | 1.00 | 1.00 | 1.00 | |
| YPP | -0.69 | -0.41 | -0.43 | -0.56 | -0.53 | -0.55 | -0.54 | -0.55 | 0.77 | 0.80 | 0.83 | 0.85 | 0.48 | 0.95 | 0.97 | 0.98 | 0.98 | 1.00 |
Where, NL30: Leaf count at 30 DAP, NL60: Leaf count at 60 DAP, NL90: Leaf count at 90 DAP, PS30: Plant spread at 30 DAP, PS60: Plant spread at 60 DAP, PS90: Plant spread at 90 DAP, DF: Days to flowering, NF: Flower count per plant, NFr: Fruit count per plant, FV: Fruit volume (cc), FW: Fruit weight (g), FS: Fruit set percentage (%), TP: Total phenols, TPr: Total protein (mg/g), TSS: Total soluble solids (°B), TA: Titrable acidity (%), AA: Ascorbic acid (mg/100 g) and YPP: Fruit yield per plant (g)
Again, from the path diagram, the days to flowering (DF: −0.89) seems to have an indirect negative effect on the number of flowers (NF), leading to a resulting positive path effect on FV (0.93) and FW (0.86), thus reducing the yield. It is also to be noted that fruit number (NFr) correlates highly with FV (0.981) and FW (0.98), indicating that fruit set is crucial for fruit yield. Biochemical traits correlating highly towards YPP are TP (0.91), TPr (0.99), TSS (0.99), and TA (0.93). These findings suggest that their improvement enhances both fruit quality and yield. Balancing vegetative and reproductive growth and optimizing fruit-related and biochemical traits is fundamental for enhancing strawberry productivity.
3.7. Effect of Fish Effluents on the Physical and Chemical Characteristics of Soil Post-Treatment
Soil physical-chemical properties under various treatments show significant variations in parameters affecting strawberry growth, such as pH, EC, and levels of nitrogen, phosphorus, and potassium. Among the treatments in Table 5, PFE (Pineapple peel fish feed effluent) has the most suitable soil characteristics for strawberry production, with phosphorus (3.45 mg/g), potassium (38.8 mg/g), almost neutral pH (7.12), and moderate EC (0.4 dS/m). These properties indicate that PFE offers a balanced supply of nutrients needed to develop roots, the flowering process, and fruit quality. Increased potassium levels improve fruit size and sweetness, whereas phosphorus improves root and shoot development, which is essential to the general vigor of the plant. An increase in levels of soil nutrients like potassium, nitrogen, and phosphorus was observed in sweet peppers during aquaculture wastewater application [11].
Table 5: Physico-chemical properties of soil post-treatment.
| Treatments | Physico-chemical properties of soil | ||||
|---|---|---|---|---|---|
| pH | EC (dS/m) | Nitrogen (%) | Phosphorus (mg/g) | Potassium (mg/g) | |
| Absolute water | 6.5 | 0.22 | 48.72 | 2.28 | 16.12 |
| Water+RDF | 6.8 | 0.22 | 47.04 | 3.06 | 36.4 |
| CFE (Commercial fish feed effluent) | 7.1 | 0.35 | 45.92 | 3.23 | 37.2 |
| PFE (Pineapple peel fish feed effluent) | 7.12 | 0.4 | 46.48 | 3.45 | 38.8 |
| BFE (Banana peel fish feed effluen) | 7.01 | 0.34 | 47.04 | 3.51 | 37.9 |
The increase in leaf count and plant spread in fish effluent treatments, especially those involving pineapple (PFE) and banana peel feed effluent (BFE), is driven by higher phosphorus (P) and potassium (K) levels in these treatments. PFE and BFE both had the highest phosphorous (3.45 mg/g and 3.51 mg/g, respectively) content and potassium (38.8 mg/g and 37.9 mg/g, respectively) levels that were corroborative to the improved leaf count at 30, 60, and 90 DAP in these treatments. The PFE application resulted in the earliest flowering at 65 days, followed by BFE at 66.33 days, compared with AW at 67 days. These two effluents, higher in phosphorus and potassium, are likely to have induced early floral initiation. Also, potassium enhances carbohydrate translocation to promote early flowering and fruit development. Moreover, based on improved nutrient availability, flower counts and fruit set percentages were much higher in PFE and BFE treatments. Higher EC (0.4 dS/m in PFE and 0.34 dS/m in BFE) indicates better nutrient availability in the soil, thereby assisting reproductive growth.
Fish fertilizer effluents greatly affected fruit count, weight, and volume, with PFE and BFE showing maximum fruit YPP of 255.69 g and 249.12 g, respectively. The strong yield can be attributed to the treatments having balanced amounts of N, P, and K that promoted fruit set and development. Moreover, TSS, ascorbic acid, and TA, important fruit quality characteristics, were recorded as the highest for the PFE and BFE treatments. This indicates that the potassium in these treatments encouraged the accumulation of sugars and better flavor in fruits. In the case of BFE, the ascorbic acid content was found to be 51.36 mg/100 g, and PFE was 50.80 mg/100 g, which is consistent with their high N and P availability that is important for the enzymatic reaction and antioxidant synthesis in fruits. The fertility of the soil was enhanced in onion by adding fish effluents in the study, where higher plant yield was observed [39].
As depicted in Tables 2 and 5, the physical and chemical properties of the soil before and after treatment exhibited remarkable variations. Soil samples examined before these treatments showed stable pH, which had incremented in all treatments except AW, the highest being in the case of Pineapple peel fish feed effluent (PFE). EC of the soil remained unchanged in AW and in WR but increased in feed effluent treatments, with the highest level in PFE. Slight reductions were observed regarding nitrogen in all treatments, lowest in Commercial fish feed effluent (CFE), thus contrasting largely with phosphorus, which recorded considerable increments in concentration post-treatment, with the highest being in the case of Banana peel fish feed effluen (BFE). Potassium contents were significantly elevated, accounting for geochemical indicators, in all treatment soils, except AW, where the effect was lower compared to PFE. Results of previous studies indicate that organic fish effluents are known to improve soil fertility by enhancing nutrient availability and microbial activities [40]. Studies have also found that organic amendments, such as fruit-based effluents, elevate phosphorus and potassium levels which increases plant growth and productivity [39]. All these results suggest that feed effluents considerably enhanced the soil, particularly in phosphorus and potassium, which may critically translate into plant growth and sustainability.
4. CONCLUSION
This study points out that using fish effluents from fruit peel as an organic substitute for chemical fertilizers benefits plant growth, quality, and productivity, like Camarosa strawberry. Among the treatments evaluated, fish effluent from pineapple peel was the most effective in enhancing growth parameters, both vegetative and reproductive, besides improving quality parameters of fruits such as phenols and proteins, TSS, ascorbic acid, and TA levels. In addition, treatment with fish effluent from pineapple has better soil, improving growth performance, yield, and quality of strawberries. The PCA analysis generates valuable insights that can be used in choosing sustainable treatments to optimize productivity and quality in Camarosa strawberries. The results show that fish effluents, especially pineapple peel feed effluent and banana peel feed effluent, greatly enhanced the growth, yield, and quality of Camarosa strawberries as a consequence of higher phosphorus and potassium content that promotes vegetative growth, early flowering, fruit set, and enhanced fruit biochemical composition.
Improvements in nutrient bioavailability and plant productivity showcase the environmental and economic profitability of using organic bio-effluents in strawberry cultivation systems. The effluent from feeding pineapple and banana peel feeds to fish is improving the growth and yield of strawberries; therefore, the hypothesis of this study is satisfied. This means that future studies can see the effects of the repeated application of fish effluents on soil health parameters, such as microbiological activity, organic matter content, and seasonal nutrient cycling. Future studies may also optimize different combinations of fruit peel effluents with bio-enhancers to improve effective nutrient uptake.
While the study highlights the beneficial prospects of Koi fish effluents from pineapple and banana peels enhancing the strawberry growth, yield, and quality specifications, several drawbacks must be considered. Since this study represents a single growing season, it dramatically restricts any deduction or conclusion on long-term effects on soil health and yield sustainability. Furthermore, since the study was done in certain climatic conditions, the similar results may not be found in different agro-environmental conditions, so further trials are required in other locations. In addition, the most varying factor for the inconsistency in results may occur as the nutrient composition depends on the fish feed type used, water quality, and microbial activity; this may, thus, result in unstandardized effluent preparation procedure. This study proposes a more sustainable fertilization method using koi fish effluents from fruit-peel-based feeds onto Camarosa strawberry growth and yield. By mixing aquaculture waste with horticulture, it tries to turn its organic wastes into valuable nutrients for environmentally friendly farming. Statistically validated to improve the well-being of plants and simultaneously minimize the dependency on synthetic fertilizers, this work has potential applications in sustainable agriculture, especially when integrated with aquaponic systems. Integrating multi-season trials, adaptation studies, and cost-benefit analysis into these significant possibilities will help tune the practical implementation of fish effluents into sustainable strawberry cultivation.
5. AUTHORS’ CONTRIBUTION
All authors made substantial contributions to conception and design, acquisition of data, or analysis and interpretation of data; took part in drafting the article or revising it critically for important intellectual content; agreed to submit to the current journal; gave final approval of the version to be published; and agree to be accountable for all aspects of the work. All the authors are eligible to be an author as per the International Committee of Medical Journal Editors (ICMJE) requirements/guidelines.
6. FUNDING
There is no funding to report.
7. CONFLICTS OF INTEREST
The authors report no financial or any other conflicts of interest in this work.
8. ETHICAL APPROVALS
Although fishes were used for this study, only their effluents were used for carrying out the research. This study does not involve experiments on animals or human subjects.
9. DATA AVAILABILITY
All the data is available with the authors and shall be provided upon request.
10. PUBLISHER’S NOTE
All claims expressed in this article are solely those of the authors and do not necessarily represent those of the publisher, the editors and the reviewers. This journal remains neutral with regard to jurisdictional claims in published institutional affiliation.
11. USE OF ARTIFICIAL INTELLIGENCE (AI)-ASSISTED TECHNOLOGY
The authors declares that they have not used artificial intelligence (AI)-tools for writing and editing of the manuscript, and no images were manipulated using AI.
12. ACKNOWLEDGMENT
The authors are thankful for the facilities provided by the School of Agriculture of Lovely Professional University, India to carry out the research work with ease.
REFERENCES
1. Caipang CM, Mabuhay-Omar J, Gonzales-Plasus MM. Plant and fruit waste products as phytogenic feed additives in aquaculture. Aquac Aquar Conserv Legis Bioflux 2019;12:261-8.
2. Dawood MA, Habotta OA, Elsabagh M, Azra MN, Van Doan H, Kari ZA, et al. Fruit processing by-products in the aquafeed industry:A feasible strategy for aquaculture sustainability. Rev Aquac 2022;14:1945-65.[CrossRef]
3. Andrian KN, Wihadmadyatami H, Wijayanti N, Karnati S, Haryanto A. A comprehensive review of current practices, challenges, and future perspectives in Koi fish (Cyprinus carpio var. ) cultivation. Vet World 2024;17:1846-54.[CrossRef]
4. Putri FP, Dewi NN. Growth monitoring of koi fish (Cyprinus carpio) in natural hatchery techniques in Umbulan, Pasuruan, East Java. IOP Conf Ser Earth Environ Sci 2019;236:012016.[CrossRef]
5. Chiquito-Contreras RG, Hernandez-Adame L, Alvarado-Castillo G, Martínez-Hernández MD, Sánchez-Viveros G, Chiquito-Contreras CJ, et al. Aquaculture-production system and waste management for agriculture fertilization-A review. Sustainability 2022;14:7257.[CrossRef]
6. Aydeniz-Güne?er B. Valorization of date palm (Phoenix dactylifera) wastes and by-products. In:Ramadan MF, Farag MA, editors. Mediterranean Fruits Bio-wastes. Cham:Springer;2022. 391-402.[CrossRef]
7. NHB. Horticulture Statistics at a Glance. NHB;2018. Available from:https://nhb.gov.in [Last accessed on 2024 Dec 20].
8. Li C, Wu H, Masisi K, Malunga LN, Song Y. Strawberries. In:Jaiswal AK, editor. Nutritional Composition and Antioxidant Properties of Fruits and Vegetables. Cambridge:Academic Press;2020. 423-35.[CrossRef]
9. De Corato U, Viola E, Keswani C, Minkina T. Impact of the sustainable agricultural practices for governing soil health from the perspective of a rising agri-based circular bioeconomy. Appl Soil Ecol 2024;194:105199.[CrossRef]
10. Kalengo L, Ge H, Liu N, Wang Z. The efficiency of aquatic macrophytes on the nitrogen and phosphorous uptake from pond effluents in different seasons. J Ecol Eng 2021;22:75-85.[CrossRef]
11. Akindele AJ, Olufayo AA, Faloye OT. Influence of borehole and fish wastewater on soil properties, productivity and nutrient composition of sweet pepper (Capsicum annum). Acta Ecol Sin 2022;42:56-62.[CrossRef]
12. Diatta AA, Manga AG, Bassène C, Mbow C, Battaglia M, Sambou M, et al. Sustainable production of tomato using fish effluents improved plant growth, yield components, and yield in Northern Senegal. Agronomy 2023;13:2696.[CrossRef]
13. Al-Wabel MI, Almutari MM, Ahmad M, Al-Swadi HA, Ahmad J, Al-Farraj AS. Impacts of aquaculture wastewater irrigation on soil health, nutrient availability, and date palm fruit quality. Sci Rep 2024;14:1?.[CrossRef]
14. Omotade IF, Alatise MO, Olanrewaju OO. Growth and yield performance of hot pepper using aquaculture wastewater. Agric Eng Int CIGR J Open Access 2019;21:18-25.[CrossRef]
15. Van Tung T, Tran QB, Phuong Thao NT, Vi LQ, Hieu TT, Le S, et al. Recycling of aquaculture wastewater and sediment for sustainable corn and water spinach production. Chemosphere 2021;268:129329.[CrossRef]
16. Cerozi BS, Arlotta CG, Richardson ML. Fish effluent as a source of water and nutrients for sustainable urban agriculture. Agriculture 2022;12:1975.[CrossRef]
17. Attalla RF, El-Serafy SS, Fadda SH. Investigation of pineapple remnants used in fish aqua feeds. Egypt J Aquat Biol Fish 2022;26:1-22.[CrossRef]
18. Sukri SA, Andu Y, Harith ZT, Sarijan S, Pauzi MN, Wei LS, et al. Effect of feeding pineapple waste on growth performance, texture quality and flesh colour of nile tilapia (Oreochromis niloticus) fingerlings. Saudi J Biol Sci 2022;29:2514-9.[CrossRef]
19. See MS, Musa N, Liew HJ, Harun NO, Rahmah S. Sweet orange peel waste as a feed additive in growth promoting and protective effect against Aeromonas hydrophila of juvenile bagrid catfish Mystus nemurus. J Environ Manage 2024;351:119677.[CrossRef]
20. Sundararajan A, Sahu NP, Shamna N, Jayant M, Sardar P, Vasanthakumaran, et al. Dietary papaya peel extract ameliorates the crowding stress, enhances growth and immunity in Labeo rohita fingerlings. Fish Physiol Biochem 2024;50:1047-64.[CrossRef]
21. Tejaswini K, Deo AD, Shamna N, Jayant M, Aklakur M, Annadurai R. Effect of flavanone rich lemon peel extract on feed intake and growth of Labeo rohita (Hamilton, 1822) fingerlings reared at low temperature recirculatory aquaculture system. Aquaculture 2024;584:740450.[CrossRef]
22. Hikal WM, Said-Al Ahl HA, Bratovcic A, Tkachenko KG, Sharifi-Rad J, Ka?ániováM, et al. Banana peels:A waste treasure for human being. Evid Based Complement Alternat Med 2022;2022:7616452.[CrossRef]
23. Rosadi NA, Catharina TS. Effect of fish water waste liquid organic fertilizer on strawberry flowering (Fragaria sp). J Penelit Pendidik IPA 2022;8:96-100.[CrossRef]
24. Molo?ag A, Pârvulescu OC, Ion VA, As?nic?AC, Soane R, Mo?A, et al. Effects of marine residue-derived fertilizers on strawberry growth, nutrient content, fruit yield and quality. Agronomy 2023;13:1221.[CrossRef]
25. Gill K, Kumar P, Negi S, Sharma R, Joshi AK, Suprun II, et al. Physiological perspective of plant growth regulators in flowering, fruit setting and ripening process in citrus. Sci Hortic 2023;309:111628.[CrossRef]
26. George J, Edwards D, Pun S, Williams D. Evaluation of antioxidant capacity (ABTS and CUPRAC) and total phenolic content (Folin-Ciocalteu) assays of selected fruit, vegetables, and spices. Int J Food Sci 2022;2022:2581470.[CrossRef]
27. Karimi F, Hamidian Y, Behrouzifar F, Mostafazadeh R, Ghorbani-HasanSaraei A, Alizadeh M, et al. An applicable method for extraction of whole seeds protein and its determination through Bradford's method. Food Chem Toxicol 2022;164:113053.[CrossRef]
28. Cecatto AP, Calvete EO, Nienow AA, Costa RC, Mendonça HF, Pazzinato AC. Culture systems in the production and quality of strawberry cultivars. Acta Sci Agron 2013;35:471-8.
29. Janurianti NM, Utama IM, Gunam IB. Colour and quality of strawberry fruit (Fragaria x ananassa Duch.) different levels of maturity. Sustain Environ Agri Sci 2021;5:22-8.[CrossRef]
30. Kumari S, Baloda S, Mor R, Akshay, Jakhar S, Jat ML, et al. Response of nutrient supplementation through INM on yield and quality parameters of pomegranate (Punica granatum). Indian J Agric Sci 2023;93:1091-6.[CrossRef]
31. Wei T, Simko V, Levy M, Xie Y, Jin Y, Zemla J. Package 'corrplot'. Statistician 2017;56:24.
32. Ullah S, Ahmad M, Khattak AM, Ilyas M, Khan A, Islam N, et al. Performance of strawberry in a closed loop aquaponics system. Pak J Weed Sci Res 2022;28:333-43.[CrossRef]
33. Alvares Da Silva A, Da Silva Dias N, Dantas Jales G, Costa Rebouças T, Dantas Fernandes P, Ferreira Neto M, et al. Fertigation with fish farming effluent at the adequate phenological stages improves physiological responses, production and quality of cherry tomato fruit. Int J Phytoremediation 2022;24:283-92.[CrossRef]
34. Fernández-Cabanás VM, Delgado A, Lobillo-Eguíbar JR, Pérez-Urrestarazu L. Early production of strawberry in aquaponic systems using commercial hydroponic bands. Aquac Eng 2022;97:102242.[CrossRef]
35. Pattillo DA, Foshee WG, Blythe EK, Pickens J, Wells D, Monday TA, et al. Performance of aquaculture effluent for tomato production in outdoor raised beds. HortTechnology 2020;30:624-31.[CrossRef]
36. Barth E, Resende JT, Moreira AF, Mariguele KH, Zeist AR, Silva MB, et al. Selection of experimental hybrids of strawberry using multivariate analysis. Agronomy 2020;10:598.[CrossRef]
37. Barth E, De Resende JT, Mariguele KH, De Resende MD, Da Silva AL, Ru S. Multivariate analysis methods improve the selection of strawberry genotypes with low cold requirement. Sci Rep 2022;12:11458.[CrossRef]
38. Coldebella A, Gentelini AL, Piana PA, Coldebella PF, Boscolo WR, Feiden A. Effluents from fish farming ponds:A view from the perspective of its main components. Sustainability 2017;10:3.[CrossRef]
39. Fruscella L, Kotzen B, Paradelo M, Milliken S. Investigating the effects of fish effluents as organic fertilisers on onion (Allium cepa) yield, soil nutrients, and soil microbiome. Sci Hortic 2023;321:112297.[CrossRef]
40. Musa JJ, Dada PO, Adewumi JK, Akpoebidimiyen OE, Musa ET, Otache MY, et al. Fish pond effluent effect on physicochemical properties of soils in Southern Guinea Savanna, Nigeria. Open Access Lib J 2020;7:1-5.[CrossRef]