
1. INTRODUCTION
Grapefruit (Citrus paradisi) is a tropical citrus fruit belonging to the Rutaceae family that has a sour to semisweet and somewhat bitter taste [1]. Grapefruit juice includes flavonoids, a wide family of plant polyphenolic secondary metabolites with pigment and antibacterial properties that may be found in a variety of plants and vegetables [2]. Grapefruit is considered one of the nutritionally important fruits and is consumed by a sizable population due to its rich source of ascorbic acid, folic acid, β-carotene, and minerals [3-5]. Grapefruit contains active chemical compounds such as flavonoids, carotenoids, limonoids, lycopene, organic acids, pectin, and other phytochemicals [6]. These phytonutrients have been shown to have health-promoting properties and are useful to human health [7,8].
The most abundant grapefruit juice flavonoids are naringin, narirutin, quercetin, and naringenin [3]. One of the main issues of the citrus industry worldwide is the bitterness of some citrus fruit drinks, and this had a direct economic effect [9]. Bitterness is mostly attributed to the presence of limonin, nomilin, limonin glucoside, quercetin, and naringin in grapefruit juices. The initial bitterness in citrus juices is caused by the naringin, while the delayed bitterness is caused by the limonin. Naringin has a bitter flavor, whereas limonin is tasteless and acquires bitterness during or after processing [10]. Naringin is the major component in grapefruit juice which imparts a bitter taste. Due to its bitter flavor, the consumption of preserved grapefruit juice has decreased dramatically [11]. Purewal and Sandhu [12] reported the naringin content in juice (30–75 mg/100 g), seeds (29–267 mg/100 g), pith (1328–1760 mg/100 g), albedo (130–1559 mg/100 g), and flavedo (270–431 mg/100 g) of grapefruit. Citrus fruit and their juices are commonly eaten around the world and have long been known to have health-promoting properties due to their ascorbic acid or vitamin C content [13]. Citrus fruits with more than 60 mg of vitamin C per 240 mL of juice meet the recommended daily requirement [14]. Dumbrav? et al. [15] observed that pink grapefruit juice is a rich source of ascorbic acid (81.612 mg/100 mL). Seleim et al. [16] reported that the ascorbic acid concentration of grapefruit juice from the white and pink varieties was 39.23 mg/100 mL and 38.82 mg/100 mL, respectively. The flavonols, carotenoids, polyphenols, anthocyanins, and vitamins are present abundantly in citrus fruit juices. Therefore, to avoid the loss of these functional components during storage and distribution, the fruit juices are subjected to some thermal and non-thermal processing and preservation interventions. Many researchers have studied the effect of processing methods on these functional components of various types of fruit juice, juices blends, and value-added products. [3,17,18]. The application of appropriate processing methods may preserve these components. The application of different juice processing methods may have a different impact on the functional component of grapefruit juice. Therefore, the present work was planned to study the effect of thermal (heat treatment) and non-thermal (sonication) processing methods on the naringin and ascorbic content of grapefruit juice.
2. MATERIALS AND METHODS
2.1. Grapefruit Juice Preparation
Grapefruits of the Star Ruby variety with equal degrees of maturity were procured from the Ch. Hira Singh Wholesale F&V Market, Azadpur, New Delhi. After washing, the grapefruits were peeled with the help of a knife and processed for juice extractor by a screw-type juice extraction machine (Kalsi, Bhajan Singh and Sons, Ludhiana, India). The obtained juice was collected in the glass beaker and filtered through a sieve for further thermal and non-thermal processing.
2.2. Thermal Processing of Grapefruit Juice
Grapefruit juice was subjected to heat treatment at three different levels of temperature and time [Table 1] in a water bath. Beakers of 250 mL filled with 200 mL of juice were placed in a preheated water bath at the required temperatures and time.
Table 1: Values of variables at three-level factorial experimental design for thermal and non-thermal processing of grapefruit juice.
| Processing method | Independent variables | Code | Levels of variables | ||
|---|---|---|---|---|---|
| −1 | 0 | 1 | |||
| Thermal processing | Temperature (°C) | A | 70 | 80 | 90 |
| Time (s) | B | 15 | 30 | 45 | |
| Non-thermal processing (sonication) | Frequency (kHz) | A | 20 | 30 | 40 |
| Time (min) | B | 30 | 60 | 90 | |
2.3. Non-thermal Processing of Grapefruit Juice
Sonication as a non-thermal processing was done in a portable sonication machine (Powersonic 410, Hwashin Tech Co. Ltd., Seoul, Korea) at different levels of frequency (20, 30, and 40 kHz) and time (30, 60, and 90 min). Beakers of 250 mL filled with 200 mL of juice were placed in a sonication machine at the required frequency and time. Fresh juice was used for each experiment.
2.4. Experimental Design and Statistical Analysis
Variations in naringin and ascorbic acid content of thermal and non-thermal processed grapefruit juice were observed as dependent variables with respect to desired variable combinations of independent variables. The values of independent variables at three levels of factorial experimental design are presented in Table 1. There were 13 experiments in experimental design as presented in coded levels [Table 2]. For both thermal and non-thermal processed juice, a two-factor interaction model was fitted to assess the applicability of process variables on naringin and ascorbic acid content. To facilitate the visual presentation of responses with respect to variables, plots were obtained using the Design-Expert trial version (State-Ease, Minneapolis, MN).
Table 2: Three-level factorial experimental design and response of thermal and non-thermal processed grapefruit juice.
| Experiment | Thermal processing | Non-thermal processing (sonication) | ||||||
|---|---|---|---|---|---|---|---|---|
| Coded variables | Responses | Coded variables | Responses | |||||
| (A) Temperature (°C) | (B) Time (s) | Naringin (ppm) | Ascorbic acid (mg/100mL) | Frequency (kHz) | (B) Time (s) | Naringin (ppm) | Ascorbic acid (mg/100mL) | |
| 1 | −1 | −1 | 612.20 | 38.20 | −1 | −1 | 690.30 | 39.15 |
| 2 | 0 | −1 | 594.65 | 36.92 | 0 | −1 | 693.22 | 40.35 |
| 3 | 1 | −1 | 586.12 | 35.20 | 1 | −1 | 696.80 | 41.05 |
| 4 | −1 | 0 | 588.62 | 36.45 | −1 | 0 | 702.52 | 40.28 |
| 5 | 0 | 0 | 579.85 | 35.16 | 0 | 0 | 708.12 | 42.15 |
| 6 | 1 | 0 | 570.40 | 34.04 | 1 | 0 | 714.60 | 43.38 |
| 7 | −1 | 1 | 572.33 | 34.40 | −1 | 1 | 720.42 | 42.08 |
| 8 | 0 | 1 | 568.92 | 33.52 | 0 | 1 | 727.15 | 44.66 |
| 9 | 1 | 1 | 561.50 | 32.75 | 1 | 1 | 737.50 | 46.26 |
| 10 | 0 | 0 | 577.50 | 35.15 | 0 | 0 | 709.35 | 42.96 |
| 11 | 0 | 0 | 575.50 | 35.36 | 0 | 0 | 705.12 | 42.78 |
| 12 | 0 | 0 | 578.27 | 34.95 | 0 | 0 | 710.10 | 42.15 |
| 13 | 0 | 0 | 579.60 | 34.70 | 0 | 0 | 706.80 | 42.12 |
2.5. Naringin and Ascorbic Acid Analysis
The naringin content of juice samples was estimated by the spectrophotometric method by Davis [19] with slight modifications. The absorbance was recorded at 420 nm against a blank in a UV spectrophotometer, and naringin content was calculated using a standard curve of naringin (10–200 μg). The ascorbic acid content was measured by titration against 2,6-dichloroindophenol dye till the emergence of the light pink color [20]. The ascorbic acid content was calculated as mg/100 mL of grapefruit juice.
3. RESULTS AND DISCUSSION
3.1. Effect of Thermal Processing on Naringin Content of Grapefruit Juice
The naringin content of thermally processed juice varied from 561.50 to 612.20 ppm with an average value of 580.42 ppm [Table 2]. The higher naringin content in grapefruit juice was found at the combination of temperature and time at 70°C and 15 s. Whereas the lower naringin content in grapefruit juice was observed at the combination of temperature and time at 90°C and 45 s. The value of the predicted R2 (0.8259) is in acceptable agreement with the adjusted R2 of 0.9433 [Table 3]. The visual presentation for naringin content is given in the 3D surface plot [Figure 1] by comparing the effects of temperature and time by setting the reference point at the center point coded as 0 for both temperature and time in the design space. In a study on the effect of ultrasound processing of kiwifruit juice, Wang et al. [18] revealed that the flavonoids, total phenolics, and antioxidant capacity of ultrasound-processed juice samples significantly increased by 105.56%, 108.65%, and 65.67%, respectively, compared to the control group. In a similar study, Igual et al. [3] reported a significant reduction in naringin content in pasteurized grapefruit juice.
Table 3: ANOVA of regression model for responses of thermal and non-thermal processed grapefruit juice.
| Source | Thermal processed | Non-thermal processed (sonication) | ||
|---|---|---|---|---|
| Naringin | Ascorbic acid | Naringin | Ascorbic acid | |
| Model | 745.00 | 53.17 | 674.47 | 38.11 |
| A | −1.681* | −0.19* | 0.65* | 0.39* |
| B | −3.036* | −0.29* | 0.58* | 0.069* |
| AB | 0.025* | 0.0023* | 0.088* | 0.019* |
| R-squared | 0.957 | 0.986 | 0.979 | 0.967 |
| Adj R-Squared | 0.943 | 0.982 | 0.972 | 0.957 |
| Adeq. precision | 28.37 | 51.58 | 38.00 | 33.23 |
| P-values of model | 0.0001 | 0.0001 | 0.0001 | 0.0001 |
| Lack of fit P-value | 0.080ns | 0.894ns | 0.375ns | 0.566ns |
Level of significance:
* P<0.05, NS=Not significant
 | Figure 1: 3D surface plot for the effect of temperature (a) and time (b) on the naringin content of thermal-processed grapefruit juice. [Click here to view] |
3.2. Effect of Thermal Processing on Ascorbic Acid Content of Grapefruit Juice
The ascorbic acid content of thermally processed grapefruit juice varied from 32.75 to 38.20 mg/100 mL with an average value of 35.14 mg/100 mL [Table 2]. The higher ascorbic acid content of grapefruit juice was found at the combination of temperature and time at 70°C and 15 s. Whereas the lower ascorbic acid content of grapefruit juice was found at the combination of temperature and time at 90°C and 45 s. The value of the predicted R2 (0.979) is in acceptable agreement with the adjusted R2 of 0.982 [Table 3]. The visual presentation for ascorbic acid content is given in the 3D surface plot [Figure 2] by comparing the effects of temperature and time by setting the reference point at the center point coded as 0 for both temperature and time in the design space. Wurlitzer et al. [21] stated that the pasteurization process caused a significant depletion of the ascorbic acid content in the tropical juice blend. Igual et al. [17] supported the use of microwave treatment as an alternative to conventional pasteurization. They showed that thermal treatment at 95°C significantly decreased the ascorbic acid content in grapefruit juice, while microwave treatment preserved the ascorbic acid content. In a similar study on pear juice pasteurization, Saeeduddin et al. [22] reported that pasteurization at 95°C resulted in higher degradation of total phenols, ascorbic acid, and flavonoids than the ultrasound-pasteurized pear juice.
 | Figure 2: 3D surface plot of the effect of temperature (a) and time (b) on the ascorbic acid content of thermal-processed grapefruit juice. [Click here to view] |
3.3. Effect of Sonication on Naringin Content of Grapefruit Juice
The naringin of sonication (non-thermal) processed juice varied from 690.30 to 737.50 ppm with an average value of 709.38 ppm [Table 2]. The maximum naringin content of grapefruit juice was found at the combination of frequency and time at 40 kHz and 90 min. Whereas the minimum naringin content of grapefruit juice was found at the combination of frequency and time at 20 kHz and 30 min. The value of predicted R2 (0.9240) is in acceptable agreement with the adjusted R2 squared of 0.9720 [Table 3]. The visual presentation for naringin content is given in the 3D surface plot [Figure 3] by comparing the effects of frequency and time by setting the reference point at the center point coded as 0 for both frequency and time in the design space. Nadeem et al. [23] stated the higher total phenolics and flavonoids in the ultrasound-treated carrot-grape juice blend than in the control carrot-grape juice blend. Results indicated that the increase in sonication time caused the increase in bioactive compounds of the carrot-grape juice blend. In a study, Ioannou et al. [24] reported the highest naringin content in the ultrasound-assisted extraction method. When an ultrasonic wave is generated, it propagates in the solvent and generates ultrasonic pressure waves. This creates a phenomenon known as acoustic cavitation, which produces bubbles. These break on contact with the cells, and they rupture the cell walls, allowing naringin to be released.
 | Figure 3: 3D surface plot for the effect of frequency (a) and time (b) on the naringin content of non-thermal-processed grapefruit juice. [Click here to view] |
3.4. Effect of Sonication Processing on Ascorbic Acid Content of Grapefruit Juice
The ascorbic acid content of sonication (non-thermal)-processed grapefruit juice varied from 39.15 to 46.26 mg/100 mL with an average value of 42.26 mg/100 mL [Table 2]. The higher ascorbic acid content in grapefruit juice was found at the combination of frequency and time at 40 kHz and 90 min. Whereas the lower ascorbic acid content in grapefruit juice was found at the combination of frequency and time at 20 kHz and 30 min. The value of the predicted R2 (0.9432) is in fair agreement with the adjusted R2 of 0.9569 [Table 3]. The visual presentation for ascorbic acid content is given in the 3D surface plot [Figure 4] by comparing the effects of frequency and time by setting the reference point at the center point coded as 0 for both frequency and time in the design space. Nguyen and Nguyen [25] reported a significantly higher (P < 0.05) ascorbic acid content in the sonicated mulberry juice compared to the non-ultrasonic one. Nadeem et al. [26] observed the increased antioxidant activity of citrus juice samples after sonication. In a study on apple juice, Abid et al. [27] reported an increased ascorbic acid content in apple juice after sonication at 20°C. During the orange juice storage at 20°C, Knorr et al. [28] reported less ascorbic acid degradation in ultrasound-processed orange juice than in heat-treated orange juice. Further, the effective removal of oxygen in ultrasound treatment favored the comparatively less degradation of ascorbic acid in the orange juice. A similar study on ascorbic acid was also reported by Wang et al. [18] on mango juice and kiwi fruit juice sonication. Basumatary et al. [29] reported lower ascorbic acid levels in pomelo juice pasteurized at 90°C for 60 s in comparison to thermosonicated pomelo juice samples. Besides the thermal processing, further studies will be required on the non-thermal processing of grapefruit juice that can improve the nutritional and economic importance of grapefruit juice.
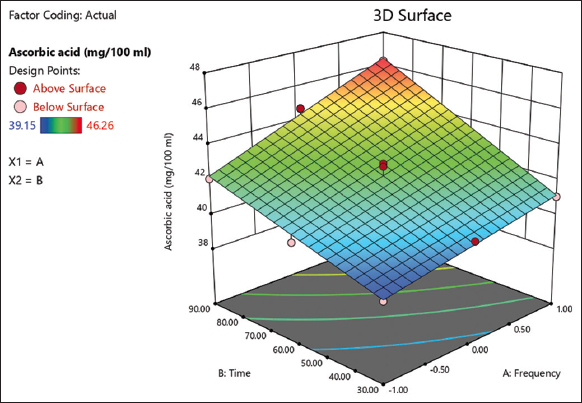 | Figure 4: 3D surface plot for the effect of frequency (a) and time (b) on the ascorbic content of non-thermal-processed grapefruit juice. [Click here to view] |
4. CONCLUSION
Thermal processing resulted in the partial reduction of naringin and ascorbic acid content of grapefruit juice. The linear and interaction effect was significant for the responses of naringin and ascorbic acid content. Whereas the sonication processing methods resulted in an increased level of naringin and ascorbic acid content. There was a significant effect of frequency and time on both the responses of naringin and ascorbic acid content. These observations on thermal and non-thermal processing of grapefruit juice may be useful in the selection of appropriate processing methods for citrus juice processing. Although further research would be necessary to study the processing methods for the citrus juice processing sector.
5. ACKNOWLEDGMENT
The authors would like to thank the Guru Jambheshwar University Science and Technology, Hisar, India, for providing the basic facilities and infrastructure required for the execution of this research work.
6. AUTHORS’ CONTRIBUTIONS
All authors made substantial contributions to the conception, design of the work, analysis, interpretation of data, and writing of the manuscript.
7. FUNDING
There was no funding for this research work.
8. CONFLICTS OF INTEREST
The authors declare that they have no conflicts of interest
9. ETHICAL APPROVALS
This research does not contain any studies with human participants or animals.
10. DATA AVAILABILITY
All the data related to the present research have been included in the manuscript
11. PUBLISHER’S NOTE
This journal remains neutral with regard to jurisdictional claims in published institutional affiliation.
REFERENCES
1. Lv X, Zhao S, Ning Z, Zeng H, Shu Y, Tao O, et al. Citrus fruits as a treasure trove of active natural metabolites that potentially provide benefits for human health. Chem Cent J 2015;9:68.
2. Martínez MJ, del Olmo LM, Benito PB. Interactions between natural health products and antiretroviral drugs. Stud Nat Prod Chem 2014;43:197-221.
3. Igual M, García-Martínez E, Camacho MM, Martínez-Navarrete N. Changes in flavonoid content of grapefruit juice caused by thermal treatment and storage. Innov Food Sci Emerg Technol 2011;12:153-62.
4. Liu RH. Health-promoting components of fruits and vegetables in the diet. Adv Nutr 2013;4:384S-92S
5. Rafiq S, Kaul R, Sofi SA, Bashir N, Nazir F, Nayik GA. Citrus peel as a source of functional ingredient:A review. J Saudi Soc Agric Sci 2018;17:351-8.
6. Turner T, Burri BJ. Potential nutritional benefits of current Citrus consumption. Agriculture 2013;3:170-87.
7. Hung WL, Suh JH, Wang Y. Chemistry and health effects of furanocoumarins in grapefruit. J Food Drug Anal 2017;25:71-83.
8. Mahmoud AM, Bautista RJ, Sandhu MA, Hussein OE. Beneficial effects of Citrus flavonoids on cardiovascular and metabolic health. Oxid Med Cell Longev 2019;2019:5484138.
9. Maier VP, Beverly GD. Limonin monolactone, the nonbitter precursor responsible for delayed bitterness in certain Citrus juices. J Food Sci 1968;33:488-92.
10. Frydman A, Weisshaus O, Bar-Peled M, Huhman DV, Sumner LW, Marin FR, et al. Citrus fruit bitter flavors:Isolation and functional characterization of the gene Cm1, 2RhaT encoding a 1, 2 rhamnosyltransferase, a key enzyme in the biosynthesis of the bitter flavonoids of Citrus. Plant J 2004;40:88-100.
11. Kiani J, Imam SZ. Medicinal importance of grapefruit juice and its interaction with various drugs. Nutr J 2007;6:33.
12. Purewal SS, Sandhu KS. Debittering of Citrus juice by different processing methods:A novel approach for food industry and agro-industrial sector. Sci Hortic 2021;276:109750.
13. Matheyambath AC, Padmanabhan P, Paliyath G. Citrus fruits. In:Caballero B, Finglas PM, ToldráF, editors. Encyclopedia of Food and Health. Oxford:Academic Press;2016. 136-40.
14. MartíN, Mena P, Cánovas JA, Micol V, Saura D. Vitamin C and the role of Citrus juices as functional food. Nat Product Commun 2009;4:677-700.
15. Dumbrav?DG, H?d?rug?NG, Moldovan C, Raba DN, Popa MV, R?doi B. Antioxidant activity of some fresh vegetables and fruits juices. J Agroaliment Process Technol 2011;17:163-8.
16. Seleim MA, Hassan MA, Saleh AS, Nadia HA. Physico-chemical evaluation of white and pink grapefruit (Citrus paradisi) juice. Assiut J Agric Sci 2019;50:112-22.
17. Igual M, García-Martínez E, Camacho MM, Martínez-Navarrete N. Effect of thermal treatment and storage on the stability of organic acids and the functional value of grapefruit juice. Food Chem 2010;118:291-9.
18. Wang J, Vanga SK, Raghavan V. High-intensity ultrasound processing of kiwifruit juice:Effects on the ascorbic acid, total phenolics, flavonoids and antioxidant capacity. LWT Food Sci Technol 2019;107:299-307.
19. Davis WB. Determination of flavanones in Citrus fruits. Anal Chem 1947;19:476-8.
20. Association of Official Analytical Chemists (AOAC). Van Nostrand's Encyclopedia of Chemistry. Rockville, Maryland:Association of Official Analytical Chemists;2005.
21. Wurlitzer NJ, Dionísio AP, Lima JR, Garruti DD, da Silva Araújo IM, da Rocha RF, et al. Tropical fruit juice:Effect of thermal treatment and storage time on sensory and functional properties. J Food Sci Technol 2019;56:5184-93.
22. Saeeduddin M, Abid M, Jabbar S, Wu T, Hashim MM, Awad FN, et al. Quality assessment of pear juice under ultrasound and commercial pasteurization processing conditions. LWT Food Sci Technol 2015;64:452-8.
23. Nadeem M, Ubaid N, Qureshi TM, Munir M, Mehmood A. Effect of ultrasound and chemical treatment on total phenol, flavonoids and antioxidant properties on carrot-grape juice blend during storage. Ultrason Sonochem 2018;45:1-6.
24. Ioannou I, M'hiri N, Chaaban H, Boudhrioua NM, Ghoul M. Effect of the process, temperature, light and oxygen on naringin extraction and the evolution of its antioxidant activity. Int J Food Sci Technol 2018;53:2754-60.
25. Nguyen CL, Nguyen, HV. Ultrasonic effects on the quality of mulberry juice. Beverages 2018;4:56.
26. Nadeem M, Ranjha MM, Ameer K, Ainee A, Yasmin Z, Javaria S, et al. Effect of sonication on the functional properties of different Citrus fruit juices. Int J Fruit Sci 2022;22:568-80.
27. Abid M, Jabbar S, Hu B, Hashim MM, Wu T, Lei S, et al. Thermosonication as a potential quality enhancement technique of apple juice. Ultrason Sonochem 2014;21:984-90.
28. Knorr D, Zenker M, Heinz V, Lee DU. Applications and potential of ultrasonics in food processing. Trends Food Sci Technol 2004;15:261-6.
29. Basumatary B, Nayak PK, Chandrasekar CM, Nath A, Nayak M, Kesavan RK. Impact of thermo sonication and pasteurization on the physicochemical, microbiological and anti-oxidant properties of pomelo (Citrus maxima) juice. Int J Fruit Sci 2020;20 sup 3:S2056-73.