
1. INTRODUCTION
Bee venom therapy (BVT) uses bee venom to treat various diseases and ailments and is widely used in complementary medicine, especially in many Asian countries. Honeybee venom contains proteins, enzymes, peptides, and other biologically active substances, including a variety of low molecular components, such as carbohydrates (2% of venom dry weight), phospholipids (5% of venom dry weight), minerals (3–4% of venom dry weight), and volatile components (5–8% of venom dry weight). It comprises only a few enzymatically active components, such as phospholipase A, hyaluronidase, histamine, melittin and apamin, and a mast cell degranulating peptide [1-3].
The diverse therapeutic applications of BVT include various musculoskeletal conditions, such as arthritis and rheumatism, chronic recalcitrant neuralgia, arthralgia, immune-related diseases, and lung disease like asthma [4-7]. A recent report has reported the potential use of bee venom as a complementary therapy for COVID infection [8]. Although the therapeutic utility of bee venom has been demonstrated, its safety profile is an important limiting consideration, because immune responses to BVT can range from trivial skin reactions that resolve over several days to life-threatening responses such as anaphylaxis.
Melittin is the principal component of the bee venom besides other chemicals such as phospholipase A2, histamine, hyaluronidase, catecholamine, and serotonin. Melittin is a small peptide containing 26 amino acids, and it is a water-soluble tetramer but spontaneously integrates into the lipid bilayer. Melittin has no disulfide bridge with predominantly hydrophobic N-terminal and strongly basic and hydrophilic C-terminal end. Melittin has multiple effects, including cytolysis, hemolysis, anti-cancer, anti-microbial, anti-inflammatory, and anti-oxidant properties [9]. The gene for the melittin precursor in Apis cerana comprises two exons and one intron between the exons and encodes a 70 amino acid residue pre-promelittin containing signaling peptides and a mature melittin peptide.
On the other hand, the production of recombinant therapeutic proteins in cell lines like CHO and HEK confers several therapeutic advantages like post-translational modifications and glycoprotein glycosylation to produce more human-like proteins. Over the past 20 years, significant efforts have been made to improve recombinant protein production, mostly by optimizing cell lines through vector optimization and medium optimization. Several cis-acting elements have been used in vector engineering to achieve stable cell lines with high expression, including stabilizing and anti-repressor elements, matrix attachment regions, ubiquitous chromatin opening elements, and introns [10,11]. Introns are non-coding DNA sequences that influence gene expression in many ways, except boosting the genome’s coding capacity through alternative splicing. Even though introns like SV40 intron, Intron-A, chimeric intron, hBG introns, and EF-1a intron have been shown to boost transgene expression in various mammalian cell lines; many studies have also reported mixed results on the impact of the intron on transgenic expression [12-19].
Similarly, very few studies are available regarding transgene expression and positioning of intron downstream in the expression cassette [20]. Likewise, there are no reports of the intron from insects on transgene expression in mammalian cell lines. In our present study, we isolated the genomic DNA from Apis cerana indica sequenced melittin gene, evaluated the amino acid information by the in silico approach and investigated the influence of melittin intron on transgene expression in HEK-293 and CHO-K1 cell lines.
2. MATERIALS AND METHODS
2.1. Genomic DNA Isolation, Polymerase Chain Reaction (PCR) Amplification, and Sequencing
Genomic DNA from honeybee was extracted by CTAB extraction method. Briefly, 500 ul of lysis buffer (2% w/v CTAB, 100 mM Tris (pH 8), 20mM EDTA, 1.4 M NaCl), and 20 ul of 20 mg/ml proteinase-K were added to the homogenized sample and incubated at 65°C for 1 h. The sample was centrifuged at 13,000 rpm for 1 min and the supernatant was transferred to a fresh 1.5 ml tube. The DNA was purified using phenol: chloroform: isoamyl alcohol (25:24:1), precipitated using isoamyl alcohol, washed with 70% ethanol, air dried, and dissolved in 50 ul nuclease free water. Melittin gene was amplified using forward- 5’GAATTAACAGCATTAACACA-3’ and reverse- 5’-GATTTGATGAATGAAAAATTTAT-3’ primers using Apis cerana cerana melt gene as reference (AJ786346.1) and the PCR amplicon was purified and sequenced.
2.2. Antigenicity Prediction
The antigenicity of melittin was performed using Kolaskar and Tongaonkar antigenicity prediction method. This program predicts those segments from within a melittin protein from A. cerana indica sequence which is likely to be antigenic by eliciting an antibody response and the potent antigenic regions were highlighted with its residues [21].
2.3. Protein Secondary Structure Prediction
The secondary structure of melittin was predicted by GOR Secondary Structure Prediction method on Job GOR4 (ID: 940d2603e1f1) running on NPS@ server. The GOR method analyses sequences to predict alpha helices, beta sheets, turn, or random coil secondary structure at each position based on 17 amino acid sequence windows [22].
2.4. Physicochemical Composition Analysis
ProtParam analysis tool available on Expasy server was used to analyze the physicochemical properties such as molecular weight, instability index, amino acid composition, theoretical pI, and Grand average of hydrophobicity of melittin [23].
2.5. Location in Solvent Accessible Region
ProtScale analysis tool in Expasy server was used to compute the hydrophobic and hydrophilic characteristics of amino acids for any given protein and represent the profile as an amino acid scale. Kyte and Doolittle [24], Hopp and Woods [25], Manavalan and Ponnuswamy [26], Eisenberg et al. [27], Fauchere [28], Janin [29], and Rao and Argos [30] amino acid scale scales were generated for the amino acids in the melittin protein. Determining the position in the protein’s solvent-accessible sections is essential predicting membrane-spanning domains, possible antigenic sites, and areas that are probably exposed on the protein surface.
2.6. Plasmid Construction for Transient Expression
The DNA fragment of the melittin intron was PCR amplified with the melittin PCR amplicon as the template using 2 primer sets; forward-1 (5’-ATATGCTAGCCTGAACCAGAACCG-3’) with Nhe-1, reverse-1 (5’-ATATCTTAAGAATCCTGTGGTTAATACTTT-3’) with Afl-2, forward-2 (5’-TATATGAATTCCTGAACCAGAACCGG-3’) with EcoR-1, and reverse-2 (5’-ATATTCTAGAAATCCTGTGGTTAATACTT-3’) Xba-1 restriction site. Construction of vector for evaluating the transgene expression is based on pVAX-1 plasmid. pVAX-1 is a non-viral 3 KB plasmid with Human cytomegalovirus immediate-early (CMV) promoter, Bovine growth hormone (BGH) polyadenylation (Poly-A) signal sequence, and Kanamycin resistance gene for selection. DNA sequence for coding EGFP was inserted between Hind-III and BamH-1 site to generate pVAX-1/E and used as a control vector. The plasmid pVAX-1/MEL-CIE was constructed by inserting Mel-intron upstream to the expression cassette between CMV promotor and the EGFP using the first set of primers. Similarly, pVAX-1/MEL-CEI was constructed by inserting Mel-intron downstream to the expression cassette between EGFP and BGH-Poly-A tail using the second set of primers. A schematic representation of Melittin-intron cloned in the pVAX-1/EGFP plasmid is shown in Figure 1.
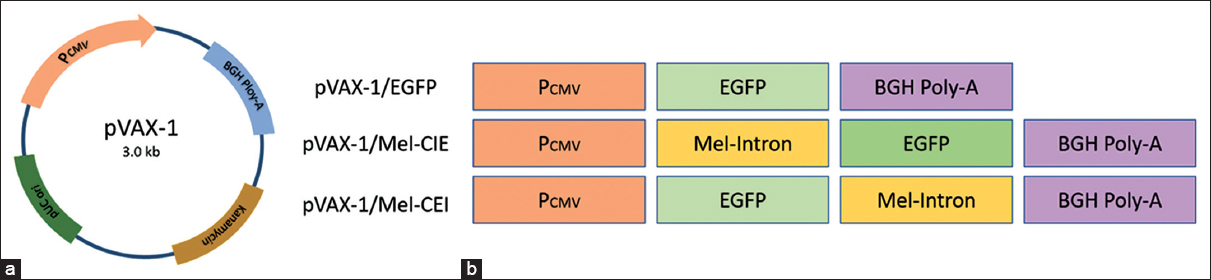 | Figure 1: Construction of pVAX-1/Mel-CIE and pVAX-1/Mel-CEI plasmid. (a) Vector map of pVAX-1 plasmid. (b) A schematic representation of intron-less and intron cloned plasmid. pVAX-1/EGFP was constructed by inserting EGFP sequence between Hind-III and BamH-1 site, pVAX-1/Mel-CIE was constructed by cloning melittin-intron between CMV promotor and the EGFP, and pVAX-1/Mel-CEI was constructed cloning melittin-intron EGFP and BGH-Poly-A tail. [Click here to view] |
2.7. Cell Culture and Transfection
HEK-293 and CHO-K1 were purchased from NCCS Pune. HEK-293 and CHO-K1 cells were grown in DMEM and RPMI media supplemented with 10% FBS and 1X Pen-Step antibiotics in a humidified incubator with 5% CO2 at 37°C, respectively. Transient transfection of all the plasmids was performed in 6-well plates using Lipofectamine 2000 (ThermoFisher Scientific) according to the manufacturer’s instruction. 1-day before transfection, 2 ml of exponentially growing cells with cell density 0.3 × 10⁶ cells/ml was seeded in the complete media. At the day of transfection, the complete media was removed and cells were washed with ×1 PBS. Both cell lines were transfected with 2 mg of plasmids in incomplete media for 5 h. After incubation, incomplete media was replaced with complete media and incubated to 24 h. All the transfection experiments were performed in triplicates.
2.8. Fluorescent Microscopy and Real-Time PCR (RT-PCR)
EGFP expression in HEK-293 and CHO-K1 cells was qualitatively determined by visualizing the EGFP expression using Inverted Fluorescent Microscope (Olympus CKX53) and quantitatively measured using RTq-PCR. Total RNA was isolated using TRIZOL, quantified, and converted to cDNA using cDNA conversion kit (PrimeScript™ RT Master Mix, Takara). RTq-PCR was performed using real time Sybrgreen PCR mastermix without ROX (TB Green® Premix Ex Taq™ II (Tli RNase H Plus), Takara) in a RT-PCR (Insta Q48 m, Himedia) according to manufacturer’s instruction and the fold change was calculated by 2-DDCt method. EGFP expression was relatively quantified at the mRNA level using forward: 5’-AAGCTGACCCTGAAGTTCATCTGC-3’ and reverse: 5’- CTTGTAGTTGCCGTCGTCCTTGAA-3’ primers. GAPDH (Glyceraldehyde phosphate dehydrogenase) gene was used as internal control and primers used for HEK-293 cell line were forward: 5’-GTCTCCTCTGACTTCAACAGCG-3’, Hu-GAPDH-reverse: 5’- ACCACCCTGTTGCTGTAGCCAA-3’, and CHO-K1 cell line were forward: 5’- GAAAGCTGTGGCGTGATGG-3’, and reverse: 5’- CATACTTGGCAGGTTTCTCCAG-3’.
2.9. Statistical Analysis
One-way ANOVA analysis with 95%CI was carried out for statistical comparison between the EGFP expression among the intron and intron-less groups, and P < 0.05 was considered to be statistically significant. Statistical analysis was performed using GraphPaD Prism V 9.0.
3. RESULTS AND DISCUSSION
3.1. Antigenicity
The partial melittin gene sequence was submitted to the GenBank and received the accession number (MZ356198). The 26 amino acid sequence “GIGAVLKVLTTGLPALISWIKRKRQQ” of matured melittin was considered for all of the in-silico analysis. The antigenic peptide of melittin was predicted using Kolaskar and Tongaonkar antigenicity prediction method. The potential antigenic region had eight residues “AVLKVLTT” showing highest peak starting from position 4–11 and the predicted residues scores of melittin are tabulated in Table 1 with an average antigenic propensity of 1.067. The antigenic plot is shown in Figure 2, where x-axis shows sequence number and y-axis shows average antigenic propensity.
Table 1: Kolaskar and Tongaonkar antigenicity predicted residue score.
| Position | Residue | Start | End | Peptide | Score |
|---|---|---|---|---|---|
| 4 | A | 1 | 7 | GIGAVLK | 1.075 |
| 5 | V | 2 | 8 | IGAVLKV | 1.148 |
| 6 | L | 3 | 9 | GAVLKVL | 1.162 |
| 7 | K | 4 | 10 | AVLKVLT | 1.167 |
| 8 | V | 5 | 11 | VLKVLTT | 1.145 |
| 9 | L | 6 | 12 | LKVLTTG | 1.072 |
| 10 | T | 7 | 13 | KVLTTGL | 1.072 |
| 11 | T | 8 | 14 | VLTTGLP | 1.091 |
| 12 | G | 9 | 15 | LTTGLPA | 1.046 |
| 13 | L | 10 | 16 | TTGLPAL | 1.046 |
| 14 | P | 11 | 17 | TGLPALI | 1.08 |
| 15 | A | 12 | 18 | GLPALIS | 1.095 |
| 16 | L | 13 | 19 | LPALISW | 1.098 |
| 17 | I | 14 | 20 | PALISWI | 1.084 |
| 18 | S | 15 | 21 | ALISWIK | 1.065 |
| 19 | W | 16 | 22 | LISWIKR | 1.037 |
| 20 | I | 17 | 23 | ISWIKRK | 0.992 |
| 21 | K | 18 | 24 | SWIKRKR | 0.952 |
| 22 | R | 19 | 25 | WIKRKRQ | 0.952 |
| 23 | K | 20 | 26 | IKRKRQQ | 0.97 |
 | Figure 2: Kolaskar and Tongaonkar antigenicity plot of Melittin. The potential antigenic region starts from position 4 to 11 with 8 residues and antigenic propensity was calculated to be 1.067. [Click here to view] |
3.2. Protein Secondary Structure
The GOR method generates the code that links the amino acid sequence to the secondary structure of proteins using information theory. To determine the likelihood of each amino acid being present at each position, three scoring matrices are created to retrieve results a data mining approach called cluster analysis is applied. The predicted secondary structure of melittin showed 26.92% of alpha helix, 30.77% of extended strand, 42.31% of random coil, and no beta turn [Table 2]. The result from Kolaskar and Tongaonkar antigenicity prediction method further implies that the eight amino acid residues in the beta sheet is more antigenic when compared to the helical region of the melittin peptide.
Table 2: Secondary structures of Melittin.
| Secondary structure | No. of residues | Percentage |
|---|---|---|
| Alpha helix | 7 | 26.92 |
| 310 helix | 0 | 0 |
| Pi helix | 0 | 0 |
| Beta bridge | 0 | 0 |
| Extended strand | 8 | 30.77 |
| Beta turn | 0 | 0 |
| Bend region | 0 | 0 |
| Random coil | 11 | 42.31 |
| Ambiguous state | 0 | 0 |
| Other states | 0 | 0 |
3.3. Physicochemical Composition
Utilizing the ProtParam analysis tool on the Expasy server, the physicochemical makeup of melittin was examined and the properties are tabulated in Table 3. The instability index II for the melittin was computed to be 44.73 and the protein was classified as unstable. With respect to the theoretical pI, and the number of charged amino acid residues, the melittin was found to be basic and cationic in nature. Even though the native protein is unstable, the antigenic peptide region could play an essential role in designing peptide and subunit therapeutics.
Table 3: Physicochemical parameters of Melittin.
| Parameters | Values |
|---|---|
| Number of amino acids | 26 |
| Molecular weight | 2847.49 |
| Theoretical pI | 12.02 |
| Instability index | 44.73 |
| Grand average of hydropathicity | 0.273 |
| Number of positively charged amino acids | 5 |
| Number of negatively charged amino acids | 0 |
3.4. Solvent Accessible Region
The solvent accessible region scales are widely used scales for delineating hydrophobic and hydrophilic character of a protein. Because the N- and C-terminal region of a protein are often unstructured, solvent accessible, and the antibodies against these areas are more likely to recognize the native protein, predicting solvent accessibility is crucial to identifying the antigenic location of a specific protein. Since melittin is highly antigenic in nature, we considered Kyte and Doolittle, Hopp and Woods, Manavalan and Ponnuswamy, Eisenberg et al., Fauchere and Pliska, Janin, and Rao and Argos amino acid scale scales. The hydrophobic and hydrophilic indexes showed that the N- terminal region of the melittin protein is hydrophobic and the C-terminal region is hydrophilic in nature and the predicted antigenic peptide was in the N- terminal region [Figure 3].
 | Figure 3: Hydrophobicity scale for Melittin protein. (a) Kyte-Doolittle hydrophobicity scale for Melittin protein, (b) Hopp-Woods hydrophobicity scale for Melittin protein, (c) Manavalan hydrophobicity scale for Melittin protein, (d) Eisenberg hydrophobicity scale for Melittin protein, (e) Fauchere hydrophobicity scale for Melittin protein, (f) Janin hydrophobicity scale for Melittin protein, and (g) Rao and Argos hydrophobicity scale for Melittin protein. [Click here to view] |
3.5. Influence of Melittin Intron in EGFP Expression
To enhance or improve gene expression in mammalian cells, several expression systems use components of the expression module, such as promoters, upstream enhancers and terminator, and Poly-A signals [31]. Non-coding enhancer DNA sequences including introns can enhance exogenous gene expression by positively influencing at the transcriptional and translational level. This phenomenon is known as intron-mediated enhancement (IME) and it is greatly influenced by physiological conditions of the cell, and cell type [32-34]. To test the influence of Melittin-Intron in transgene expression in mammalian cell lines based on the presence and special arrangements of the intron in the expression cassette, we constructed two sets of plasmids containing the intron in two sites, one: between the CMV promoter and EGFP sequence: upstream in the expression cassette (pVAX-1/Mel-CIE), and another between EGFP sequence and BHG Poly A-tail (pVAX-1/Mel-CEI): downstream in the expression cassette. Plasmid containing only EGFP sequence was considered as intron-less control (pVAX-1/EGFP). Results showed that CHO-K1 cells transfected with pVAX-1/Mel-CIE and pVAX-1/Mel-CEI showed no significant changes in the EGFP expression when compared to CHO-K1 transfected with the intron-less control plasmid. Similarly, HEK-293 cells transfected pVAX-1/Mel-CIE showed no significant changes in the EGFP expression when compared to the cells transfected with intron-less control plasmid. However, significant reduction in EGFP expression was observed in HEK-293 cells transfected with pVAX-1/Mel-CEI when compared to the HEK-293 cells transfected with the intron-less plasmid and pVAX-1/Mel-CIE. IME is a network of several known and unknown mechanism that affects gene expression in all levels of gene expression in different cell types and tissue types differently.
Various studies have shown that the introns positioned between the promoter and the gene of interest might increase gene expression, whereas introns that are in the 3’ UTR may have the opposite effect and even lower gene expression [35]. In our present investigation, we found no appreciable increase in the EGFP mRNA transcript in both HEK-293 and CHO-K1 cells when the intron was upstream on the expression cassette and found no appreciable IME. However, EGFP mRNA was severely decreased in HEK-293 when transfected with plasmid containing melittin intron downstream in the expression cassette. This reduction in exogenous gene expression might be due to the increased distance between the U1 snRNA recognition sites in the intron to the transcription start site and associated inefficient transcription re-initiation by the U1 snRNA, transcription factor II human, and RNA polymerase II complex [36-38]. Another possible reason for the reduction in the transgene expression could be due to the nonsense-mediated decay (NMD) of the mRNA. The mRNA molecule might have gotten degraded by proteins involved in the NMD process as the termination codon might have been detected as premature [39-42] [Figures 4 and 5]. Furthermore, melittin intron did not influence exogenous gene expression in CHO-K1 regardless of its position in the expression cassette.
 | Figure 4: Expression of EGFP in HEK-293 and CHO-K1 cells transfected with pVAX-1/E or pVAX-1/Mel-CIE or pVAX-1/Mel-CEI plasmid. Cells were seeded into 6-well plates and transfected with pVAX-1/E or melittin intron cloned pVAX-1 plasmid. The transfection efficiency was evaluated 24 h after transfection. [Click here to view] |
 | Figure 5: Relative quantification of EGFP expression in HEK-293 (a) and CHO-K1 (b) cells transfected with pVAX-1/E or pVAX-1/Mel-CIE or pVAX-1/Mel-CEI plasmid. The cells were treated with 2 μg of plasmids and Lipofectamin 2000 in 1:2 ratio for 5 h in incomplete media. After incubation the media was replaced with complete media. One way ANOVA analysis with 95% CI was carried out for statistical comparison of the EGFP expression among the intron and intron-less groups, and P < 0.05 was considered to be statistically significant. [Click here to view] |
4. CONCLUSION
In our present study, we have evaluated the amino acid information such as physicochemical characteristics, predicted secondary structure, antigenicity, and the solvent accessible region of melittin peptide from A. cerena indica through in silico approach. We found that the melittin from A. cerena indica is unstable, highly basic, and cationic in nature with hydrophobic N- terminal and hydrophilic C- terminal ends. Moreover, since the antigenic peptide is at the hydrophobic N- terminal region and the N- and C-terminal region of a protein are often unstructured and solvent accessible, the antibodies against the antigenic region are more likely to recognize the native melittin as well. Moreover, the small antigenic fragment can also be utilized for designing peptide and subunit therapeutics.
It is also widely known that IME plays a crucial function in the protein synthesis in many eukaryotic organisms, including insects, yeast, plants, and mammals. Many factors, such as epigenetics of cell types, transcription rate, mRNA export, Poly-A, and mRNA decay, can influence heterologous gene expression when introns are present. Towards this end, we evaluated the IME capabilities of melittin intron in HEK-293 and CHO-K1 cell lines for gene therapy, based on the presence and special arrangements of the intron in the expression cassette. We found that the melittin intron did not demonstrate any appreciable IME in both cell lines when transfected with plasmid containing CMV early promotor and BGH Poly-A tail in the expression cassette. Furthermore, to the best of our knowledge, this is the first study to report the influence of intron from an insect origin on transient gene expression in mammalian cellular environment. We also believe that the data provided from our preliminary work would be helpful in further elucidating the bioactive role of melittin intron and pharmacological potency of melittin in designing and development of new therapies and therapeutics.
5. ACKNOWLEDGMENT
HS and KKV would like to acknowledge the DST FIST, DST PURSE, UGC SAP, and RUSA facility at Madurai Kamaraj University for this study. The funders played no role in designing the study, data collection and analysis, manuscript preparation, or decision to publish.
6. AUTHORS’ CONTRIBUTIONS
HS and KKV formulated and designed the study. KKV, AR, and SL performed the experiments and analyzed the data. HS and KKV wrote and proofread the paper.
7. FUNDING
There is no funding to report.
8. CONFLICTS OF INTEREST
No potential conflicts of interest were reported by the authors.
9. ETHICAL APPROVALS
This study does not involve experiments on animals or human subjects.
10. DATA AVAILABILITY
All data generated and analyzed are included within this research article.
11. PUBLISHER’S NOTE
This journal remains neutral with regard to jurisdictional claims in published institutional affiliation.
REFERENCES
1. Hossen MS, Shapla UM, Gan SH, Khalil MI. Impact of bee venom enzymes on diseases and immune responses. Molecules 2017;22:25. [CrossRef]
2. Zhang S, Liu Y, Ye Y, Wang XR, Lin LT, Xiao LY,
3. Wehbe R, Frangieh J, Rima M, El Obeid D, Sabatier JM, Fajloun Z. Bee venom:Overview of main compounds and bioactivities for therapeutic interests. Molecules 2019;24:2997. [CrossRef]
4. Chen SY, Zhou P, Qin Y. Treatment of rheumatoid arthritis by bee-venom acupuncture. Zhen Ci Yan Jiu 2018;43:251-4.
5. Choi MS, Park S, Choi T, Lee G, Haam KK, Hong MC,
6. Lee SM, Lim J, Lee JD, Choi DY, Lee S. Bee venom treatment for refractory postherpetic neuralgia:A case report. J Altern Complement Med 2014;20:212-4. [CrossRef]
7. Liu XD, Zhang JL, Zheng HG, Liu FY, Chen Y. Clinical randomized study of bee-sting therapy for rheumatoid arthritis. Zhen Ci Yan Jiu 2008;33:197-200.
8. Kasozi KI, Niedba?a G, Alqarni M, Zirintunda G, Ssempijja F, Musinguzi SP,
9. Ceremuga M, Stela M, Janik E, Gorniak L, Synowiec E, Sliwinski T,
10. Kang SY, Kim YG, Kang S, Lee HW, Lee EG. A novel regulatory element (E77) isolated from CHO-K1 genomic DNA enhances stable gene expression in Chinese hamster ovary cells. Biotechnol J 2016;11:633-41. [CrossRef]
11. Saunders F, Sweeney B, Antoniou MN, Stephens P, Cain K. Chromatin function modifying elements in an industrial antibody production platform-comparison of UCOE, MAR, STAR and cHS4 Elements. PLoS One 2015;10:e0120096. [CrossRef]
12. Haddad-Mashadrizeh A, Zomorodipour A, Izadpanah M, Sam MR, Ataei F, Sabouni F,
13. Hermening S, Kugler S, Bahr M, Isenmann S. Increased protein expression from adenoviral shuttle plasmids and vectors by insertion of a small chimeric intron sequence. J Virol Methods 2004;122:73-7. [CrossRef]
14. Moonkyung K, Seon-Young K, Sukyung L, Young-Kwan L, JaeHo L, Hyun-Seock S,
15. Lee CP, Ko AM, Chiang SL, Lu CY, Tsai EM, Ko YC. Regulatory elements in vectors containing the ctEF-1alpha first intron and double enhancers for an efficient recombinant protein expression system. Sci Rep 2018;8:15396. [CrossRef]
16. Pereverzev AP, Markina NM, Ianushevich IG, Gorodnicheva TV, Minasian BE, Luk'ianov KA,
17. Quilici LS, Silva-Pereira I, Andrade AC, Albuquerque FC, Brigido MM, Maranhao AQ. A minimal cytomegalovirus intron A variant can improve transgene expression in different mammalian cell lines. Biotechnol Lett 2013;35:21-7. [CrossRef]
18. Shaul O. How introns enhance gene expression. Int J Biochem Cell Biol 2017;91(Pt B):145-55. [CrossRef]
19. Xu DH, Wang XY, Jia YL, Wang TY, Tian ZW, Feng X,
20. Nott A, Meislin SH, Moore MJ. A quantitative analysis of intron effects on mammalian gene expression. RNA 2003;9:607-17. [CrossRef]
21. Kolaskar AS, Tongaonkar PC. A semi-empirical method for prediction of antigenic determinants on protein antigens. FEBS Lett 1990;276:172-4. [CrossRef]
22. Garnier J, Gibrat JF, Robson B. GOR method for predicting protein secondary structure from amino acid sequence. Methods Enzymol 1996;266:540-53. [CrossRef]
23. Gasteiger E, Hoogland C, Gattiker A, Duvaud S, Wilkins MR, Appel RD,
24. Kyte J, Doolittle RF. A simple method for displaying the hydropathic character of a protein. J Mol Biol 1982;157:105-32. [CrossRef]
25. Hopp TP, Woods KR. Prediction of protein antigenic determinants from amino acid sequences. Proc Natl Acad Sci U S A 1981;78:3824-8. [CrossRef]
26. Manavalan P, Ponnuswamy PK. Hydrophobic character of amino acid residues in globular proteins. Nature 1978;275:673-4. [CrossRef]
27. Eisenberg D, Schwarz E, Komaromy M, Wall R. Analysis of membrane and surface protein sequences with the hydrophobic moment plot. J Mol Biol 1984;179:125-42. [CrossRef]
28. Fauchere JL, Pliska V. Hydrophobic parameters P of amino-acid side-chains from the partitioning of N-acetyl-amino-acid amides. Eur J Med Chem 1983;18:369-75.
29. Janin J. Surface and inside volumes in globular proteins. Nature 1979;277:491-2. [CrossRef]
30. Rao JK, Argos P. A conformational preference parameter to predict helices in integral membrane proteins. Biochim Biophys Acta 1986;869:197-214. [CrossRef]
31. Barrett LW, Fletcher S, Wilton SD. Regulation of eukaryotic gene expression by the untranslated gene regions and other non-coding elements. Cell Mol Life Sci 2012;69:3613-34. [CrossRef]
32. Bartlett JG, Snape JW, Harwood WA. Intron-mediated enhancement as a method for increasing transgene expression levels in barley. Plant Biotechnol J 2009;7:856-66. [CrossRef]
33. Gallegos JE, Rose AB. The enduring mystery of intron-mediated enhancement. Plant Sci 2015;237:8-15. [CrossRef]
34. Laxa M. Intron-mediated enhancement:A tool for heterologous gene expression in plants?Front Plant Sci 2017;7:1977. [CrossRef]
35. Furger A, O'Sullivan JM, Binnie A, Lee BA, Proudfoot NJ. Promoter proximal splice sites enhance transcription. Genes Dev 2002;16:2792-9. [CrossRef]
36. Bieberstein NI, Carrillo Oesterreich F, Straube K, Neugebauer KM. First exon length controls active chromatin signatures and transcription. Cell Rep 2012;2:62-8. [CrossRef]
37. Almada AE, Wu X, Kriz AJ, Burge CB, Sharp PA. Promoter directionality is controlled by U1 snRNP and polyadenylation signals. Nature 2013;499:360-3. [CrossRef]
38. Engreitz JM, Sirokman K, McDonel P, Shishkin AA, Surka C, Russell P,
39. Hir HL, Izaurralde E, Maquat LE, Moore MJ. The spliceosome deposits multiple proteins 20-24 nucleotides upstream of mRNA exon-exon junctions. EMBO J 2000;19:6860-9. [CrossRef]
40. Hir LH, Gatfield D, Izaurralde E, Moore MJ. The exon-exon junction complex provides a binding platform for factors involved in mRNA export and nonsense-mediated mRNA decay. EMBO J 2001;20:4987-97. [CrossRef]
41. Dreyfuss G, Kim VN, Kataoka N. Messenger-RNA-binding proteins and the messages they carry. Nat Rev Mol Cell Biol 2002;3:195-205. [CrossRef]
42. Dzikiewicz A, Szweykowska-Kulinska Z. Nonsense-mediated mRNA decay (NMD)--on guard of mRNA quality. Postepy Biochem 2006;52:390-8.