
1. INTRODUCTION
In tropical and subtropical climatic areas across the world, there are numerous species of Embelia. Embelia is climber/shrubs belonging to the sub-family Myrsinoideae of family Primulaceae. Embelia ribes is commonly known as Vidanga which is a Red-listed species (Low Risk-Near Threatened) [1]. In the traditional medicine systems Ayurveda, Siddha, and Unani parts of E. ribes are utilized. It is hard to distinguish the fruit of E. ribes from black pepper therefore pepper is added as an adulterant. Members of the Myrsinoideae family are economically, medicinally important plants. Seed and fruits of the Embelia species contain marker molecule embelin [2].
E. ribes is in high demand due to its use of Ayurvedic formulations, but it is frequently misidentified as Embelia basaal [1] and Embelia robusta [3]. Due to its growing demand E. ribes, is a commercially grown [4,5]. However, due to over-exploitation, depleting forest area, seed dormancy, embryos abortion, and hard seed coat, regeneration of the crop is poor [6]. There is the gradual disappearance of E. ribes due to the inherent sterility of the seeds [7,8]. Comparison of floral ontogeny of two each of Maesa and Embelia species, and Aegiceras corniculatum has shown phyllotaxy of 2/5-spiral development with few minor variations [9].
Phylogenetic analysis based on morphological characters, nuclear and chloroplast barcoding genes have been studied exhaustively for the genera belonging to family Primulaceae. Devaiah and Venkatasubramanian [10] have designed sequence characterized amplified region and also Random amplified polymorphic DNA (RAPD) marker for E. ribes to distinguish from the adulterants [11]. Amplified fragment length polymorphism has been used to detect polymorphisms in E. ribes and Embelia tsjeriam-cottam [12]. Chrungoo et al. have used Inter Simple Sequence Repeat (ISSR) primer and DNA barcode regions Interspersed Transcribed Spacer (ITS) and matK to check genetic diversity of E. ribes, Embelia subcoraceae, Embelia floribunda sampled from the North-east region of India. In a study by Bajpe et al. (2018), using DNA markers RAPD and ISSR the genetic variation within and between Embelia species, Maesa indica, and Ardisia solanacea from Karnataka’s the Western Ghats was analyzed.
To identify plants species a number of different DNA sequences regions been proposed; however, matK+rbcL is selected as core DNA barcodes along with ITS and trnH–psbA sequence [13]. Although these loci offer several advantages, it has long been recognized that no one locus is appropriate for all plant species. The objective of the current study is to assess the species discriminatory ability of DNA barcode and also, to understand the phylogenetic relation within the Embelia species.
2. MATERIALS AND METHODS
2.1 DNA Barcode Polymerase Chain Reaction (PCR), Sequencing, Homology Search
ITS4 and ITS5 sequence primers were used for PCR amplification of ITS1-5.8s-ITS2 sequence primers [14]. Primers (3FKIM and 1RKIM) designed by Ki-Joong Kim were used to amplify matK region following protocol described by the authors. Chromous Biotech, Bangalore sequenced the amplified products. Eighteen ITS sequences and six matK sequences were generated. After the sequences generated were submitted to the National Center for Biotechnology Information (NCBI) database, individual samples were granted accession numbers. Table 1 lists the sequences that have been deposited.
2.2. Phylogenetic Analyses and Species Discrimination
Multiple Sequence alignment (MSA) was carried out using Clustal W software. Phylogenetic trees were constructed using Mega X [15]. Using “Find best DNA model” within the Model feature of the Mega X software, model with lowest Bayesian information criterion (BIC) was obtained. With 1000 bootstrap (BS) replications, we built all the maximum likelihood (ML) phylogenetic trees applying best-fit DNA substitution model. Using the software Sequence Matrix, various barcode combinations were concatenated [16]. The Kimura 2-model was used to test the individual level discrimination rates for each marker using the “best match” (BM) and “best close match” (BCM) functions on TaxonDNA [17].
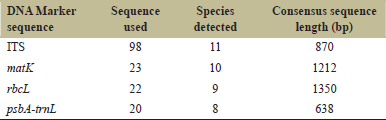 | Table 1: The ability of four DNA barcodes and their combinations to discriminate Embelia species. [Click here to view] |
3. RESULT
3.1. Species Discrimination
Plastid psbA had the highest success rate in species discrimination (BC and BCM-64.28%), followed by nuclear ITS (BC and BCM-60.49%) and rbcL (BC and BCM-50%) among the barcodes used. The matK had the least discriminatory power (BC and BCM-34.78%). The highest discrimination rate was obtained when barcodes were combined is 64.19% in ITS+psbA, 62.79% in ITS+matK+rbcL, and 62.92% in ITS+matK+rbcL+psbA were observed [Table 2]. Within the ITS and its combination, there was a noticeable variation between BC and BCM.
3.2. Phylogenetic Analysis
3.2.1. Inter-transcribed spacer
The phylogenetic tree was generated using 99 ITS sequences. 98 sequences were of Genus Embelia and a sequence of M. indica. In the case of MSA, the overall sequence length was 1036 bp. In terms of BIC scores, the Kimura two-parameter with gamma distribution was the model with the lowest score (K2+G).
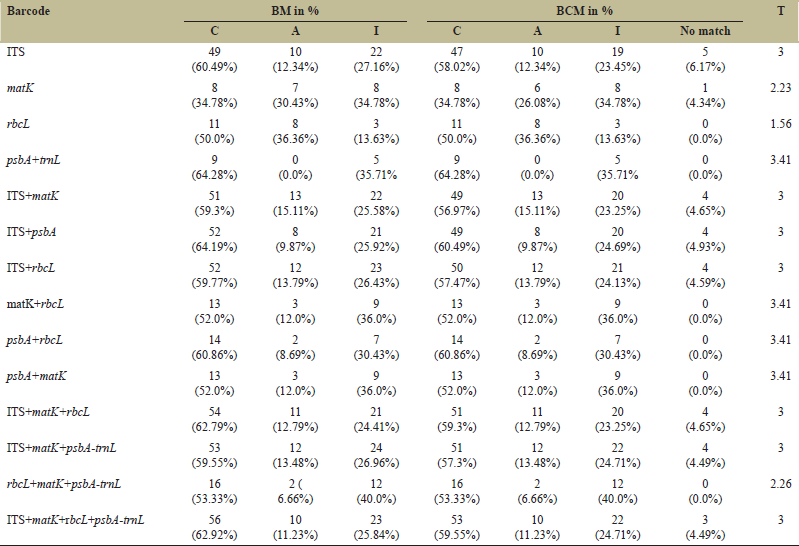 | Table 2: “Best match” and “best close match” TaxonDNA functions for identification of Western Ghats Embelia species. [Click here to view] |
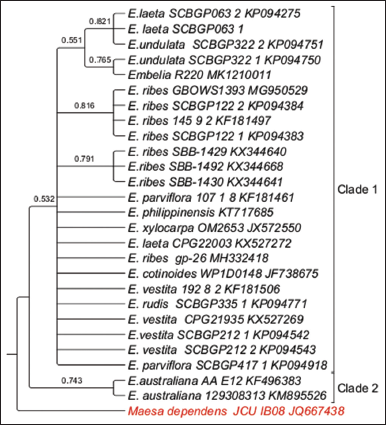
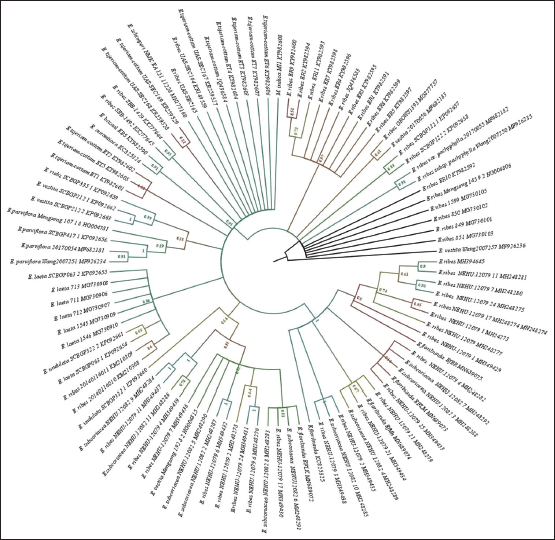 | Figure 1: Phylogenetic tree of maximum likelihood bootstrap of the ITS sequences of Embelia species. [Click here to view] |
In the current cladogram, five clades can be observed within the genus Embelia. Within the phylogeny, discordant distribution of E. ribes was observed. E. ribes was nested along with other species samples, obtained from similar topographical regions. Clade 1 contains E. ribes E. ribes var. pachyphylla and Embelia vestita samples from the Yunnan region of China and Western Ghat samples with several polytomies were observed. Samples from the Western Ghats E. basaal, Embelia aurantiaca, and only sample from Africa Embelia schimperi was nested within the clade 2. Furthermore, in clade two, samples of E. tsjeriam-cottam from Western Ghats and E. ribes (two samples each from Southern and Northern India, respectively) were observed. Within Clade three, seven samples Embelia laete and two samples of E. ribes from China isolated identical topographical regions and samples of Embelia undulata grouped. Clade four was well resolved with Embelia parviflora, E. vestita, and with samples of Embelia rudis with good BS values. Clade five and six were well resolved paraphyletic clades with E. ribes, the samples of E. floribunda, Embelia subcoriacea, and E. vestita were nested along within the clade containing samples of Western Ghats of Karnataka and Northeast India and China [Figure 1].
3.2.2. matK sequence
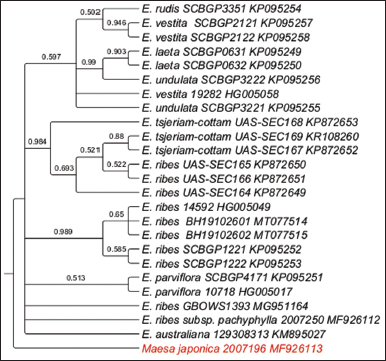
MSA was performed on 23 Embelia species and outgroup Maesa salicifolia sequences. MSA yielded an overall sequence length of 931 bp, with 782 bp (87.86%) being conserved, 79 bp (9.08%) being variable sites, and 17 bp (1.92%) being parsimony informative sites. Tamura-Nei was the model with the lowest BIC scores (T92).
The samples of ER8, ER10, EB2, and EB3 of Western Ghats contained a 24 bp insert AAATATTTTGTAAAAGTATTTACT.
The cladogram of the Embelia species contained a major clade. The clade bifurcated to give two subclades very strong BS support values <30%. One of sub-clade contained E. ribes (from the Western Ghats and China), E. basaal and E. tsjeriam-cottam and another subclade contained E. undulata, Embelia laeta, E. parviflora, E. vestita, E. rudis from China, Embelia xylocarpa from Mozambique, and Embelia australiana and E. parviflora formed basal polytomy [Figure 2]. In phylogeny of Embelia species, the Western Ghats samples have formed a monophyletic group in both ITS and matK analysis. The discordant distribution is seen in samples from Northeast Embelia species, E. subcoriacea, E. ribes, and E. ribes from China.
3.2.3. rbcL
In the rbcL Cladogram, 27 sequences from the NCBI database were utilized with one outgroup. MSA resulted in an overall sequence length of 570 bp of which 518 bp (90.5%) were conserved, 79 bp (9.47%) were variable sites, and 15 bp (2.63%) were parsimony informative sites. The model with the lowest BIC scores was the Tamura-Nei model (T92).
A well-resolved two clades were observed within the phylogeny. Within Clade 1, three subclades were observed and polytomy of several species from South East Asia such as China, the Philippines along with samples Embelia xlocarpa and Embelia cotinoides samples from Mozambique and Papua New Guinea, respectively. Two samples from Australia, E. australiana formed Clade 2. Node BS value of >50% was observed. The tip node BS of >than 75% was observed for E. laeta, E. undulata, E. ribes, and E. australiana [Figure 3].
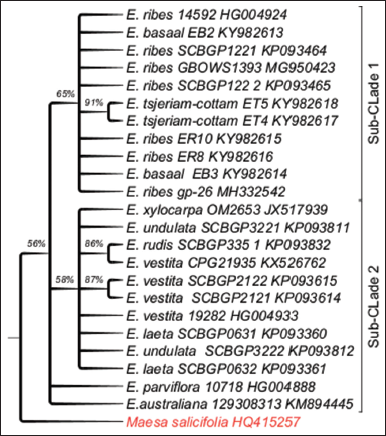 | Figure 2: Phylogenetic tree of maximum likelihood bootstrap of the matK sequences of Embelia species. [Click here to view] |
3.2.4. psbA-trnL
In the psbA-trnL Cladogram, 27 sequences from the NCBI database were utilized with one outgroup. MSA resulted in an overall sequence length of 604 bp of which 177 bp (29.5%) were conserved, 423 bp (70.3%) were variable sites, and 165 bp (27.3%) were parsimony informative sites. The model with the lowest BIC scores was the Tamura-Nei model (T92).
A well-resolved clades were observed within the phylogeny. Within the Clade, four subclades were observed and polytomy of several species from South East Asia such as China, the Philippines along with samples E. xlocarpa and E. cotinoides samples from Mozambique and Papua New Guinea, respectively. Two samples from Australia, E. australiana formed Clade 2. Node BS value of > 50% was observed. The tip node BS of >than 75% was observed for E. laeta, E. undulata, E. ribes, and E. australiana [Figure 4].
4. DISCUSSION
Barcodes for different plants have been studied extensively, but so far, no consensus has been reached. As a core barcode for plants, plastids region was initially proposed, but they have not been successful in all genus. ITS barcode was rejected by many researchers for inclusion in the core plant barcode region because it was challenging. Because of its lower intra-specific variation but larger inter-specific divergence, the ITS region has a high rate of proper classifying species. In several plant genera, combinations of ITS and plastid loci were discovered to be the optimum option [18]. Likewise for Embelia species, the ITS+psbA-trnL DNA barcode has similar discriminatory power as single barcodes. Similar results were observed in the species discrimination ability of Salacia species of Western Ghats [19,20]. Chen [21] proposed using ITS2 as a DNA barcode for fungus and green plants since it has a shorter sequence length than ITS and fast PCR amplification or sequencing rates [22].
 | Figure 3: Phylogenetic tree of maximum likelihood bootstrap of the rbcL sequences of Embelia species. [Click here to view] |
 | Figure 4: Phylogenetic tree of maximum likelihood bootstrap of the psbA-trnL sequences of Embelia species. [Click here to view] |
Many researches have shown that trnH–psbA is a suitable plant DNA barcoding marker [23]. The high species discrimination ability of psbA-trnL could be attributed to a low number of sequences deposited in the NCBI database. ITS sequences in the NCBI database were found to be greater than the matK, rbcL, and psbA-trnL [18]. In the current study, we could observe that the psbA-trnL has more variable site than the ITS sequences. As a result, the trnH–psbA region in Embelia species is a promising barcode to be utilized as a single barcode. It was observed that in the NCBI database the sequences were mainly from the South East Asia especially from the India and China and only couples of representative’s species such as E. xylocarpa from Mozambique, E. australiana from the Australia. Based on the TaxonDNA, the combination of matK+rbcL greatly improved the species discriminating rates to 52% from 34.78% and 50.0% respectively. At the species level, this combination’s overall identification capability is poor.
The purpose of phylogenetic analysis is to determine the utility of a DNA region as a barcode for detecting species specific clusters from the same genus and family [24]. The discordant distribution of E. ribes was seen in all the phylogenetic tree. Polytomies were identified in the current study’s barcode phylogeny, particularly in samples from the Western Ghats. This could be because Embelia species is a tropical species and mainly found is South East Asia, Western Ghats, and in Northern East parts of India.
TaxonDNA is used to evaluate various species, including Lilium species [25], Aquilaria species from China [26], and many more medicinal plants. TaxonDNA’s BM and BMC indexes may occasionally be lower than those found in tree-based analyses. As a result, it is optimal to employ TaxonDNA in conjunction with Tree-based analysis to identify species. Small barcoding gaps, significant interspecies similarity, unknown origin, and ambiguous evolution all contributed to limited discrimination in TaxonDNA analysis [27].
5. CONCLUSION
It is essential to know the discriminatory power of single or combination of barcodes for proper identification and authentication of species, so that when new studies on Embelia species are undertaken only the DNA barcode/s with higher discriminatory power shall be chosen to detect variation at inter and intraspecies levels.
6. AUTHORS’ CONTRIBUTIONS
All the authors have made substantive intellectual contributions to the content of this manuscript in the following areas: concept and design -SNB and KRK; data acquisition and analysis-SNB & KMM; drafting manuscript—SNB & RR; critical revision of manuscript SNB, ASB, KRM; and supervision- KRK, and final approval-SNB.
7. ACKNOWLEDGMENTS
The authors are grateful to the Institution of Excellence (IOE), University of Mysore, for the instrumentation facility. The authors express their sincere thanks to Dr. B. Yashovarma, Secretary, Sri Dharmasthala Manjunatheshwara Educational Society, Ujire, and to Head of Department, Botany and Biotechnology, Dr. B. A Kumara Hegde for the encouragement. The authors express sincere thanks to Dr. Sampath Kumara. K. K for his contribution in field survey and taxonomic identification of the Embelia species.
8. FUNDING
Nil.
9. CONFLICT OF INTERESTS
We declare no conflict of interests regarding the publication of this manuscript.
10. ETHICAL APPROVALS
This article does not contain any studies conducted on human or animal subjects.
11. DATA AVAILABILITY
All data generated and analyzed are included within this research article.
12. PUBLISHER’S NOTE
This journal remains neutral with regard to jurisdictional claims in published institutional affiliation.
REFERENCES
1. Mhaskar M, Joshi S, Chavan B, Joglekar A, Barve N, Patwardhan A. Status of Embelia ribes Burm f. (Vidanga), an important medicinal species of commerce from Northern Western Ghats of India. Curr Sci 2011;100:547-52.
2. Madhavan SN, Arimboor R, Arumughan C. RP?HPLC?DAD method for the estimation of embelin as marker in Embelia ribes and its polyherbal formulations. Biomed Chromatogr 2011;25:600-5. CrossRef
3. Kaushik S. Validation of pharmacopoeial characters of marketed samples of Embelia species (Vidanga). Int J Green Pharm 2021;14:367-74.
4. Shankarmurthy K, Krishna V, Maruthi KR, Rahiman BA. Rapid adventitious organogenesis from leaf segments of Embelia ribes Burm.-a threatened medicinal plant. Taiwania-Taipei 2004;49:194-200.
5. Tiwari SK, Goswami M, Saini P. Quantitative estimation of Embelin from Embelia tsjeriam-Cottam A. DC. and in vitro multiplication for production of quality planting stock. Int J Biotech Trends Technol 2021;11:1-6. CrossRef
6. Aparna PM, Suryanarayana MA, Rajasekharan PE, Bhanuprakash K, Umesha K, Maruthi Prasad BN. Seed propagation studies in Embelia ribes burm. F. J Pharmacogn Phytochem 2018;SP3:380-3.
7. Suresh G, Haridasan K, Pandala R. Comparison between traditional and conventional methods of seed storage and pretreatment in Embelia ribes-a threatened medicinal plant. J Tradit Folk Pract 2016;4:135-46.
8. Annapurna D, Srivastava A, Rathore TS. Impact of population structure, growth habit and seedling ecology on regeneration of Embelia ribes Burm. f.-approaches toward a quasi in situ conservation strategy. Am J Plant Sci 2013;4:28-35. CrossRef
9. Ma O, Saunders R. Comparative floral ontogeny of Maesa (Maesaceae), Aegiceras (Myrsinaceae) and Embelia (Myrsinaceae): Taxonomic and phylogenetic implications. Plant Syst Evol 2003;243:39-58. CrossRef
10. Devaiah K, Venkatasubramanian P. Genetic characterization and authentication of Embelia ribes using RAPD-PCR and SCAR marker. Planta Med 2008;74:194-6. CrossRef
11. Nagamani V, Rani A. Development of RAPD markers for identification and authentification of Embelia ribes-a red listed Indian medicinal plant. Int J Curr Microbiol Appl Sci 2018;6:2614-21.
12. Gowda B, Chandrika K, Prasanna K, Kirana V. AFLP authentication of Embelia ribes Burm. f. and Embelia tsjeriam-cottam A. DC. Int J Sci Nat 2010;1:58-60.
13. Hollingsworth PM, Graham SW, Little DP. Choosing and using a plant DNA barcode. PLoS One 2011;6:e19254. CrossRef
14. White T. Amplification and Direct Sequencing of Fungal Ribosomal RNA Genes for Phylogenetics. PCR-Protocols: A Guide to Methods and Applications; 1990. CrossRef
15. Kumar S, Stecher G, Li M, Knyaz C, Tamura K. MEGA X: Molecular evolutionary genetics analysis across computing platforms. Mol Biol Evol 2018;35:1547. CrossRef
16. Vaidya G, Lohman DJ, Meier R. SequenceMatrix: Concatenation software for the fast assembly of multi?gene datasets with character set and codon information. Cladistics 2011;27:171-80. CrossRef
17. Meier R, Shiyang K, Vaidya G, Ng PK. DNA barcoding and taxonomy in Diptera: A tale of high intraspecific variability and low identification success. Syst Biol 2006;55:715-28. CrossRef
18. Gogoi B, Bhau BS. DNA barcoding of the genus Nepenthes (Pitcher plant): A preliminary assessment towards its identification. BMC Plant Biol 2018;18:1-7. CrossRef
19. Badiger AS, Rudrappa MK, Bajpe SN. Assessing genetic diversity and DNA barcodes efficiency of Salacia and related species from Western Ghats, Karnataka. J Appl Biol Biotechnol 2021;9:67-74.
20. Pham NT, Le DP, Pham KT, Thipphavong X, Chu MH. DNA barcode of matK combined with ITS effectively distinguishes the medicinal plant Stephania brachyandra Diels collected in Laocai, Vietnam. J Appl Biol Biotechnol 2021;9:63-70. CrossRef
21. Chen S, Yao H, Han J, Liu C, Song J, Shi L, et al. Validation of the ITS2 region as a novel DNA barcode for identifying medicinal plant species. PLoS One 2010;5:e8613. CrossRef
22. Wang XY, Zheng SH, Liu Y, Han JP. ITS2, a better DNA barcode than ITS in identification of species in Artemisia L. Chin Herb Med 2016;8:352-8. CrossRef
23. Lahaye R, van der Bank M, Bogarin D, Warner J, Pupulin F, Gigot G, et al. DNA barcoding the floras of biodiversity hotspots. Proc Natl Acad Sci USA 2008;105:2923-8. CrossRef
24. Bolson M, de Camargo Smidt E, Brotto ML, Silva-Pereira V. ITS and trnH-psbA as efficient DNA barcodes to identify threatened commercial woody angiosperms from southern Brazilian Atlantic rainforests. PLoS One 2015;10:e0143049. CrossRef
25. Liu Y, Zhang M, Chen X, Chen X, Hu Y, Gao J, et al. Developing an efficient DNA barcoding system to differentiate between Lilium species. BMC Plant Biol 2021;21:465. CrossRef
26. Kang Y. Molecular identification of Aquilaria species with distribution records in China using DNA barcode technology. Mitochondrial DNA Part B 2021;6:1525-35. CrossRef
27. Yu J, Wu X, Liu C, Newmaster S, Ragupathy S, Kress WJ. Progress in the use of DNA barcodes in the identification and classification of medicinal plants. Ecotoxicol Environ Saf 2021;208:111691. CrossRef