
1. INTRODUCTION
Ginger (Zingiber officinale Rosc.) is an important spice in the family Zingiberaceae with 90 species [1]. Ginger plant is refreshingly aromatic but it is the rhizome (raw or processed) that is valued as a spice. Ginger is produced in more than 25 countries in the world. Nigeria, Nepal, India, China, Indonesia, Thailand, Korea, Philippines, Australia, and Malaysia are the major growing countries. Ginger as a spice is produced on a large scale in Nigeria for export compared to other spices like garlic, onion, and pepper and highly valued in the international market because of its aroma, pungency, and oleoresin content [2]. Ginger is extremely important in the production of curry powder and gingerbread and in some beers and other beverages. In addition to their medicinal qualities, ginger extracts may also serve as a natural larvicidal agent [3]. The refreshing aroma with strong taste makes ginger an important ingredient of most world food processing industries [4]. The production trend of ginger in Nigeria is low when compared to other export crops due to its poor yields which can be attributed to the lack of improved varieties [5]. In spite of these poor yields, Nigeria is the main producer and exporter of ginger in Africa and ranks 4th in the world after India, China, and Nepal [6]. The average production of ginger in Nigeria annually is 50,000 metric tonnes [7], out of which about 10% is used locally as fresh ginger while 90% is processed for both local usage and export. Owing to its status as a minor crop, ginger attracts little research effort; as a result, the yields have remained generally low due to lack of improved varieties [8].
The major constraint to ginger production in Nigeria is narrow gene pool, poor flowering, and lack of seed set [1]. Unsuitable soils and unfavorable ecological factors as well as lack of improved varieties are reasons for low yield and productivity [9]. Over 60 years of ginger cultivation in Nigeria, farmers have relied entirely on two local landraces, namely, UG1 and UG2 [10]. This lack of improved varieties has resulted in the low yields obtained by ginger farmers in Nigeria. However, new ginger lines have been developed through mutation breeding; these mutant lines must be evaluated in different agroecological zones to determine their growth and yield performance, adaptation, and superiority before they are released for wide cultivation. This has prompted this research across three locations in Cross River State, Nigeria. Thus, the objective of the study was a 2-year (2016 and 2017) field evaluation of growth and yield performances of 15 mutant lines and two landraces of ginger at three geographically distinct locations (Calabar, Ikom, and Ogoja) in Cross River State, Nigeria.
2. MATERIALS AND METHODS
2.1. Experimental Site
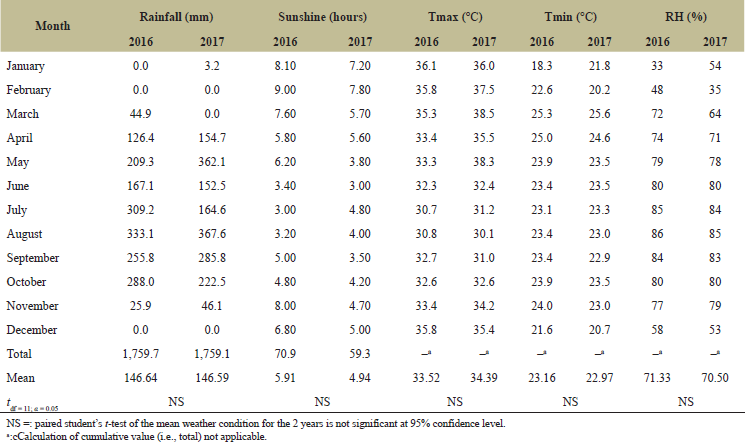
This experiment was carried out across three locations in Cross River State, Nigeria, during the 2016 and 2017 cropping seasons (March to December). The locations were Calabar (4.9757o N, 8.3417o E) (soil pH: 5.7, effective cation exchange capacity (ECEC): 7.94, and soil texture: loamy sand), usually with an annual rainfall of 2,915–3,500 mm and optimum temperature of 26°C, Ikom (5.9617oN, 8.7206oE) (soil pH: 5.8, ECEC: 11.74, and soil texture: sandy clay loam), with an annual rainfall of 2,250–2,332 mm and optimum temperature of 27°C, and Ogoja (6.6548oN, 8.7977oE) (soil pH: 5.2, ECEC: 5.57, and soil texture: sandy loam), with an annual rainfall of 1,848–2,200 mm and optimum temperature of 28.7°C [11]. The three locations were previously cropped to leafy vegetables under conventional organic farming management. Tables 1–3 give an overview of the actual rainfall, sunshine, temperature, and relative humidity recordings at the three experimental sites during the study period.
2.2. Planting Materials and Source
Seventeen ginger genotypes consisting of fifteen (15) mutant lines (UG1-11-07, UG1-13-02, UG1-2-35, UG1-5-04, UG1-5-18, UG1-5-22, UG1-5-31, UG1-5-35, UG1-5-38, UG1-5-48, UG1-5-49, UG1-5-52, UG1-7-24, UG2-11-03, and UG2-9-01) and two local check landraces (UG1 and UG2) were sourced from National Root Crop Research Institute (NRCRI), Umudike, Nigeria. The 15 mutant lines were derived from the existing landraces UG1 and UG2 by exposing them to different doses of gamma-ray irradiation. The mutant lines derived from UG1 were exposed to 2GY, 5GY, 7GY, 11GY, and 13GY doses of gamma-ray to give the following mutant lines: UG1-2-35, UG1-5-04, UG1-5-18, UG1-5-22, UG1-5-31, UG1-5-35, UG1-5-38, UG1-5-48, UG1-5-49, UG1-5-52, UG1-7-24, UG1-11-07, and UG1-13-02. The mutant lines derived from UG2 were exposed to 9GY and 11GY doses of gamma-ray to give the following mutant lines: UG1-9-01 and UG2-11-03.
2.3. Field Layout, Experimental Design, and Data Collection
This experiment was a split plot laid out in a Randomized Complete Block Design with three replications. An experimental plot measuring 26 × 8 m (208 m2) was used for this research in each of the locations. Each experimental unit measured 1 × 2 m (2 m2) with 0.5 m alley. The ginger setts or rhizomes weighing 10 g were planted in rows with inter- and intrarow spacing of 50 cm giving a plant population density of 40,000 kg/ha. Each rhizome was planted 4–5 cm beneath the soil with the growth buds facing up so that the shoots can grow towards the surface. Mulching was carried out immediately after planting using Chromolaena odorata (L.) R. M. King & H. Rob (commonly called Siam weed). Suitable agronomic practices were carried out. Nitrogen-Phosphorus-Potassium 15-15-15 fertilizer was applied at 120 kgN/ha in a split dose of 80 and 40 kg at 2 and 6 weeks after planting. Weeds were manually controlled at 2 and 6 weeks after planting (before fertilizer application). The fields were under rainfed irrigation. Data were collected on the following traits during growth and development: sprouting percentage (%), establishment count (%), and plant height (cm); at full maturity and harvest (by uprooting each plant in the sample plot), the following data were obtained: number of leaves per plant, leaf area (cm2), number of tillers per plant, number of rhizome fingers per plant, rhizome length (cm), and rhizome yield (t/ha). Data obtained were checked for homogeneity of variance and normality using Levene and Shapiro–Wilk tests, respectively, before being subjected to a two-way analysis of variance (ANOVA) using GenStat® for Windows® version 8.1 (VSN International Ltd, Hemel Hempstead, UK), and significant means were separated using Duncan Multiple Range Test (DMRT) at 5% level of significance [12]. Square-root (√x + 1) transformation was used for count data while percentages were log10 transformed. Interpreted results of the transformed data were back-transformed for presentation.
 | Table 1. Monthly weather conditions at Ikom in 2016 and 2017 (January–December). [Click here to view] |
 | Table 2. Monthly weather conditions at calabar in 2016 and 2017 (January–December). [Click here to view] |
 | Table 3. Monthly weather conditions at Ogoja in 2016 and 2017 (January–December). [Click here to view] |
 | Table 4. Mean sprouting percentages (%) of 17 ginger lines in Calabar, Ikom, and Ogoja at 4WAP (2016 and 2017 early season plantings). [Click here to view] |
3. RESULTS AND DISCUSSION
3.1. Sprouting Percentage at 4 Weeks after Planting (4WAP)
Combined ANOVA showed highly significant differences in the sprouting percentages (4WAP) among the genotypes (p < 0.01) (Table 4). Years and locations showed no significant differences in sprouting percentage (p > 0.05). Year by genotype interaction, location by genotype interaction, and year by genotype by location interactions were also not significant. Although the difference was not significant (p > 0.05), the mean sprouting percentage in 2017 (70.76%) was higher than that of 2016 (67.37%). Across the three locations, Ogoja had the highest mean sprouting percentage (73.47%), followed by Ikom (69.50%), while Calabar (64.22%) had the lowest.
3.2. Establishment Count at 8 Weeks after Planting (8WAP)
The establishment counts of 17 ginger lines at 8WAP across three locations in 2 years are presented in Table 5. Combined ANOVA indicated that there was no significant difference (p > 0.05) in the establishment count of the ginger lines across genotypes, years, locations, and genotype by environment interactions.
3.2.1. Plant height
As presented in Table 6, ANOVA showed that plant height was significantly (p < 0.01) different across genotypes, location, and year. Year by genotype interaction and year by location by genotype interaction were not significant (p > 0.05). However, location by genotype interaction was very highly significant (p < 0.001). Among the genotypes, UG2-11-03 and UG1-7-24 produced the tallest plants. Across the three locations, the tallest plants were observed in Ogoja followed by those planted in Ikom then Calabar. The ginger lines planted in 2017 (57.83 cm) were significantly taller than those planted in 2016 (53.47 cm).
 | Table 5. Establishment count (%) of 17 ginger lines in Calabar, Ikom, and Ogoja at 8WAP (2016 and 2017 early season plantings). [Click here to view] |
3.2.2. Number of leaves per plant
Combined ANOVA (Table 7) showed that genotype (p < 0.01) and location (p < 0.05), year by genotype interaction (p < 0.05), and location by genotype interaction (p < 0.01) significantly affected the number of leaves per plant of the ginger lines. Year and year by location by genotype interaction were not significant (p > 0.05). The mutant line, UG1-13-02, produced the highest number of leaves per plant and was similar to check UG1 but significantly different (p < 0.05) from check UG2. Overall, ginger lines planted in Ikom had the highest number of leaves per plant followed by Calabar while Ogoja had plants with the fewest number of leaves.
3.2.3. Leaf area
Highly significant (p < 0.01) differences in leaf area were observed across genotypes, locations, years, and location by genotype interaction (Table 8). Year by genotype interaction and year by location by genotype interaction were not significant (p > 0.05). The leave sizes of each of the checks (UG1 and UG2) were larger than those of their mutant derivatives. Ginger lines planted in Ogoja produced significantly larger leaves than those planted in Ikom and Calabar. The leaves of ginger planted in 2017 (34.37 cm2) were significantly larger than those planted in 2016 (31.53 cm2). In Ikom, the largest leaves were produced by UG1 and UG2, while in Calabar, they were below the location average. In Ogoja, UG2 had the highest mean leaf area, while UG1-2-35 plants produced significantly smaller mean leaf area.
3.2.4. Number of tillers per plant
The number of tillers per plant was significantly (p < 0.01) affected by genotype and location by genotype interaction (Table 9). Location, year by genotype interaction, and genotype by year by location interaction did not significantly (p > 0.05) affect the number of tillers per plant. UG2-11-03 produced the highest number of tillers per plant and was not significantly different from the checks. UG1-5-04 produced the least number of tillers per plant and was not significantly different (p > 0.05) from all the UG1-5 mutants. Ginger lines planted in 2016 had a significantly (p < 0.05) higher number of tillers (16.40) than those of 2017 (10.20). The number of tillers had an inconsistent trend across locations.
 | Table 6. Mean plant height (cm) of 17 ginger lines in Calabar, Ikom, and Ogoja (2016 and 2017 early season plantings). [Click here to view] |
3.2.5. Number of rhizome fingers
The number of rhizome fingers per plant was significantly affected by genotype, location, location by genotype interaction, year by genotype interaction, and year by location by genotype interaction (p < 0.01) except for the year effect (p > 0.05) (Table 10). The highest number of rhizome fingers was produced in Ogoja followed by Ikom, while Calabar had the least rhizome fingers. Consequently, there was a progressive increase in the mean number of rhizome fingers across the locations from year 2016 to year 2017.
3.2.6. Rhizome length
Significant differences in rhizome length were recorded for genotype (p < 0.01), location (p < 0.01), year (p < 0.05), year by genotype interaction (p < 0.01), location by genotype (p < 0.01), and year by location by genotype (p < 0.01) (Table 11). The mean rhizome length of the ginger lines planted in the three locations was significantly (p < 0.05) different from each other with Ogoja producing the longest rhizomes followed by Ikom, while Calabar produced the shortest rhizomes. The mean rhizome length of 2017 was significantly (p < 0.05) longer than those of 2016.
3.2.7. Rhizome yield
Combined ANOVA showed that there were significant differences in the yield of the ginger lines as influenced by the genotype, location, location by genotype interaction, year, year by genotype interaction, and year by location by genotype interaction (p < 0.01) (Table 12). Year had no significant effect on the yield of the ginger lines (p > 0.05). Among the genotypes, the highest yield was obtained from UG1-5-04 followed by UG1-5-35 and UG2-9-01, while the lowest yield was reported for UG1-11-07. The rhizome yield of UG1 and UG2 was not significantly (p > 0.05) different. Seven out of the thirteen mutant lines derived from UG1 gave significantly (p < 0.05) higher yields than UG1. The two mutant lines derived from UG2 gave significantly higher yields compared to UG2. Overall, the mean yield obtained in Ogoja was not significantly (p > 0.05) different from that obtained in Ikom, but both yields were significantly (p < 0.05) higher than the yield obtained in Calabar.
 | Table 7. Mean number of leaves per plant of 17 ginger lines in Calabar, Ikom, and Ogoja (2016 and 2017 early season plantings). [Click here to view] |
4. DISCUSSION
In the present study, it is established that the variation in genotypes was highly significant for all the measured traits except establishment count. The ginger mutant lines were significantly different (p < 0.05; p < 0.01) in their mean performances for sprouting percentage, plant height, number of leaves per plant, leaf length, leaf width, leaf area, number of tillers per plant, number of rhizome fingers per plant, rhizome length, and rhizome yield. These significant variations in the phenotypic expression of the various characteristics might be due to the inherent genetic properties of the ginger mutant lines; this reveals the presence of considerable genetic variations in the ginger mutant lines for these attributes [13]. It also implies the potentials of these mutant lines to be used as source material for the genetic improvement of growth and yield characters in ginger in these areas. According to Sumanth et al. [14], the success of any crop improvement programme depends on the extent of genetic variations that exist in the available germplasm of that crop. Ginger lines used in this study were inconsistent in their performances across the different characters. Similar significant variations among ginger genotypes were also observed by Goudar et al. [15], Jatoi and Watanabe [13], and Aragaw et al. [16] who reported significant genotype differences across several growth and yield characters in ginger. The superior performance in yield and other characters in some of the mutant lines over the check landraces from which they were derived showed that the variability created by mutation had positive effects on the mutant lines. Improvements in the growth and yield traits of different crops through mutation breeding have been reported by several crop breeders [4,17–19]. Inducing mutation has been considered an established method for increasing genetic variability in many crops. Mutation breeding is an essential tool in crop improvement of vegetatively propagated crops, especially in plants with reproductive sterility. According to Food and Agriculture Organization of the United Nations [20], over 2,450 varieties in different crops developed through mutation breeding have been commercially released. This includes vegetatively propagated crops such as garlic, cassava, turmeric, and potato. Breeding of ginger is greatly challenged by poor flowering and seed set and a great number of crop improvement programmes of these genotypes are limited to evaluation and selection of naturally occurring variations [21]. Induced mutation is therefore an alternative and reliable way of creating variability in these crops [18]. Hence, the observations recorded in the yield performances of the mutant lines used in this study have significant implications. The results also showed that location significantly affected the growth and the yield characters of the ginger lines.
 | Table 8. Mean leaf area (cm2) of 17 ginger lines in Calabar, Ikom, and Ogoja (2016 and 2017 early season plantings). [Click here to view] |
 | Table 9. Mean number of tillers per plant of 17 ginger lines in Calabar, Ikom, and Ogoja (2016 and 2017 early season plantings). [Click here to view] |
 | Table 10. Mean number of rhizome fingers per plant of 17 ginger lines in Calabar, Ikom, and Ogoja (2016 and 2017 early season plantings). [Click here to view] |
 | Table 11. Mean rhizome length (cm) of 17 ginger lines in Calabar, Ikom, and Ogoja (2016 and 2017 early season plantings). [Click here to view] |
 | Table 12. Mean rhizome yield (t/ha) of 17 ginger lines in Calabar, Ikom, and Ogoja (2016 and 2017 early season plantings). [Click here to view] |
The variation in yield in Ogoja and Ikom was not significantly different but was significantly higher than those of Calabar. This result suggests Ogoja and Ikom as favorable locations for ginger cultivation. Attoe et al. [22] also observed significant differences in the growth and yield parameters of ginger genotypes across soils of different locations in Cross River State. The high significant effects of genotype by environment interaction observed for yield and most of the traits clearly demonstrate that genotype and environment interaction across the environments play an important role in breeding adaptable genotypes to wide environments. The variations observed in yield and yield traits of the ginger lines across the locations and years may be attributed to the inherent transferable parental trait differences in the ginger lines as well as the environmental influence. Mohandas et al. [23] also observed significant genotype by environment interactions in some growth and yield traits of ginger. Alghamdi [24] reported that significant genotype by environment interactions suggests that, across environments, some genotypes were more stable than others. According to Ghaffari and Depao [25], yield differences attributed to environment are relevant to genotype evaluation and mega-environment investigations.
5. CONCLUSION
UG2-11-03 gave superior performances for plant height and number of tillers per plant. Its performances across the other traits were relatively high and above average for most. UG2-9-01 had the highest number of rhizomes per plant and also produced the longest rhizomes. With respect to rhizome yield, UG1-5-04 was the highest performing mutant line followed by UG1-5-35 and UG2-9-01. Ginger rhizome yields in Ogoja and Ikom were not significantly different from each other but both were significantly higher than that obtained in Calabar. The locations Ikom and Ogoja are recommended as good environments for ginger cultivation. The information obtained from this research work will be important in the development of excellent selection procedures for the improvement of ginger genotypes under this agroecology and also serve as a source of useful information for the cultivation of ginger in the region. However, further evaluation and testing of these ginger mutant lines in other agroecological zones and across different environments will be necessary before subsequent release.
6. ACKNOWLEDGMENTS
The authors wish to acknowledge the Ginger Research Unit of the NRCRI Umudike, Abia State, Nigeria, for making the ginger lines used for this research available.
7. CONFLICT OF INTEREST
The authors declared that there are no conflicts of interest.
8. AUTHOR CONTRIBUTIONS
All authors made substantial contributions to conception and design, acquisition of data, or analysis and interpretation of data; took part in drafting the article or revising it critically for important intellectual content; agreed to submit to the current journal; gave final approval of the version to be published; and agree to be accountable for all aspects of the work. All the authors are eligible to be an author as per the international committee of medical journal editors (ICMJE) requirements/guidelines.
9. FUNDING
There is no funding to report.
10. ETHICAL APPROVALS
This study does not involve experiments on animals or human subjects.
11. PUBLISHER’S NOTE
This journal remains neutral with regard to jurisdictional claims in published institutional affiliation.
REFERENCES
1. Kizhakkayil J, Bhas S. Diversity, characterization and utilization of ginger: a review. Plant Genet Resour 2011;9:464–77; doi:10.1017/S1479262111000670 CrossRef
2. Famurewa AV, Emuekele PO, Jaiyeoba KF. Effect of drying and size reduction on the chemical and volatile oil content of ginger. J Med Plants Res 2011;5(14):2941–4; doi:10.5897/JMPR.9000476
3. Kalaivani K, Senthil N, Murugesan, GA. Biological activities of selected Lamiaceae and Zingiberaceae. Parasitol Res 2012;11(3):1261–8; doi:10.1007/s00436-011-2623-x CrossRef
4. Sarwar A, Butt SJ. Evaluation of mutant lines of Rosa species. Adv Crop Sci Technol 2016;3(5):1–5; doi:10.4172/2329-8863.1000196
5. Amadi CO. (2012). Ginger breeding in Nigeria: challenges and prospect. J Appl Agric Res 2012;4(2):155–63.
6. Food and Agriculture Organization of the United Nations. Production quantity of ginger in metric tonnes. Food and Agriculture Organization of the United Nations, Rome, Italy, 2018.
7. Ezeagu W. Ginger export. A paper presented at 3-day National Workshop on massive cassava and ginger production and processing for local industries and export, held at Fati Muasu Hall. National Centre for Women development, Abuja, Nigeria, 2006.
8. Iwo GA, Ekaette EA. Genetic components analysis of yield related traits in some ginger genotypes. Niger J Genet 2010;23:81–5.
9. Nmadu JN, Marcus PL. Efficiency of ginger production in selected Local Government of Kaduna State, Nigeria. Int J Food Agric Econ 2013;1(2):39–52. Available via http://www.foodandagriculturejournal.com/Vol%201%20No%202%2039-52.pdf
10. Chukuwu GO, Emehuite JK. Fertilizer efficiency and productivity of ginger on a hapilyariscol in southern Nigeria. In: Akoroda MO (ed.). Root crops: the small processor and development of local food industries for market economy. Ibadan Polytechnic Venture, Ibadan, Nigeria, 2003.
11. Effiong J. Changing the pattern of use in the Calabar river catchment South eastern Nigeria. J Sustain Dev 2011;4(1):92–102; doi:10.5539/jsd.v4n1p92 CrossRef
12. Gomez KA, Gomez AA. Statistical procedures for agricultural research. 2nd edition, John Wiley & Sons, New York, NY, p 680, 1984.
13. Jatoi AS, Watanabe, KN. Diversity analysis and relationship among ginger landraces. Pak J Bot 2013;45(4):1203–14. Available via http://pakbs.org/pjbot/
14. Sumanth V, Suresh BG, Ram BJ, Srujana G. Estimation of genetic variability, heritability, and genetic advance for grain yield components in rice (Oryza sativa L.). J Pharmacol Phytochemistry 2017;6(4):1437–9. Available via https://www.phytojournal.com/archives/2017/vol6issue4/PartU/6-4-59-298.pdf
15. Goudar SA, Gangadharappa PM, Dodamani SM, Lokesh C, Dharamatti VU. Evaluation of ginger (Zingiber officinale) genotypes for growth and yield attributes. Int J Pure Appl Biosci 2017;5(2):994–9; doi:10.18782/2320-7051.2888 CrossRef
16. Aragaw MS, Alamerew G, Michael H, Tesfaye A. Variability of ginger (Zingiber officinale Rosc.) accessions for morphological and some quality traits in Ethiopia. Int J Agric Sci 2011;6:444–57; doi:10.3923/ijar.2011.444.457 CrossRef
17. Edirimanna EP, Korla BN. Induced variation for yield and quality characters of ginger (Zingiber officinale) using ethyl methane sulphonate. Ann Sri Lanka Dep Agric 2007;9:9–17.
18. Selvarasu A, Kandhasamy R. Analysis of variability, correlation and path coefficient in induced mutants of glory lily (Gloriosa superb L.). Int J Plant Breed 2013;7(1):69–75. Available via http://www.globalsciencebooks.info/Online/GSBOnline/images/2013/IJPB_7(1)/IJPB_7(1)69-75o.pdf
19. Raina A, Lasker RA, Khursheed S, Amin R., Tantray YR, Parveen K, et al. Role of mutation breeding in crop improvement – past, present and future. Asian Res J Agric 2016;2(2):1–13; doi:10.9734/ARJA/2016/29334 CrossRef
20. Food and Agriculture Organization of the United Nations. Ginger: post-production management for improved market access. Prepared by Plotto, A. Edited by Mazaud, F, Rotter, A and Steffel, K. Food and Agriculture Organization of the United Nations, Rome, Italy, 2006.
21. Givilidharan MP, Balakrishnan S. Gamma ray induced variability in vegetative and floral characters of ginger. Indian Cocoa, Arecanut Spices J 1992;15:68–72.
22. Attoe EE, Ojikpong TO, Kekong MA. Evaluation of growth and yield parameters of two ginger varieties in different soils of Cross Rivers State, Nigeria. Eur J Acad Essays 2016;3(3):109–20.
23. Mohandas, TP, Pradeep Kumar, T, Mayadevi, P, Aipe, KC, Kumaran, K. Stability analysis in ginger (Zingiber officinale Rosc.) genotypes. J Spices Aromat Crops 2000;9:165–7; http://updatepublishing.com/journal/index.php/josac/article/view/4574
24. Alghamdi SS. Yield stability of some soybean genotypes across diverse environments. Pak J Biol Sci 2004;7(12):2109–14; doi:10.3923/pjbs.2004.2115.2120 CrossRef
25. Ghaffari AA, Depao E. Agroclimatic zoning of Iranian cold drylands. In the Proceeding of the Iranian Crop Sciences Congress, Karaj, Iran, 2006, pp 42–48.