
Plant growth promoting microorganisms (PGPM) incorporating plant growth promoting rhizobacteria (PGPR), fungi and the recent “bio-effectors” also known as BIOFECTORS (
Field biologists often rely either on simple end of crop data (e.g., grain yield), or metadata analyses [5] for PGP assessments. Following biostimulants treatment [6,7] indeed new generation sequencing tools [8] provide vibrant dynamics of gene expression assays on plant growth promoting (PGP) phytohormone responses. Thermogravimetric analyses (TGA) of Plant/seaweed biostimulants (Rygex, Manek, and Ecoryg) revealed physicochemical information and structural architecture of plant cell-walls and when coupled with wheat leaf senescence bioassays [9] gained insights on phytohormone effects. However, concomitant PGPRs’ cell wall compositional informatics in the plant rhizosphere biome, a site wherein biofertilizer agents and their qualitative and quantitative traits that impact [10] the growth and development of the host plant, is lacking. A discernible gap, therefore, exists in our knowledge and capacity for availing new tools and approaches such as TGA on PGPRs. To this end, we set out using a winter wheat pot culture evaluation model, to validate the feasibility of using non-molecular combinatorial chemical tools (e.g., TGA and Fourier transform infrared [FTIR]) for rapid, reliable, robust, sensitive detection of chemical signatures unique to interactive PGPR biostimulant colonizer strains in the plant rhizobiome, and the potential usefulness of TGA data to enhance precision agriculture management is discussed.
2. MATERIALS AND METHODS
2.1. Pot Trial for Evaluating the Detection of Bacterial Biostimulants using TGA, Microbiological, and Molecular Methods
A pot trial on winter wheat (variety J B Diego) raised in low and standard phosphorus fertility grade local soils. A factorial randomized plot design comprised the soils were filled in 60 pots that represented six treatments of five bacterial inoculants, one untreated control, and two replicates of each treatment/soil type. Specific strains [Table 1] comprising six commercial rhizobacteria (source: University of Hohenheim, Germany) three Gram positives, namely, Bacillus mucilaginosus, Bacillus amyloliquefaciens, and Bacillus subtilis and three Gram-negatives Burkholderia sp., Rahnella aquatilis (strain H 2.6), and R. aquatilis (strain RC 2.5) were applied as a mixed cocktail at the rates prescribed by the commercial suppliers (>1.0 × 10⁶ colony forming units (CFU) ml-1g-1) uniformly in the pots at the time of sowing, and as a PGPR enrichment dressing after 4 weeks of wheat crop emergence. Root samples were drawn 2 weeks after the enrichment dressing step for further TGA, microbiological, and molecular analyses.
Table 1: Biostimulants used on wheat grown on low fertility field soil in a pot experiment.
| Biostimulant (Microbial Biofector) | Phosphate solubilisation assay | Bacterial Inoculum | Recovery of bacteria from roots (at the time of root sampling) |
|---|---|---|---|
| Colony forming units ml-1g-1 | |||
| FZB42 (Bacillus amyloliquifaciens) | + | 8.3×10⁵ | |
| Paenibacillus mucilaginosus | + | 2.14×10⁶ | |
| Paenibacillus mucilaginosus + FZB42 | + | 3.8×10⁶ | |
| Proradix (Pseudomonas sp) | + | 4.7×10⁶ | |
| AFBI P-solubilisers (mixed) Rahnella aquatalis, Paenibacillus polymyxa, Burkholderia spp | + | 2.28×10⁶ | |
* Mean (biostimulant bacteria inoculum applied to soil) >2.0×10⁶ (cfu) ml-1g-1.
** The mean total bacterial counts recovered from root surfaces at the time of sampling
2.2. TGA for Detection of PGPR Biostimulants in WHEAT roots
Aliquot of 100 mg of representative washed dried root tissue samples was freeze-dried and these were ready for TGA analyses within 2 h of sampling. TGA was performed using a Mettler TGA/DSC 1. Two methods of pyrolysis were carried out in a nitrogen atmosphere with a controlled gas flow rate of 50 ml/min. In the first one, pyrolysis was achieved at a constant heating rate of 20°C/min and the temperature range 32–800°C. In the second one, a temperature range of 32–600°C and a dynamic heating rate which varied from 0.5°C/min to 20°C/min which allowed for maximum resolution (MaxRes). Pyrolysis analysis was performed in triplicate. Due to limited material, MaxRes analysis was performed in duplicate. Principal component analysis (PCA) was performed on the data produced from FTIR and TGA analyses [11,12] on specific strains, namely, six commercial rhizobacteria (source: University of Hohenheim, Germany) three Gram-positives, namely, B. mucilaginosus, B. amyloliquefaciens, and Bacillus subtilis and three Gram-negatives Burkholderia sp., R. aquatilis (strain H 2.6), and R. aquatilis (strain RC 2.5) and their profiles held as reference thermal degradation thermogram profiles databank library in our laboratory.
2.3. Microbiological Methods
2.3.1. Microscopy, culture, and growth media/plating techniques of root tissues
Fresh root tissues were thoroughly washed in sterile water to remove any adhering soil lumps. Using adsorbent paper, the fresh root tissues were carefully blotted and adequately dried. A piece of the root tissue of winter wheat was examined under the light microscope. In this routine root surface microscopic visualization technique, methylene blue dye staining for visualizing bacterial colonization of the root surface. A 2 mM solution of DMAO (DMAO), a membrane-permeable DNA dye (supplied at 2 mM in DMSO by BiotiumR) that preferentially binds to dsDNA with green fluorescence (Ex/Em (DNA bound) = 503/530 nm), served as a staining agent for ascertaining “live” bacteria (usually seen in blue-green stain as per manufacturer’s protocols
Emergent putative bacteria and fungi from the root surface were determined through appropriate culture media and plating techniques.
2.3.2. Molecular analysis for the detection of PGPR biostimulants in root tissue surface
Aliquots of whole root tissues from above were subjected to molecular assays involving polymerase chain reaction (PCR) for the amplification of either fungal 18S rDNA ITS regions 16S rRNA universal bacterial amplicons were employed [13] to establish the root surface resident or fungal surface piggy backing bacteria (e.g., ectosymbionts), respectively. Resulting PCR amplicon sequences obtained for fungal or bacterial samples were established from chromatogram analysis [14] and the confirmed set of sequences was compared with those stored in the GenBank using the BLASTn alignment software (
2.3.3. Statistical scrutiny of data emerging from three disparate methods comprising chemical, microbiological, and molecular approaches to detect the same bacteria
The standard error calculations emerging from each data sets comprising chemical (TGA), molecular (culture-PCR and direct tissue), and microbiological (plate culture) analyses would have unequal replicates. To statistically validate the assumptions made for standard errors and the linear correlation (magnitude of variance) between the three methods, an altman-bland estimation [15] was used for drawing comparative relationships of agreement between variant measurements while achieving the detection of the same bacteria.
3. RESULTS
3.1. TGA MaxRes Method for the Detection of PGPR Biostimulants in Wheat Roots
Aliquot colonies representative of the specific introduced microbial biostimulant PGPR strains identified in the aforesaid microbiological and molecular steps were further analyzed using combinatorial chemical methods. Thermogravimetric pyrolysis first derivative weight loss profiles [Figure 1] is shown Figure 1a and b inset blocks for Gram-positive and Gram-negative bacteria, respectively. The bacterial cell composites comprising lipids, polysaccharides and proteins tended to thermally degrade over a temperature range starting around 150°C up to 450°C. In the case of the Gram-positive bacteria, Figure 1a, the thermograms consist of a main broad weight loss event in this range. The thermal degradation profiles of the Gram-negative bacteria, Figure 1b, exhibited difference in profiles from that of the Gram-positive bacteria in that the appearance of a well-defined shoulder to the main weight loss peak around 250°C indicated the presence of more volatile components. In the case of Burkholderia sp. the main weigh loss peak, being narrow and of increased magnitude, suggested a relatively chemically homogeneous composition of cell wall material.
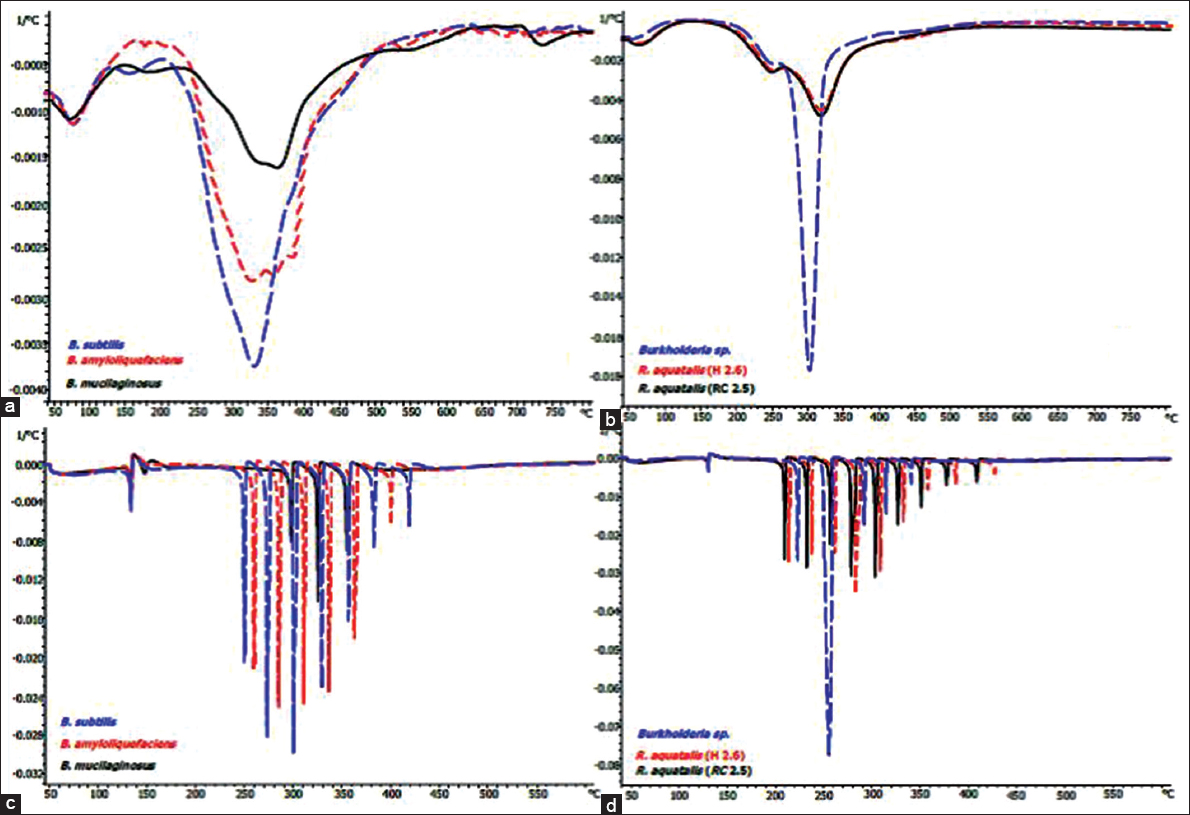 | Figure 1: First derivative weight loss profiles obtained from maximum resolution thermogravimetry analysis of wheat root surface resident bacteria. Standard Thermogravimetric analyses (TGA) pyrolysis of cell walls from Gram-positive bacteria (a); standard TGA pyrolysis of cell walls from Gram-negative bacteria (b); TGA maximum resolution pyrolysis of cell walls from Gram-positive bacteria (c); TGA maximum resolution pyrolysis of cell walls from Gram-negative bacteria (d). [Click here to view] |
3.1.1. Thermogram traces from TGA analysis of cell walls of biostimulants
The TGA MaxRes method generated a detailed thermogram, separating the individual thermal weight loss events occurring over the range of degradation that resulted in defined profiles as first level dependent TGA fingerprints. The MaxRes fingerprints [Figure 1c and d] for the Gram-positive and Gram-negative bacteria, respectively, demonstrated that the extent of thermal degradation of organic molecules which is dependent on intramolecular strength of bonding, the degree of cross-linking, and the nature of the various subunits involved in disparate molecules. It can be inferred that the number of individual peaks relates to the heterogeneity of the bacterial cell wall. For example, while the cell wall of B. mucilaginosus was the most homogeneous with only three separate weight loss peaks [Figure 1c] compared to the six of B. amyloliquefaciens and the seven of B. subtilis.
3.1.2. Thermal pyrolysis and degradation peak variations between biostimulant strains
The peak temperatures of all the individual MaxRes weight loss peaks are summarized in Table 2. A clear distinction between the Gram-positives themselves was evident. No two bacteria had identical peak attenuations in lower, central, or higher weight loss peak range. While all Gram-positives tested in this study had no peaks before 249°C, Gram negatives have degradation peaks starting from 213°C. The only cell wall components degradation peak common zone observed for both Gram-positive and Gram-negative bacteria, is the central thermal degradation temperatures (shown in the box highlighted with a dark border in Table 2) that fell between 299 and 328°C. It is noteworthy that strain level variation is evident amongst all three categories of low, central, and higher range of thermal degradation peak sets.
Table 2: Peak degradation temperatures based on thermogravimetric analyses maximum resolution pyrolysis of bacterial cell walls.
| Bacterial Biostimulant | Degradation peak temperatures °C | ||||||||
|---|---|---|---|---|---|---|---|---|---|
| Lower range | Central range | Higher range | |||||||
| Bacillus subtilis | 249.21 | 273.46 | 299.43 | 327.82 | 355.49 | 382.35 | 418.25 | ||
| Bacillus amyloliquefaciens | 259.28 | 285.15 | 310.08 | 335.33 | 361.96 | 400.16 | |||
| Bacillus mucilaginosus | 298.03 | 324.81 | 354.80 | ||||||
| Burkholderia sp. | 226.37 | 256.68 | 294.50 | 317.38 | 344.48 | ||||
| Rahnella aquatilis (H 2.6) | 217.57 | 242.17 | 265.25 | 286.36 | 310.59 | 334.53 | 360.50 | 388.53 | 429.11 |
| Rahnella aquatilis (RC 2.5) | 213.30 | 237.08 | 260.41 | 281.34 | 305.30 | 328.94 | 352.60 | 379.28 | 409.89 |
The weight loss of thermal degradation [Figure 1d] of both strains of R. aquatilis showed that they have a more heterogeneous cell wall composition than that of Burkholderia sp. For Burkholderia sp., the lower degradation points started from peaks at °C-226, 256, 294, and 317, with a final attenuated peak of 344; and none detected beyond that point [Table 2]. However, for the two R. aquatilis strains, the degradation temperature patterns were variant starting from peaks for R. aquatilis (H.2.6) at °C-217, 242, 265, 286, 310, 334, 360, and 388 and through to 429 while for R. aquatilis (RC 2.5) the peak attenuations started from 213, with peaks at °C-237, 260, 281, 305, 328, 352, 379, and 409, respectively. The greater degree of definition on offer by MaxRes pyrolysis heightened corresponding peak temperature divergences. This thereby raised the potential of this method, further to allowing for differentiation of bacterial species, for strain level bacterial identification within the speciation of either Gram-positive or Gram-negative bacteria.
3.1.3. PCA on the data produced from FTIR and TGA analysis on specific strains, namely, six commercial rhizobacteria
PCA of the FTIR data [Figure 2a] for statistically significant replicate composites for each bacteria showed a relatively greater clustering (e.g., Burkholderia sp), B. subtilis and B. amyloliquefaciens and these assemblages illustrated a clear delineation between the Gram-negative and the Gram-positive bacteria but not within the group. Quite remarkably, the PCA cluster plots of TGA pyrolysis data for bacteria [Figure 2b and c] indicated an improvement in differentiation between the two Gram bacterial groups using TGA rather than FTIR. In addition, the two strains of R. aquatilis were distinctly differentiated using TGA whereas the FTIR was unable to clearly discriminate from one another. However, it has to be noted that FTIR allowed a clearer distinction between Gram-positive and Gram-negative bacteria than the TGA [Figure 3]. The use of FTIR as a combinatorial tool alongside TGA MaxRes pyrolysis data might heighten the qualitative differentiation between Gram-positive and Gram-negative bacterial colonizers in the rhizosphere. For instance, the FTIR bands associated with cell wall chemical constituent-specific organic molecules comprising carbohydrates, lipids, amino/amides, and others that have definitive reactive groups, namely, hydroxyl (-OH), methyl (-CH3), methylene (-CH2), carbonyl (-CO), amide (C-N), and amide (-NH2) that exhibits unique chemical 3-D structural features such as bonding patterns (bending, stretching) and molecular hierarchical speciation (e.g., scissoring, vibrations rocking) that are readable from the FTIR spectral traces of the bacterial cell wall.
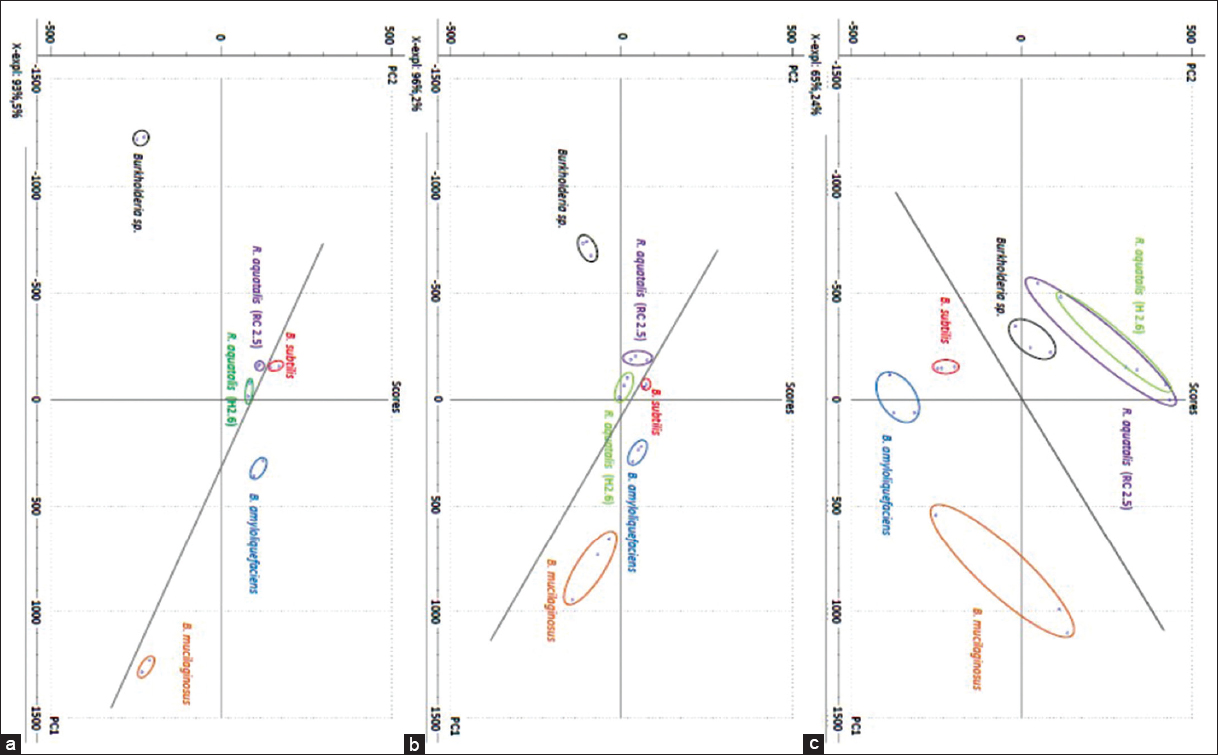 | Figure 2: Principal component analysis plots based on data from Fourier transform infrared (FTIR) and Thermogravimetric analyses (TGA) pyrolysis of bacterial cell walls. FTIR spectroscopy of bacterial cell walls (a); standard TGA pyrolysis of bacterial cell walls (b); TGA maximum resolution pyrolysis of bacterial cell walls (c) [Click here to view] |
 | Figure 3: Fourier transform infrared (FTIR) spectra of bacterial cell walls from (a) gram positive bacteria; (b) gram negative bacteria. FTIR group assignations: ~3280 cm-1 OH stretching – carbohydrate; 2960–2970 cm-1 CH3 stretching – lipids; 2925–2935 cm-1 CH2 stretching – lipids; 1630–1650 cm-1 NH2 bend , C-O, C-N stretching – amide I; 1530–1550 cm-1 amide II; 1440–1450 cm-1 CH2 scissoring; ~1380 cm-1 CH3 bending; 1224 cm-1 P=O stretching vibrations – RNA/DNA; 1085–1030 cm-1 C-O stretching vibrations – carbohydrate; ~990 cm-1 CH3 rocking. [Click here to view] |
3.1.4. Microbiological methods
An initial estimate of bacterial count yielded ca. >2.0 × 10⁶ CFU ml-1g-1 of soil. A mean total bacterial count of 1.34 × 10⁶ CFU ml-1g-1 was recovered from 6 week old root surfaces at the time of our microbiological, molecular, and chemical analyses of the roots. Aliquots of 6 weeks old winter wheat plant roots [Figure 4a] were obtained from the pot trial in which the host received biostimulant bacteria as foliar and root treatments (shown in cartoon Figure 4b). A piece of the root tissue of winter wheat was examined under the light microscope. In this routine root surface microscopic visualization technique, methylene blue dye staining revealed an intense bacterial colonization of the root surface [Figure 4c], and BiotiumR DMAO membrane-permeable DNA dye staining of root surface microtome section fixates revealed live’ bacteria as blue-green fluorescent under the microscope ×100 (visual still and video effects not displayed). An aliquot of root sample was surface sterilized first and then placed on potato dextrose agar yielded emergent presumptive fungi and from infected tissue and bacterial colonies that were adjacent to the fungal colonies in the same plate [Figure 5a]. The plates yielded predominantly carmine red colonies that were presumptively read as Fusarium hyphae obtained from the root tissue (left hand side Petri plates depicted in Figure 5a) and swarms of bacterial colonies surrounding the emergent mycelial hyphae (right hand side Petri plates shown in Figure 5a).
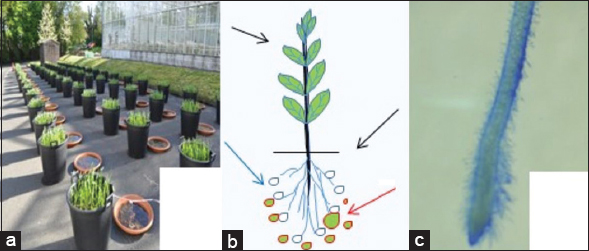 | Figure 4: Pot culture trial evaluation of detection of plant growth promoting biostimulants. Winter wheat grown in outdoor pot trials under ambient local autumnal conditions (a). The crops received bacterial biostimulant (Bacillus subtilis, Burkholderia sp., and Rahnella aquatilis) treatments as root/rhizosphere applications (red or green arrows) illustrated in the cartoon (b) Plant (seaweed) extract (e.g., Algavit) biostimulants and mineral supplements are applied as foliar canopy treatments (black arrow) to all treated and untreated pots. The encircled red zone in (b) highlights an example of the rhizosphere biome of intense bacterial biostimulant interactions broadly categorized as emerging host root zone (EHRZ). Methylene blue dye stained roots viewed under × 20 magnification in a light microscope (c). [Click here to view] |
.png) | Figure 5: Culture plate assay and agarose gel electrophoresis polymerase chain reaction (PCR) analysis of wheat root surface dissection. Culture plating revealed rhizosphere biostimulant bacteria dwelling on fungal hyphae (a). Agarose gel of PCR products amplified using either 18S rDNA universal ITS 1 region primers specific for Fusarium oxysporum and those corresponding to or 16S rDNA universal primers specific for bacteria. Lanes 1, 2, 8, and 9 depict predominantly fungal PCR products. A background low levels of bacterial PCR products occurred in all lanes. Lane 4 and 7 represent multiplex PCR products corresponding to both fungi and the bacteria (b) when fungal hyphae were transferred and re-grown on fresh PDA plates. The biostimulant bacteria were subjected to evaluation of phosphorus solubilzation (c) efficacy to gauge the plant growth promoting activity illustrated as zones of clearance on medium supplemented with tricalcium phosphate [Click here to view] |
3.1.5. Molecular analysis on culture derived colonies or direct tissue extracted samples
≥ Molecular analyses [Figure 5b] were performed on culture derived colonies or direct tissue extracted samples. Using 18S rDNA ITS 1 region universal fungal primers, following gel electrophoresis and sequence BLASTn checks revealed PCR products that corresponding to Fusarium oxysporum wild types naturally occurring in Northern Ireland soils. Using 16S rDNA universal sets of primers, molecular assays on the same sample sets identified the presence of the bacterial biostimulants comprising three Gram-positive bacteria, namely, B. mucilaginosus, B. amyloliquefaciens, and B. subtilis and three Gram negatives Burkholderia sp., R. aquatilis (strain H 2.6), and R. aquatilis (strain RC 2.5) in all the winter wheat rhizosphere samples tested between 6 week old plants. In addition, three specific native bacteria, namely, Pseudomonas fluorescens, Stenotrophomonas maltophilia, and Paenibacillus polymyxa were also detected as rhizosphere soil inhabitants. P-solubilizing capabilities [Figure 5c] of the individual colonies corresponding to the bacterial biostimulants that were confirmed through the molecular assay were evidenced from their zones of clearance seen when assayed on a culture medium supplied with tri-calcium phosphate. A semi-quantitative multiplex PCR assays (data not shown) on the total bacterial cocktail culturable representations (ca. 1.34 × 10⁶ CFU ml-1g-1) recovered from 6 weeks old root surfaces indicated that the six inoculant PGPRs introduced into the soil collectively make up to over roughly ca. 43.76% of the total root surface dominant competitive wheat rhizosphere bacterial colonizers.
3.1.6. Distinction and specificity of six bacterial inoculant biostimulants and their identification achieved through cultural, molecular, and chemical (TGA) approaches
The distinction specificity of six PGPR strains applied to soil and their recovery through microbiological methods and follow-on identification by molecular and chemical methods is summarized in Table 3. In general, the molecular assay using standard polymerase chain reaction techniques offered high specificity of identification of individual bacteria and discrimination within 2 days after sampling directly from roots. Microbiological methods as would be expected needs at least 3–5 days initially for colonies to emerge from culture plate methods. Such putative colonies of individual strains of biostimulant bacteria arising from root surface samples can also be ascertained with a high degree of accuracy for their identity through molecular assays within 1–2 days after the colonies were isolated from culture plates. In the chemical methods applied in this study for strain identification, FT-IR can distinguish either Gram-positive or Gram-negative bacterial strains but did not clearly differentiate strains within the same Gram group sets. On the other hand, TGA MaxRes technique gave distinctive thermal degradation peak pattern fingerprints unique for individual strains of either Gram group sets of bacteria tested. When the TGA MaxRes was used in combination with FT-IR, the individual strain’s cell wall compositional data heightened the specificity of the individual strains of bacteria regardless of their Gram groupings. Furthermore, the TGA MaxRes either as a stand-alone or in tandem with FT-IR facilitated the biostimulant bacterial identification the same day of sampling. Our results [Table 3] on the detection of bacteria in roots demonstrated significant confidence interval variances (Standard Error = P < 0.05) over the variant methods of detection.
Table 3: Distinction specificity of six plant growth promoting rhizobacteria strains by microbiological, molecular and chemical methods
| Type | Bacteria (strain) | Molecular assay | Fourier transform infrared | Thermogravimetric analyses maximum resolution | Combinatorial Fourier transform infrared/thermogravimetric analyses maximum resolution | |
|---|---|---|---|---|---|---|
| Culture Plate Colonies | Direct root tissue | |||||
| Gram positive (G+) | Paenibacillus polymyxa (AFBI) | High specificity to individual strains within the Gram-positive group | Inter specificity to G+ individual strains only | High specificity to individual strains within the Gram positive group | Heightened specificity to distinguish strains | |
| Gram negative (G-) | Burkholderia spp (AFBI) | High specificity to individual strains within the Gram negative group | Inter specificity to individual strains only | High specificity to individual strains within the Gram positive group | Heightened specificity to distinguish strains | |
| Diagnostic results (hours) | 72–120 | 48 | 1 | 2–3 | 4 | |
| Confidence interval variances (standard error) | P<0.05 | P<0.05 | P<0.05 | P<0.05 | P<0.05 | |
3.1.6.1. Statistical scrutiny of three disparate methods comprising chemical, microbiological, and molecular approaches
In this study, we achieved the distinction specificity of six PGPR strains by disparate techniques comprising microbiological, molecular, and chemical methods. Using a universal Student’s t-test on each of the methods, the data indicated that they were statistically very significant (P < 0.05) by themselves. However, bearing in mind, our laboratory methods for detecting bacteria in this study were quite different techniques; the datasets emerging from individual testing measurements can be, therefore, expected to vary not only in unequal replicate numbers but also in the quantitative underlying values in one type of method or the other. To this end, measurement gauge and emergent quantitative (replicate) differences evinced in different laboratory methods, namely, chemical, molecular, and microbiological tools for comparison studies applied for the same target (i.e., detection of bacteria in our present study) are inevitable. To contend with this innate anomaly in our tripartite analyses, using Altman-Bland test and statistically setting a 95% limits of standard error (P ≤ 0.05) confidence intervals, our data provided an agreement of relationship for comparisons of the three variant diagnostic methods for the distinction of the same six inoculant biostimulant bacteria.
3.1.6.2. Precision agriculture model for utilizing the rapid chemical tools for rhizosphere domination of PGPRs
Plant root-soil rhizosphere (Figure 4 illustration B) is a versatile and dynamic ecological environment of intense plant root–microbe interactions for harnessing essential microbiological actors (e.g., introduced PGPR) in the soil. The roots respond dynamically to their specific soil environment by playing an active role in the plant-soil biome. As shown in Figure 4b cartoon, plants are constantly exposed to multiple biotic and abiotic stresses. A key plant adaptation is priming which offers a means to prepare for a future stimuli/stress. Priming is a physiological state triggered by an exposure to a stimulus such as introduced biostimulant PGPR among other stresses from pests, pathogens, chemicals, flood, drought, and cold.
4. DISCUSSION
Our results showed that bacterial cell wall composites’ thermal degradation patterns obtained through TGA MaxRes analyses derived unique structural patterns and group assignations. The thermogravimetric variations in its breakdown components of bacterial cell walls served as extra chemical signature drew marked distinctions between Gram-positive and Gram-negative bacterial cohorts. Furthermore, these chemical spectra have the potential to exploit the different chemical bonding energy profiles. Our sample analytics showed that bonding energy profiling could further heighten the discrimination of wheat root colonizing biostimulant type strains of bacterial PGPR inoculants to potted wheat plants. Current approaches for chemical fingerprinting of bacterial cell wall composition analyses often include expensive tools such as cryogenic X-ray photoelectron spectroscopy [16] and spectral snapshots through NMR [17]. FTIR and pyrolysis gas chromatography mass spectrometry (Py –GC-MS) have been used as cheaper options for cell wall composites fingerprinting and diagnostic tool in microbiology and food safety [18], characterization of cellular composites of algal biostimulants [19], and as successful drug discovery research [20]. TGA and FTIR described in this study are also regarded as versatile combinatorial tools for the identification of food industry and environmental health impacting bacteria Staphylococcus aureus [21], Listeria monocytogenes [22], and Bacillus species [23]. Nevertheless, unlike TGA MaxRes/Py-GC-MS, FTIR has limitations in its efficacy while distinguishing bacterial strains within a given species whose cell walls comprise similar IR functional groups.
Microbial biostimulants (e.g., B. amyloliquefaciens, B. subtilis, Burkholderia sp, Paenibacillus spp, and R. aquatilis) were detected through cultural, molecular (PCR), and chemical methods. These technically disparate methods inevitably carried variances of replicates, standard errors, and linear correlation deviances in the data [24]. Subsequent statistical Altman-Bland estimations validated an agreement in 95% confidence intervals between the three methods for drawing equitable comparisons. The wheat roots’ surface preponderance with the six bacterial biostimulant inoculants was found alongside cocolonizing saprophytic fungi Fusarium spp., and F. oxysporum [25]. This finding is consistent with recent literature [26,27] for plant pathogen biocontrol [28]; and growth promotion effects [29] such as biostimulant bacteria exhibited P-solubilizing capabilities ideal for low P soils, when tested on triphosphate containing growth media. Protocols of PCR and TGA MaxRes Py-GC-MS, and FTIR on bacterial samples are all real-time data. Recently researchers [30], by combining an analytical tool such as matrix-assisted laser desorption ionization time-of-flight MS, they successfully achieved the tracing and detection of two well-characterized PGPR Pseudomonas strains (Pseudomonas fluorescens Pf153 and Pseudomonas sp. DSMZ 13134), in the pot grown maize root and rhizoplane in di-erent soils using a TaqMan-based quantitative PCR (qPCR) assays with a sensitivity of up to 1.4 × 10² CFU and 1.3 × 10⁴ CFU g-1 root fresh weight for the biostimulant inoculant PGPR strains. However, whereas PCR techniques require gene amplification steps, chemical tools cut the need and time to amplify target cellular amplicons. Despite pot grown sample size limitations, our results raise the possibility of utilizing TGA MaxRes Py-GC-MS, FTIR profiling of PGPR bacterial cells on direct root tissues for rapid detection of root predispositions with biostimulants in the plant biome [31].
TGA may provide critical insight into field grown crops and the pre-dispositions to introduced PGPR biostimulant-mediated “priming of plant-soil biome” are increasingly sought nowadays for maximizing precision farming. A fascinating aspect of priming is the associated plant memory, a sensory plant biology described as “Darwinian root brain” hypothesis [1]. Early stage gaining of insight into plant neurobiological information on priming stimulus helps farmers to combat soil and plant environmental challenges efficiently. Automated spectral data of farm management information system interfaced with geographic information system optimizes field logistics [32]. Chemical spectral signatures from TGA Py-GC-MS, FTIR data from this study may be easily transposable into chip-based emergent software architecture of electronic agriculture [33]. Given that, our data further heightens the information-intensive farm management involving biological solutions for plant growth and soil health improvement.
5. CONCLUSIONS
Our proposed thermogravimetric (TGA) led technique yields a thermal weight loss distinctive “fingerprints” representative of Gram-positive and Gram-negative bacterial cell pyrolysis composites. The ensuing unique thermogravimetric spectral signatures have not previously been explored for their potential to identify commercial biostimulant PGPR strains. Combinatorial TGA-MaxRes, FTIR methods that we have described in this study could yield a compendium of information on the same day of sampling on bacterial cell composition, their identity and precise location of biostimulants present in the plant-soil-microbe biomes. Our results on thermogravimetric spectral traces of plant/bacteria cell wall composites could be used as a tool for continuous monitoring and in tandem with more renowned molecular microbiology protocols for virtual imaging of the plant-microbe interactive snapshots in action on a day-to-day basis. Our pot trial study suggests that an intelligent use of analytical tools for gaining foresight of PGPR’s root occupancy may help harness the overarching biostimulant’s efficacy in field sown crops for sustainable precision agriculture practice.
6. ACKNOWLEDGMENTS
We thank EU-BIOFECTOR (Grant Agreement No. 312117) funded by the European Commission within the 7th Framework Programme, and the Department of Agriculture, Environment and Rural Affairs (DAERA), Northern Ireland, UK for their Evidence and Innovation grant (activity 48125) to carry out the study at the Agri-Food & Biosciences Institute laboratories (AFBINI.GOV.UK), Dr C Selby and Professor HSS Sharma for pot culture, sampling facilitations, and Dr D Nelson for the microbiology support.
7. DECLARATIONS
The authors have no conflict of interest to declare. This research work does not contain any studies with human participants or animal involvement in the experiments.
8. AUTHOR CONTRIBUTIONS
All authors made substantial contributions to conception and design, acquisition of data, or analysis and interpretation of data; took part in drafting the article or revising it critically for important intellectual content; agreed to submit to the current journal; gave final approval of the version to be published; and agree to be accountable for all aspects of the work.
REFERENCES
1. Calvo P, Nelson L, Kloepper JW. Agricultural uses of plant biostimulants. Plant Soil 2014;383:3-41. [CrossRef]
2. Sharma HS, Fleming C, Selby C, Rao J, Martin T. Plant biostimulants:A review on the processing of macroalgae and use of extracts for crop management to reduce abiotic and biotic stresses. J Appl Phycol 2014;26:465-90. [CrossRef]
3. Saa S, Rio AO, Castro S, Brown PH. Foliar application of microbial and plant based biostimulants increases growth and potassium uptake in almond (
4. Singh TB, Sahai V, Ali A, Prasad M, Yadav A, Shrivastav P,
5. Nkebiwe PM, Weinmann M, Bar-Tal A, Müller T. Fertilizer placement to improve crop nutrient acquisition and yield:A review and meta-analysis. Field Crops Res 2016;196:389-401. [CrossRef]
6. Borriss R.
7. Borriss R. Towards a new generation of commercial microbial disease control and plant growth promotion products. In:Principles of Plant-microbe Interactions. Berlin, Germany:Springer;2015. 329-37. [CrossRef]
8. Gon~i O, Fort A, Quille P, McKeown PC, Spillane C, O'Connell S. Comparative transcriptome analysis of two
9. Selby C, Carmichael E, Sharma HS. Bio-refining of perennial ryegrass (
10. Thonar C, Lekfeldt JD, Cozzolino V, Kundel D, Kulhánek M, Mosimann C,
11. Shekhar SH, Lyons G, McRoberts C, McCall D, Carmichael E, Andrews F. Brown seaweed species from Strangford Lough:Compositional analyses of seaweed species and biostimulant formulations by rapid instrumental methods. J Appl Phycol 2012;24:1141-57. [CrossRef]
12. Sharma S, Lyons G, McRoberts C, McCall D, Carmichael E, Andrews F,
13. Minerdi D, Moretti M, Gilardi G, Barberio C, Gullino ML, Garibaldi A. Bacterial ectosymbionts and virulence silencing in a
14. Murayama M, Kakinuma Y, Maeda Y, Rao J, Matsuda M, Xu J,
15. Hoffman JI. Linear regression:Comparison problem (advanced), setting standard error confidence intervals using Altman-bland (1999, 2009) estimates. In:Biostatistics for Practitioners:An Interpretative Guide for Medicine and Biology. United States:Academic Press;2015. 451-500. [CrossRef]
16. Ramstedt M, Nakao R, Wai SN, Uhlin BE, Boily JF. Monitoring surface chemical changes in the bacterial cell wall multivariate analysis of cryo-X-ray photoelectron spectroscopy data. J Biol Chem 2011;286:12389-96. [CrossRef]
17. Nygaard R, Romaniuk JA, Rice DM, Cegelski L. Spectral snapshots of bacterial cell-wall composition and the influence of antibiotics by whole-cell NMR. Biophys J 2015;108:1380-9. [CrossRef]
18. Davis R, Mauer L. Fourier transform infrared (FT-IR) spectroscopy:A rapid tool for detection and analysis of foodborne pathogenic
19. Sharma H, Selby C, Carmichael E, McRoberts C, Rao JR, Ambrosino P,
20. Liu R, Li X, Lam KS. Combinatorial chemistry in drug discovery. In:Current Opinion in Chemical Biology. Berlin, Germany:ResearchGate;2017. 117-26. [CrossRef]
21. Lamprell H, Mazerolles G, Kodjo A, Chamba JF, Noël Y, Beuvier E. Discrimination of
22. Janbu AO, MøretrøT, Bertrand D, Kohler A. FT-IR microspectroscopy:A promising method for the rapid identification of
23. Filip Z, Herrmann S, Kubat J. FT-IR spectroscopic characteristics of differently cultivated
24. Ludbrook J. Confidence in Altman-bland plots:A critical review of the method of differences. Clin Exp Pharmacol Physiol 2010;37:143-9. [CrossRef]
25. Nelson D, Beattie K, Mccollum GA, Martin T, Sharma S, Rao J. Performance of natural antagonists and commercial microbiocides towards
26. Moharam MH, Mohamed MD, Mohamed NE.
27. Lounaci L, Guemouri-Athmani S, Boureghda H, Achouak W, Heulin T. Suppression of crown and root rot of wheat by the rhizobacterium
28. Windisch S, Bott S, Ohler MA, Mock HP, Lippmann R, Grosch R,
29. van Overbeek LS, Saikkonen K. Impact of bacterial-fungal interactions on the colonization of the endosphere. Trends Plant Sci 2016;21:230-42. [CrossRef]
30. Mosimann C, Oberhänsli T, Ziegler D, Nassal D, Kandeler E, Boller T,
31. Hardoim PR, van Overbeek LS, Berg G, PirttiläAM, Compant S, Campisano A,
32. Kruize J, Robbemond, Scholten H, Wolfert S, Beulens AJ. Improving arable farm enterprise integration-review of existing technologies and practices from a farmer's perspective. Comput Electron Agric 2013;96:75-89. [CrossRef]
33. NikkiläR, Seilonen I, Koskinen K. Software architecture for farm management information systems in precision agriculture. Comput Electron Agric 2010;70:328-36. [CrossRef]