
1. INTRODUCTION
Water is essential for all organisms on earth and the removal of water from cells represents lethal stress. The structure of intracellular biomolecules and membranes is maintained by water molecules, and thus loss of water leads to an often irreversible aggregation of macromolecules and disintegration of organelles. Desiccation tolerance (DT) is defined as the ability to dry to equilibrium with ambient air and to revive following the loss of all the protoplasmic water when moisture is available [1]. The vegetative tissues of most plants are sensitive to water deficit and cannot persist in the absence of water. However, there are a few species, referred to as “resurrection-plants” that tolerate desiccation to an extent where almost all protoplasmic water is lost, and upon water regains full physiological functionality in existing tissues [2]. These plants can tolerate extremely low water potential without damage and recover from the cessation of metabolic activities and anhydrobiosis [3].
Lower plants such as algae and bryophytes are considered to be “true desiccation-tolerant,” because they possess very few morphological features to retain water and rely on constitutive expression of highly evolved cellular protection through concentration of sucrose, dehydrin, or rehydrin proteins [4]; these plants actively induced various recovery mechanisms [5]. In contrast, larger and more complex desiccation-tolerant plants (e.g., vascular plants) are termed “modified desiccation-tolerant plants,” because they dry slowly, adjust morphologically and physiologically to conserve water and to establish tolerance [6]. These plants rely predominantly on the stress hormone abscisic acid [7] and/or drying induced gene expression changes to initiate cellular protection mechanisms such as accumulation of late embryogenesis abundant proteins [8] and sugars such as sucrose, raffinose, glucose, and trehalose [9].
Among the various types DT, several species rehydrate quickly upon the availability of saturation (minutes to hours, homoiochlorophyllous, where desiccation is constitutive, expressed in lower bryophytes) while others are slow (hours to days, poikilochlorophyllous, desiccation is induced, expressed in higher angiosperms).
Several resurrection plant species have been extensively studied for understanding the molecular and physiological basis of DT: the bryophyte Tortula ruralis, [10] club mosses Selaginella lepidophylla and S. tamariscina, dicots Craterostigma plantagineum, [11] C. wilmsii, [12] Boea hygrometrica, [13] Myrothamnus flabellifolia, [14] the monocots Xerophyta viscosa, X. humilis, and Sporobolus stapfianus [15]. There are at least 1,300 vascular desiccation-tolerant plants, of which 1,000 species are ferns and fern allies and 300 species of angiosperms. These plants have protection mechanisms, which include changes in metabolism associated with dehydration and rehydration process [16,17], physiological and biochemical networking [18] which influence the ability to tolerate desiccation.
Pteridophyte species like Selaginella are more moderate (hours) in terms of rehydration and employ both constitutive and induced mechanisms which are more beneficial for stable and durable expression of DT [19].
Further anti-oxidant mechanisms involving various enzymes also play an important role in unraveling tolerance to desiccation. Many studies have been carried out on both true and modified desiccation-tolerant plants which would lead to a comprehensive understanding of the mechanism of DT.
However, Pteridophytes like Selaginella do not follow either of the two modules for survival and follow a more moderate approach of rehydration (hours) that induce both constitutive mechanism as well as rehydration and therefore a clear understanding of the mechanism of establishment of DT in Selaginella as well as other Pteridophytes is essential to establish the DT phenotype in Pteridophytes. Therefore, in this study, we have chosen Adiantum raddianum (AR) as a non-Selaginella Pteridophyte to study its putative DT properties and also report parallel physiological responses of AR during various stages of water loss and gain.
2. MATERIALS AND METHODS
2.1. Collection and Identification of AR
An extensive literature and also field survey were conducted to collect non-Selaginella Pteridophytes. In this study, we choose AR and further collected the Adiantum during July (monsoon) and November (non-monsoon) months of 2017.
Adiantum and its species were identified based on the following morphological features:
Types of rhizome, types and length of pinnae and size, color, and morphology.
Adiantum growing naturally on rocks in Devarayanadurga State forest of Tumakuru District, Karnataka, India at Coordinates 13.3707° N, 77.1773° E were selected for the study. The collected samples were brought to the lab in sterile polythene bags and were maintained under greenhouse conditions for experimental purpose.
All the chemicals were procured from Sigma Aldrich except where mentioned.
2.2. Relative Water Content (RWC) Analysis
The plants of homogeneous age; the similar size of their aerial parts and collected from the same habitat were used for this study.
The stages of water loss and gain were classified as below:
- Hydrated fronds (HF): The young and healthy fronds of AR plants were detached and allowed to hydrate in a Petri dish (150 mm × 20 mm Size) with double distilled water, till it reached saturation and no further weight gain.
- Desiccated fronds (DFs): The HF tissues were allowed to desiccate (air dry) to lose water under room temperature until no further weight loss occurred.
- Rehydrated fronds (RFs): Furthermore, the DF tissues were later rehydrated in a Petri dish (similar dimensions as mentioned above) with double distilled water for rewetting till no further weight gain. The light conditions were similar for all three sets of tissues. All three samples were treated the same way for all experimental purposes. Further HF, DF, and RF tissues were ground using liquid nitrogen and stored at −80°C for the physiological analysis. The RWC as percentage in the samples was calculated as the difference between fresh weight and dry weight divided by the fresh weight [43]. RWC was expressed in percentage.
2.3. Chlorophyll and Carotenoid Measurements
0.5 g of HF, DF, and RF tissues of AR were weighed and frozen using liquid nitrogen and homogenized. From the homogenized samples, chlorophyll was extracted using 10 ml of 80% acetone. The test tubes (Borosil) were incubated in room temperature overnight covered with aluminum foil, then the crude extract was centrifuged at 3,000 g for 5 minutes using Centrifuge 5400R (Eppendorf, CA) and the supernatant was collected while the pellet was discarded. The absorbance of the supernatant was read at 663.6 nm, 646.6 nm, and 440.5 nm by using BioSpectrometer Kinetic (Eppendorf, CA), as they are the major absorption peaks of chlorophylls a, b, and carotenoids, respectively. The total chlorophyll (Chl a + b) contents were calculated using extinction coefficients provided by Porra et al. [20]. The chlorophyll and carotenoid concentrations were then expressed on the basis of μg chl/g dry sample (μg g–1).
2.4. Quantification of Superoxide Radical (O2−)
1 g fronds of HF, DF, and RF of AR were extracted with 100 mM potassium phosphate buffer pH 7.2 (2 ml). To the reaction mixture, 500 μl of 2 mM nitro blue tetrazolium (NBT) was added and the incubation was continued for 20 more minutes. The reaction was stopped by the addition of 2 ml of 1.4-dioxan. The tubes were heated in water bath at 70°C for 15 minutes, cooled, and centrifuged at 2,000 rpm using Centrifuge 5400R (Eppendorf, CA) for 10 minutes to allow the cells to settle and the absorbance of the supernatant was measured at 540 nm using BioSpectrometer Kinetic (Eppendorf, CA). Superoxide was determined according to [21]. Quantity of superoxide radical was expressed as μmol/g FW.
2.5. Determination of Soluble Sugar and Starch
The frozen AR samples of HF, DF, and RF were ground in a mortar with ice-cold 1 M perchloric Acid (HClO4), the extract was centrifuged at 12,000 g (Eppendorf, CA), for 2 minutes at 4°C–8°C. The supernatant was neutralized with 5 M Potassium carbonate (K2CO3) and precipitated potassium perchlorate (KClO4) was removed by centrifugation. The supernatant was kept on ice and used for the estimation of sucrose, while the pellet was used for the determination of starch. Sucrose and starch were estimated enzymatically according to the method given by Pandey et al. [22]. Sucrose and starch content were expressed as μmol/G FW.
2.6. Proline Estimation
Free proline accumulation in AR, HF, DF, and RF was determined using the method of Li et al. [23]. The 0.04 g frozen AR sample was homogenized with 3% sulfosalicylic acid and after 72 hours, proline released was measured. The homogenate was centrifuged at 3,000 g (Eppendorf, CA) for 20 minutes. The supernatant was treated with acetic acid ninhydrin, boiled for 1 hour, and then absorbance at 520 nm was determined using BioSpectrometer Kinetic (Eppendorf, CA). Contents of proline were expressed as mg g−1 dw−1.
2.7. Estimation of Lipid Peroxidation
Lipid peroxidation was estimated depending on the intermediate metabolite malondialdehyde (MDA), using 2-thiobarbituric acid (TBA) as described by Li et al. [23]. 0.2 g of the tissues (HF, DF, and RF) were extracted using 2 ml of 0.25% TBA made in 10% Trichloroacetic acid. Extract was heated in a boiling water bath at 95°C for 30 minutes then cooled suddenly. The samples were centrifuged at 10,000 g (Eppendorf, CA) for 10 minutes. The supernatant was collected and the absorbance was read at 532 and 600 nm using BioSpectrometer Kinetic (Eppendorf, CA), further by subtracting the absorbance value taken at 600 nm, correction of non-specific turbidity was carried out. The lipid peroxidation level was expressed in n mol g−1 FW of MDA calculated using an extinction coefficient of 155 mM cm−1.
2.8. Analysis of Antioxidant Enzymes
The antioxidant enzymes activity superoxide dismutase (SOD), peroxidase (POD), catalase (CAT), and glutathione reductase (GR) were determined in HF, DF, and RF of AR. The frozen tissues were grounded separately in 6 ml of extraction buffer-1 [50 mM phosphate buffered saline (PBS), pH 7.8 for assay of SOD and CAT] and 6 ml extraction buffer-2 (100 mM PBS, pH 7.0 for assay of POD and GR) at 4°C. The homogenates were collected and centrifuged at 15,000 g (Eppendorf, CA) at 4°C for 20 minutes. The ability to inhibit the photochemical reduction of NBT was used as control to determine SOD. A 6 ml reaction solution of SOD consisted of 50 mM PBS (pH 7.8), 130 mM methionine, 750 μM NBT chloride, 100 μM EDTA-Na2+, 20 μM riboflavin, and 0.1 ml of enzyme extract. The reaction solution was incubated for 10 minutes under fluorescent light with an intensity of 50 μmol m−2 s−1 for 20 minutes. The absorbance was determined at 560 nm. One unit of SOD activity was defined as the amount of enzyme required to inhibit the photochemical reduction of NBT by 50% and expressed in Units mg−1 protein.
CAT activity was assayed by measuring the initial rate of disappearance of H2O2 by the technique described by Change and Maethly [24] The decline in absorbance at A240 was recorded by BioSpectrometer Kinetic (Eppendorf, CA), and the activity was expressed as the number of μ mol of H2O2 catalyzed by a unit of CAT per min and was expressed in units/mg protein. POD activity was analyzed using a modified method of Rao et al. [25]. The reaction solution contained 100 mM PBS (pH 7.0), 50 mM o-methoxyphenol, 40 mM H2O2, and 0.1 ml of enzyme extract and was expressed in μmol min−1 g−1 protein.
GR activity was determined according to the method described by Halliwell and Foyer [26]. The reaction solution consisted of 50 mM Tris-HCl, 0.5 mM Glutathione disulfide, 5 mM MgCl2, and 0.2 mM nicotinamide adenine dinucleotide phosphate hydrogen (NADPH). GR activity was determined at 340 nm, within 3 minutes and expressed as the number of μmol of NADPH oxidization and was expressed in Units mg−1 protein.
2.9. Statistical Analysis
Data obtained were subjected to a one-way analysis of variance. Significant differences among the test groups (p ≤ 0.05) were obtained by Tukey’s honestly significant difference post hoc test using SPSS software (SPSS20.0, SPSS Inc., Chicago IL). Values shown in the Figures are the means ± standard errors (SEs) of three independent replicates.
3. RESULTS AND DISCUSSION
3.1. Collection and Identification of AR
The following field morphological features were used to identify Adiantum species. Short-creeping and irregularly branched rhizome up to 50 mm long and 2 mm wide. The rhizome and the bases of the frond stalks were covered with dark brown scales of less than 1 mm length. Fronds were arched to erect, 10–50 cm long and 6–20 cm wide, and triangular in shape. Frond stalks and axes were dark reddish-brown to blackish and shining. The frond stalk was longer than the lamina. Laminas were 3–4-pinnately divided, with the ultimate segments delicate, herbaceous, and up to 1 cm wide. Ultimate segments are wedge-shaped and have slender red-black stalks. (Fig. 1)
3.2. Relative Water Content
RWC of AR was estimated in detached fronds in HF, DF, and RF stages in three independent experiments under laboratory conditions and photos were captured at all three stages using a digital camera (Nikon D3300 Digital single-lens reflex camera). The original total water content being at 100%, the weight before the water loss was 0.377 g. After 4 hours of water loss of the detached frond by air dry, the weight was found to be 0.059 g and after rehydration, the weight was 0.291 g. Therefore, the percentage of RWC after 4 hours of desiccation and rehydration was found to be 16% and 85.33%, respectively. The difference in the percentage of RWC in HF, DF, and RF reveals that AR exhibits typical resurrection traits [27] (Fig. 2).
3.3. Chlorophyll Pigment Content
Photosynthetic activities of the ferns and fern-allies are reported to decline following dehydration [28]. From our study, it can be noted that there is a significant difference in Chl a and chl b among hydrated, desiccated, and rehydrated states. The concentrations of Chl a and chl b decreased during desiccation from 15.12 μg g–1 to 10.20 μg g–1 of chlorophyll a and 2.25 μg g–1 to 1.172 μg g–1 of chlorophyll b, respectively. Upon rehydration, chlorophyll a and chlorophyll b concentration gradually increased and returned to almost similar levels of HF, i.e., 14.81 μg g–1 and 2.19 μg g–1. Our results imply a significant difference in chlorophyll. The same pattern was observed in chlorophyll b, where the difference between the hydrated fern to desiccated was 64.15% in and upon recovery difference was 2% in rehydrated fern. Our results show that during desiccation, the chlorophyll loss was 38%. However, AR regains its most of chlorophyll. Since there is no complete loss of chlorophyll and AR can be homoiochlorophyllous in nature (Fig. 3).
 | Figure 1: AR growing naturally on rocks in Devarayanadurga State forest of Tumakuru District of Coordinates 13.3707° N, 77.1773° E. [Click here to view] |
3.4. Superoxide Radical
Superoxide concentrations were expressed as n mol/g fresh weight and were estimated in HF, DF, and RF tissues of AR. Increase in superoxide concentration was evident during the desiccation phase, the concentration of superoxide radical in HF was 6.53 n mol/gm FW, which increased in the DF to the concentration as 10.13 n mol/g FW which was 43.21% more than HF. However, in the RF, it decreased to 5.3 n mol/g FW, which was 20% lower than HF. Increased rate of superoxide radical level in DF of AR suggests that oxidative stress which leads to the release of superoxide radical occurred due to desiccation (Fig. 4A).
3.5. Soluble Starch and Sugars
Some studies suggest that desiccation-tolerant ferns protect their membrane during dehydration by accumulating sugars such as sucrose and members of the raffinose family of oligosaccharides [29]. Sucrose content was expressed as μmol/g FW and it decreases in the desiccated and RFs. Sucrose content in HF, DF, and RF fronds was found to be 32.9 49.38, and 39.46 μmol/g FW, respectively, i.e., around 40.5% and 8.13% increase, respectively, in DF and RF. The starch concentration was found to be 79.31, 23.26, and 43.3 μmol/g FW which corresponds to 86% (DF) and 58% (RF), respectively, when compared to control (HFs). In this study, starch content decreases and sucrose content increased in DF of AR, it is therefore evident that the principle carbohydrate in the fern is broken down during desiccation. Also, increased sucrose concentration helps in maintaining the protein integrity. (Fig. 4B and C) during the period of severe water loss.
3.6. Proline Accumulation
 | Figure 2: Morphological changes of AR detached fronds in A. HF B. DF, and C. RF. [Click here to view] |
Accumulation of amino acids has been observed in many studies on plants exposed to desiccation stress [30] Proline is an osmolyte, a reactive oxygen species (ROS) scavenger, and a molecular chaperone stabilizing the structure of proteins, thereby protecting the cells from damage occurring due to stress. Proline levels in HF, DF, and RF fronds of AR were expressed in terms of μ mol/g FW. It was clearly evident that the proline levels increased significantly during Desiccation. In hydrated stage, it was found to be 1.48 μ mol/g FW and in DF it increased to 2.01 μ mol/g FW and during rehydration, it almost regained its original level, i.e., 1.80 μ mol/g FW, the percentage increase in DF was 30.37% and in RF was 19.5% compared to HF. The results obtained showed a significant increase in the proline concentration during desiccation which probably indicates the vital role of proline in physiological specificity during DT (Fig. 5A).
.png) | Figure 3: Chlorophyll a/b in AR in HF, DF, and RF stages. Error bars represent SE within the test group (p ≤ 0.05), obtained from three replicates. [Click here to view] |
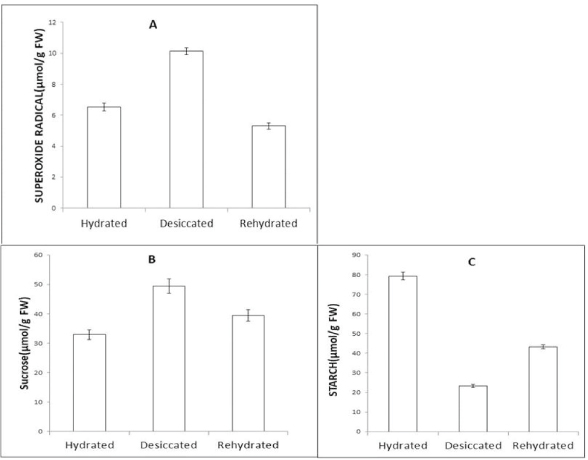 | Figure 4: Changes in the level of (A) Superoxide Radical (O2−), (B) Starch, (C) Sucrose in HF, DF, and RF tissues of AR. Error bars represent SE within the test group (p ≤ 0.05) obtained from three replicates. [Click here to view] |
3.7. Lipid Peroxidation
The main cellular components susceptible to damage by free radicals are lipids (peroxidation of unsaturated fatty acids in membranes). Lipid peroxidation indicates the oxidative stress in response to desiccation which will result in damage to membranes and inactivation of enzymes, i.e., resulting in loss of cell viability [31]. Lipid peroxidation in AR was estimated as reactive metabolites of 2-TBA mainly MDA. In HF, it was found to be 0.68 n mol g−1 FW and 2.31 n mol g−1 FW in DF, indicating a drastic increase thus indicating a major role in cellular damage during abiotic stress. Furthermore, it reduced to 0.85 n mol g−1 FW in RF (21% more compared to HF) as a resultant of the recovery process. The results indicate significant damage was caused to the membrane integrity due to desiccation stress (Fig. 5B).
3.8. Activity of Antioxidant Enzymes
Plant oxidative stress is a complex physiological phenomenon. It develops as a consequence of overproduction of ROS. ROS includes the singlet oxygen (1O2), superoxide (O2–), hydrogen peroxide (H2O2), and hydroxyl radical (HO). The generation of ROS in plants due to desiccation could be lethal. Antioxidant mechanisms are generated during the stressful conditions to eliminate the excessive oxidative stress.
The activities of four antioxidant enzymes were analyzed in HF, DF, and RF stages of AR SOD, POD, CAT, GR, which are the part of the plant antioxidation system that counteracts free radical stress.
Several studies suggest that the activities of antioxidative enzymes vary with species. In Selaginella species such as S. tamariscina [7] and S. bryopteris [32], high enzyme activities of CAT, SOD, and GR were induced by dehydration. However, in Mohria caffrorum [25] and Dicranopteris linearis [33], enzyme activities of CAT, SOD, and GR and POD activity were high under dehydrated and hydrated conditions.
Concentration of SOD in AR fronds increased from 3.905 Units mg−1 protein in HF to 5.25 Units mg−1 protein in DF and upon rehydration; in RF, it was found to be 4.20 Units mg−1 protein. The percentage increase in DF was 29.3% and 7.2% in RF when compared to HF (Fig. 6A).
The POD concentration in HF of AR was 0.0424 μmol min−1 g−1 protein which increases in DF to 0.101 μmol min−1 g−1 protein in DT an increase of 81.7%. Thereafter, in RF, it was 0.087 μmol min−1 g−1 protein, an increase of 54.4% when compared to control (HF) (Fig. 6B).
The GR activity of AR was found to be 410.98 Units mg−1 protein in HF which increased to 625.96 Units mg−1 protein in DF an increase of 41.4% and marginally reaching HF to 549.05 Units mg−1 protein in RF around 28.7% increase as compared to HF. (Fig. 6C).
The CAT activity in AR also increased in DF, the trend was similar to other antioxidant enzymes tested. In HF, it was found to be 0.57 units/mg protein which increased to 0.76 units/mg protein which accounts to an increase of 28.5% in DF, and in RF, it was at 0.626 units/mg protein which was 9.36% increase as compared to HF (Fig. 6D).
The results obtained clearly shows an increase in all the four antioxidant enzymes that are activated in response to the damage caused due to extreme water deficit/desiccation which leads to oxidative stress that has a deleterious effect on the physiology and also the survival of the fern.
4. DISCUSSION
Desiccation induces considerable stress for the plant to survive. Resurrection plants have developed strategies to minimize the impact of stress during desiccation to avoid damages. In order to survive in different microclimatic environments, plants must limit damage, maintain cellular integrity, and activate repair mechanisms. Similar studies have been carried out in Selaginella species, namely, S. bryopetris [22] and S. tamariscina [34] and non Selaginella species like Hymenophyllacea filmy ferns [35] and Adiantum labifolium [36].
AR upon desiccation also showed a drastic reduction of RWC from 80% to 30% and 31% after 24, 48, and 72 hours after desiccation. The quick nature of the response to desiccation in Pteridophytes like AR is because Pteridophytes gain water in their cells through ectohydric and endohydric movements and also regulated strongly by the environment and therefore less physiological mechanisms; therefore, some Pteridophyte species demonstrate quick recovery and some show moderate recovery.
 | Figure 5: (A) Concentration of proline and (B) MDA in HF, DF, and RF stages of AR. Error bars represent SE within the test group (p ≤ 0.05), obtained from three replicates. [Click here to view] |
Decrease in chlorophyll content of leaves is thought to be linked to the protection of plants against ultraviolet light and from damage as a result of oxygen free radical generation during desiccation [37]. In our study, chlorophyll concentrations of AR were more or less equal during all the three stages. Chlorophyll a/b content in AR did not decrease too much in desiccated stage indicating that no complete dismantling of photosynthetic apparatus took place in HF. However, the chlorophyll content in desiccated was lower than the control suggesting degradation probably occurred but was not severe. It must be noted, however, that the total chlorophyll in DF was only 10% lesser in desiccation state, indicating that stress did not completely affect the photosynthesis.
 | Figure 6: Specific activity of (A) SOD (B) POD (C) GR (D) CAT in HF, DF, and RF stages of AR. All the four antioxidant enzymes increased in DF compared to HF and minimized in RF. Error bars represent SE within the test group (p ≤ 0.05), obtained from three replicates. [Click here to view] |
Oxidative stress is known as one of the most deleterious consequences of water deficit in plants [38]. The results obtained from our study indicated that anti-oxidation mechanisms have been triggered and support the hypothesis that the desiccation damage to the plants was mainly caused by oxidative stress, in terms of ROS accumulation. Plant oxidative stress is a complex physiological phenomenon. It develops as a result of the overproduction of ROSs. ROS includes the singlet oxygen (1O2), superoxide (O2–), hydrogen peroxide (H2O2), and hydroxyl radical (HO). The generation of ROS in plants is triggered by desiccation. To eliminate excessive oxidative stress, antioxidant mechanisms are active during stressful conditions. In the absence of ROS scavenging systems, ROS accumulation inhibits proteins, nucleic acids [39], and lipids, which form lipid hydroperoxides that damage the integrity of the membranes [40] and eventually lead to the death of the affected plant [41]. Furthermore, we have observed the concentration of soluble sugars increased at the same time decrease in starch concentration was also observed. Sugars protect the cells during desiccation by maintaining hydrophilic interactions in proteins and membranes by substituting water from Hydroxyl groups of sugars. Hence, through hydrogen bonding, sugars interact with proteins and membrane; by this way prevent denaturation of the protein. The results from our studies showed a drastic increase in the proline concentration during desiccation which probably indicates its role in DT. The studies have showed that in desiccated S. tamariscina, 15.0% increase in proline content was noted in desiccated compared to hydrate stage and in rehydrated stage, proline content was lower relative to the desiccated stage [42]. Similarly, the results obtained here validate the role of proline during desiccation as shown in its increase during stress and its decrease when the plant was hydrated. Proline is considered to act as an osmolyte, a ROS scavenger, and a molecular chaperone stabilizing the structure of proteins, thereby protecting cells from damage caused by stress. Thus, the ability of resurrection fern to survive in varying environmental conditions is dependent on various physiological adaptations to ensure cellular protection during desiccation.
5. CONCLUSION
The in vitro hydration, desiccation, and rehydration experiment demonstrated the ability of the species to recover from desiccation stress and provide the basic physiological adaptation that helps to explain DT in ferns. The results obtained in this study demonstrate that desiccation stress in AR generated an oxidative stress condition, leading to morphological and biochemical changes. The activation of different biochemical mechanisms helps in mitigating the desiccation stress as expressed by this species.
AUTHORS’ CONTRIBUTIONS
All authors contributed equally to the study.
ACKNOWLEDGMENTS
The authors would like to thank IFCPRA for funding support.
ABBREVIATIONS
DT, Desiccation-tolerance; AR, Adiantum raddianum; RWC, Relative water content; SOD, Superoxide dismutase; POD, Peroxidase; CAT, Catalase; GR, Glutathione reductase; HF, Hydrated fronds; Df, Desiccated fronds; RF, Rehydrated fronds; FW, Resh weight; NBT, nitro blue tetrazolium; HClO4, perchloric acid; K2CO3, Potassium carbonate; KClO, potassium perchlorate; MDA, malondialdehyde; TBA, 2-thiobarbituric acid; H2O2, hydrogen peroxide; NADPH, nicotinamide adenine dinucleotide phosphate hydrogen; ROS, Reactive oxygen species; 1O2, Oxygen; O2–, Superoxide; HO, Hydroxyl radical
CONFLICT OF INTERESTS
The authors declare that they have no conflicts of interest.
REFERENCES
1. Proctor MCF, Pence VC. Vegetative tissues bryophytes vascular resurrection plants and vegetative propagules in desiccation and survival in plants drying without dying. CAB International press, Wallingford, UK, pp 207–37, 2002. CrossRef
2. Farrant JM. Mechanisms of desiccation tolerance in angiosperm resurrection plants. Plant Desiccation Tolerance. CAB International press, Wallingford, UK, pp 51–90, 2007. CrossRef
3. Hoekstra F, Golovina E, Buitink J. Mechanisms of plant desiccation tolerance. Trends Plant Sci 2001;(6):431–8. CrossRef
4. Proctor M, Oliver M, Wood A, Alpert P, Stark L, Cleavitt N, et al. Desiccation tolerance in bryophytes: a review. Bryologist 2007;110:595–621. CrossRef
5. Oliver MJ, Dowd S, Zaragoza J, Mauget S, Payton P, The rehydration transcriptome of the desiccation tolerant bryophyte Tortula ruralis: transcript classification and analysis. BMC Genomics 2004;5:89. CrossRef
6. Toldi O, Tuba Z, Scott P. Vegetative desiccation tolerance: is it a goldmine for bioengineering crops. Plant Sci 2009;176:187–99. CrossRef
7. Wang X, Chen S, Zhang H, Shi L, Cao F, Guo L, et al. Desiccation tolerance mechanism in resurrection fern-ally Selaginella tamariscina revealed by physiological and proteomic analysis. J Proteome 2010;9:6561–77. CrossRef
8. Ma C, Wang H, Macnish A, Estrada-Melo A, Lin J, Chang Y, et al. Transcriptomic analysis reveals numerous diverse protein kinases and transcription factors involved in desiccation tolerance in the resurrection plant.myroyhamus flabellifolia. Horticult Res 2015;2:15034. CrossRef
9. Williams B, Njaci I, Moghaddam L, Long H, Dickman M, Zhang X, et al. Trehalose accumulation triggers autophagy during plant desiccation. PLoS Genet 2015;11(12):e1005705. CrossRef
10. Ingram J, Bartels,D. The molecular basis of dehydration tolerance in plants. Annu Rev Plant Physiol Plant Mol Biol 1996;47:377–403. CrossRef
11. Alpert P, Oliver MJ. Drying without dying. Desiccation and survival in plants: drying without dying. CAB International press, Wallingford, UK, pp 3–43, 2002. CrossRef
12. Moore JP, Tuan Le N, Brandt WF, Driouich A, Farrant JM. Towards a systems-based understanding of plant desiccation tolerance. Trends Plant Sci 2009;14:110–7. CrossRef
13. Cushman JC, Oliver MJ. Understanding vegetative desiccation tolerance using integrated Functional genomics approaches within a comparative evolutionary framework. In ecological studies: Plant desiccation tolerance. Springer, Berlin, Heidelberg, pp 307–38, 2011. CrossRef
14. Oliver MJ, Jain R, Balbuena TS, Agrawal G, Gasulla F, Thelen JJ. Proteome analysis of leaves of the desiccation tolerant grass, Sporobolus stapfianus, in response to dehydration. Phytochemistry 2011;72:1273–84. CrossRef
15. Oliver MJ, Guo L, Alexander D, Ryals J, Wone B, Cushman J. A sister group metabolomic contrast using untargeted global metabolomics analysis delineates the biochemical regulation underlying desiccation tolerance in Sporobolus stapfianus. Plant Cell 2011;23:1231–48. CrossRef
16. Alpert P. Constraints of tolerance why are desiccation-tolerant organisms so small or rare? J Exp Biol 2006;209:1575–84. CrossRef
17. Suguiyama V, Silva E, Meirelles S, Centeno D, Braga M. Leaf metabolite profile of the brazilian resurrection plant Barbacenia purpurea Hook. (velloziaceae) shows two time-dependent responses during desiccation and recovering. Front Plant Sci 2014;5:96. CrossRef
18. Kranner I, Beckett R, Wornik S, Zorn M, Pfeifhofer H. Revival of a resurrection plant correlates with its antioxidant status. Plant J 2002;31:13–24. CrossRef
19. Neeragunda Shivaraj Y, Barbara P, Gugi B, Vicré-Gibouin M, Driouich A, Ramasandra Govind S, et al. Perspectives on structural, physiological, cellular, and molecular responses to desiccation in resurrection plants. Hindawi Scientifica 2018; https://doi.org/10.1155/2018/9464592 CrossRef
20. Porra RJ, Thompson WA, Kriedemann PE. Determination of accurate extinction coefficients and simultaneous equations for assaying chlorophylls a and b extracted with four different solvents: Verification of the concentration of chlorophyll standards by atomic absorption spectroscopy. Biochim Biophys Acta (BBA)-Bioenergetics 1989;975(3):384–94. CrossRef
21. Fontana, LM, Rosei MA. Interaction of enkephalins with oxyradicals. Biochem Pharm 2001;61 (10):1253–7. CrossRef
22. Pandey V, Ranjan S, Deeba F, Pandey AK, Singh R, Shirke PA, et al. Desiccation-induced physiological and biochemical changes in resurrection plant, Selaginella bryopteris. J Plant Physiol 2010;167(16):1351–9. CrossRef
23. Li HS, Sun Q, Zhao SJ, Zhang WH. In Principles and Techniques of Plant Physiological Biochemical Experiment. Higher Education Press Beijing, China, 2000.
24. Change B, Maethly AC. Assay of catalases and peroxidase. Methods Enzymol 1995;2:764–75. CrossRef
25. Rao MV, Hale BA, Ormrod DP. Amelioration of ozone-induced oxidative damage in wheat plants grown under high carbon dioxide. Plant Physiol 1995;109:421–32. CrossRef
26. Halliwell B, Foyer CH. Properties and physiological function of a glutathione reductase purified from spinach leaves by affinity chromatography. Planta 1978;139:9–17. CrossRef
27. Plancot B, Gügi B, Mollet JC, Loutelier-Bourhis C, Ramasandra Govind S, Lerouge P, et al. Desiccation tolerance in plants: Structural characterization of the cell wall hemicellulosic polysaccharides in three Selaginella species. Carbohydr Polym 2018; https://doi.org/10.1016/j.carbpol.2018.12.051 CrossRef
28. Farrant J, Lehner A, Cooper K, Wiswedel S. Desiccation tolerance in the vegetative tissues of the fern Mohria caffrorum is seasonally regulated. Plant J 2009;57:65–79. CrossRef
29. Rabert C, Hödar M, Bravo L, Quiroz A, Urzua A. A rapid preparative-TLC/GC-MS methodology for discriminating between two filmy ferns (Hymenophyllaceae) native from the temperate rain forest of Southern Chile based on their soluble carbohydrates. Blacpma 2015;14:364–73.
30. Widodo JH, Patterson EN, Mark T. Metabolic responses to salt stress of barley (Hordeum vulgare L.) cultivars, Sahara and Clipper, which differ in salinity tolerance. J Exp Bot 2009;60:4089–103. CrossRef
31. Mittler R. Oxidative stress, antioxidants and stress tolerance. Trends Plant Sci 2002;7:405–10. CrossRef
32. Deeba F, Pandey V, Pathre U, Kanojiya S. Proteome analysis of detached fronds from a resurrection plant Selaginella bryopteris- response to dehydration and rehydration. J Proteom Bioinf 2009;2:108–16. CrossRef
33. Kavitha C, Murugan K. Dissimilitude response of peroxidases of Dicranopteris linearis (Burm.F.) Underw. against desiccation and rehydration stress. ISOR J Biotechnol Biochem 2016;2:36–41.
34. Liu MS, Chien CT, Lin TP. Constitutive components and induced gene expression are involved in the desiccation tolerance of Selaginella tamariscina. Plant Cell Physiol 2008;49:653–663. CrossRef
35. Cea MG, Clavero S, Castillo CA, Pinilla CR, Ramírez LB. Desiccation tolerance of Hymenophyllacea filmy ferns is mediated by constitutive and non-inducible cellular mechanisms. Plant Biol Pathol 2014;337:235–43. CrossRef
36. Lubaina AS, Brijithlal ND, K Murugan. Unravelling desiccation and rehydration tolerance mechanism in the fern, Adiantum latifolium. Biosci Biotechnol Res Commun 2016;9(4):672–9. CrossRef
37. Sherwin HW, Farrant JM. Protection mechanisms against excess light in the resurrection plants Craterostigma wilmsii and Xerophyta viscosa. Plant Growth Regul 1998;24:203–10. CrossRef
38. Mundree SG, Whittaker A, Thomson JA, Farrant JM. An aldose reductase homolog from the resurrection plant Xerophyta viscosa Baker. Planta 2000;211:693–700. CrossRef
39. Osakabe Y, Osakabe K, Shinozaki K, Tran LS. Response of plants to water stress. Front Plant Sci 2014;5:86. CrossRef
40. Gigon A, Matos AR, Laffray D, Zuily-Fodil Y, Pham-Thi AT. Effect of drought stress on lipid metabolism in the leaves of Arabidopsis thaliana (ecotype Columbia). Ann Bot 2004;94:345–51. CrossRef
41. Sharma S, Villamor JG, Verslues PE. Essential role of tissue-specific proline synthesis and catabolism in growth and redox balance at low water potential. Plant Physiol 2011;157:292–304. CrossRef
42. Agduma AR, Sese MD. Cellular biochemical changes in Selaginella tamariscina (Beauv.) Spring and Sellaginella plana (Desv. ex Poir.) Heiron. as induced by desiccation. Trop Life Sci Res 2016; 27(2):37–52. CrossRef
43. Plancot B, Gügi B, Mollet J, Loutelier-Bourhis C, Govind SR, Lerouge P, et al. Desiccation tolerance in plants: structural characterization of the cell wall hemicellulosic polysaccharides in three Selaginella species. Carbohydr Polym 2019;208:180–90. CrossRef