
1. INTRODUCTION
Chickens (Gallus gallus) are broadly distributed around the world. The origin of chickens indicating that red jungle fowl was the direct ancestor of the chicken as suggested by the comparison of morphology and progeny production between species of Gallus [1].
In Thailand, chickens were bred as meat and egg types. Examples of the meat types are Kai-Tor and White-Tail Yellow Chicken (WTYC). Kai-Tor is a hybrid of red jungle fowl and native chicken breed which is very close to the origin of chicken. In addition, commercial layer hen (HL) is the example of stable egg type breed. However, the genetic potential of all chicken breeds has not been revealed extensively. Generally, morphological traits such as the earlobe, plumage color, feathering pattern etc. have been used to characterize the local chickens. A study using genetic variation was limited. DNA barcoding is a new technique for species identification. The genes most commonly used for species identification are cytochrome c oxidase I (COI) and Cytochrome b (cyt b) [2]. To date, it has also been reported that the mitochondrial DNA (mtDNA) gene hyper-variable displacement loop (D-loop) can be used as a DNA barcoding. MtDNA D-loop sequences have been successfully used to determine phylogenetic relationships, genetic distance and describe variation in wild ancestors and domesticated breeds in serval species such as cattle [3], goat [4], and horse [5]. In chicken, D-loop sequences have also been used to reveal the genetic diversity of Japanese native chicken [6], Indonesian indigenous chicken breed [7] and China native chicken [8].
Recently, modern techniques for determination of phylogenetic relationship and genetic variation have been developed. Identification of potential biomarkers is important for the determination of different chicken breeds. Several attempts have been made to identify the potential peptidome biomarkers in different chicken breeds. However, limited data on peptidome biomarkers are available. Identification and characterization of proteins and subsequent analysis of their functions are the initial step in better understanding the classification of genetic variation of different chicken breeds. Highly complex protein mixtures can be analyzed for proteomic purposes by liquid chromatography coupled with tandem mass spectrometry (LC−MS/MS).
This research aimed to determine the variations using a morphological trait, genetic diversity of D-loop barcodes, identifying protein profiles using proteomic with LC/MS-MS. This is to confirm the genetic diversity and relationship of three types of different chicken breeds (Kai-TOR, WTYC, and HL) found in Thailand.
2. MATERIALS AND METHODS
2.1. Sampling and data collection
Three major adult male chicken breeds (G. gallus) including HL, Kai-Tor, and WTYC (Figure 1) were gathered from the farms in Phitsanulok province, Thailand. Total of 150 chickens (50 of each breed) were used for the morphological study. Thirty samples were available for genetic analysis. In addition, a single putative sample in each chicken breed was selected for protein identification and characterization. Chicken blood was collected by bleeding from the wing vein venipuncture using a sterile syringe and kept in blood collection tubes, then stored at 4°C. Blood samples (1 mL) were mixed with 0.5 mL anticoagulant solution [Ethylene Diamine Tetraacetic Acid; (EDTA)] and then used for genetic analysis. For proteomic analysis, blood samples (1.5 mL) without anticoagulant solution were used. Blood samples were allowed to clot at 37°C for 2 hrs prior to serum collection. Serums were separated by low-speed centrifugation and then kept at -80°C until used.
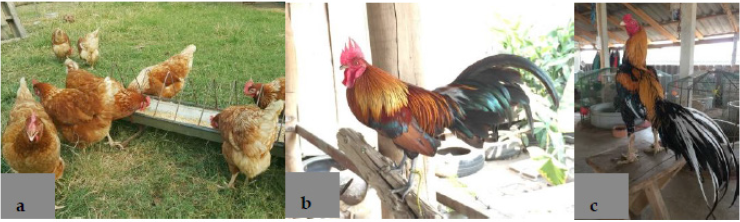 | Figure 1: Three different adult chicken breeds. (a) Commercial layer hen (HL); (b) Hybrid red jungle fowl with native chicken breed (Kai-Tor) and (c) White tail yellow chicken (WTYC). [Click here to view] |
2.2. Selection of morphological characters for a phenetic relationship
Based on the numeric taxonomic study, 18 qualitative morphological characters (Table 1) were chosen and measured for each of the 50 specimen samples. All characters were converted into binary states and multi-states (interval) code. Neighbor-joining (NJ) tree [9] was employed for cluster analysis; correlation coefficients served as a measurement of the similarity between each Operational Taxonomic Unit (OUT)-pair. The character states scored and analyzed as binary characteristics (0-1). The formation of groups was depending on the values of similarity. All computations were carried out using the NTSYS-pc version 2.02e program [10].
 | Table 1: Morphological characters, state and code of G. gallus under observation. [Click here to view] |
2.3. Genetic analysis using mtDNA sequences
2.3.1. DNA extraction, amplification, and sequencing
The genomic DNA from each individual whole blood samples (30 individuals in total) was extracted using QIAamp® DNA Blood Mini Kit (Qiagen, Germantown, MD, US; #51104) according to the manufacturer’s instructions. The yields of total DNA were measured using spectrophotometer with the absorption at 260/280 nm. A 648 bp fragment of the partial mitochondrial DNA (partial D-loop, tRNA-phe, and partial 12s ribosomal RNA) was amplified by PCR using a primer pair, forward (bar2 5′- TCA AGT GAA GCC TGG ACT AC-3′) and reverse primers (bar2 5′- TGC GGA TAC TTG CAT GTA TAT-3′) [8]. Each PCR reaction was performed using a final volume of 20 μL containing 13.44 μL of sterile ultrapure water, 2.0 μL of 10X buffer, 1.0 μL of 1.8 mM MgCl2, 0.8 units of Taq polymerase (0.76 μL), 0.4 μL (0.2 mM) of each primer and 2.0 μL of DNA template. The optimized PCR amplification program was composed of 3 min at 94 °C followed by 35 cycles of 40 s at 94°C, 30 s at 52°C and 45 s at 72°C, and 45 s at 72°C, and finally 5 min at 72°C. PCR products were visualized under UV light following electrophoresis on an ethidium bromide stained 1% agarose gel. Each PCR product was purified using GeneJET PCR purification and gel extraction kit (Thermo scientific Inc, USA) according to the manufacturer’s instructions and directly sent to Macrogen Inc., Seoul, Korea for sequencing (http://www/macrogen.com).
2.3.2. Sequences alignment, genetic and diversity indices
Similarity search for each partial mtDNA sequence was verified using BLAST (https://www.ncbi.nlm.nih.gov/). Then all sequences were initially aligned and edited using MEGA7.0 program [11]. All mtDNA sequences were finally trimmed to 648 base pairs and deposited in GenBank under accession numbers MH366541- MH366570 Afterwards, The extents of genetic variation were determined as the average number of nucleotide difference (k), number of haplotypes (No.), haplotype diversity (hd), nucleotide diversity (Pi) and Tajima’s D test by using DnaSP version 5.10.01 program [12].
2.4. Proteomic analysis using LC-MS/MS technique
Serums were isolated using a 10 KDa cut off column (Pall Corporation, NY, USA). Serum samples (200 μL) were loaded into and separated from the column by centrifugation at 7,000g for 30 min. The separated serums were concentrated using a vacuum concentrator and treated with buffer I (10 mM each of dithiothreitol and ammonium bicarbonate) and buffer II (100 mM iodoacetamide and 10 mM ammonium bicarbonate) for carbamidomethyl reaction at room temperature. The reaction was terminated by the addition of buffer I. Finally, serum was digested with trypsin (10 ng trypsin in 50% acetonitrile and 10 mM ammonium bicarbonate) through an overnight incubation at room temperature and samples were injected into LC-MS/MS. The data obtained from LC-MS/MS were determined using DeCyder MSTM (Amersham Bioscience AB, Uppsala, Sweden) and MASCOT (http://www.matrixscience.com) programs. Gene ontology and signaling pathways were detected using STRAP (Vivek Bhatia, Boston University School of Medicine) and PANTHER (http://www.pantherdb.org) in accordance with the instructions of Mi et al. [13]. The metabolic, regulatory and biosynthesis of secondary metabolites pathways were analyzed using ipath (http://pathways.embl.ed/iPath2.cgi) according to recommendations of Yamada et al. [14]. Lastly, all chicken serums were investigated to identify the potential biomarkers.
3. RESULTS AND DISCUSSIONS
3.1. Morphological characters for a phenetic relationship
From the morphological data, NTSYS-pc program clearly suggested that two major clades namely, Kai-Tor clade (A) and HL clade (B) were obviously seen. Meanwhile, the group of WTYC was clearly classified as an outgroup (Figure 2). Herein, it was revealed that the Kai-Tor group (clade A) is found to be correlated with HL group (clade B) at 15.04% similarity level. Perversely, the chicken breeds in clades A + B were distinctively separated from outgroup with only 1.47% of similarity coefficient. Additionally, in terms of the coefficient of similarity within chicken breeds, it was somewhat fair. The similarity within a breed was 41.80% in HL. While the similarity within Kai-Tor ranged from 16.50-45.00% similarity. Interestingly, the coefficient held moderate values in HL. It might be stated that some phenotypic variations still existed among the population. In contrast, there were numerous variations in terms of external morphological traits of Kai-Tor breed resulted in the diversified sub-clades within this clade. Although the use of qualitative traits alone could cluster the variety of chicken in this study, quantitative features concerning morphometries should be further conducted. Moreover, the use of the numerical technique to evaluate the taxonomic status among species in the genus, Gallus, i.e. G. gallus, G. lafavettei and G. sonneratii should be carried out in the future.
 | Figure 2: Dendrogram showing the clustering of three chicken breeds based on qualitative morphological trait using the NJ method. [Click here to view] |
3.2. mtDNA sequence analysis
The total of 648 bp of mtDNA control region fragments after removing the primers used for the PCR amplification were successfully sequenced from G. gallus samples. Nucleotide composition of mtDNA was detected to be A = 30.6%, T = 34.1%, C = 22.8% and G = 12.5%. Sub-consequently, the transition/transversion rate ratios were k1 = 27.834 (purines) and k2 = 0 (pyrimidines). The overall transition/transversion bias was R = 4.331, where R = [A × G × k1 + T × C × k2]/[(A + G) × (T + C)]. Like the mtDNA gene of other chickens, all PCR products of mtDNA of G. gallus from all collecting sites were high A + T content (average of 64.7%), computed from the total amounts of nucleotides in the obtained sequences. Three chicken breeds (Kai-Tor, HL and WTYC) exhibited variation in overall frequency distribution of nucleotides 1st, 2nd and 3rd codon positions with the following proportions; A = (28.7, 28.7 and 28.7%), (30.1, 30.1 and 30.1%) and (33.1, 32.9 and 32.9%); C = (23.1, 23.1 and 23.1%), (21.3, 21.3 and 21.3%) and (24.1, 24.1 and 24.1%); G = (12.0, 12.0 and 12.0%), (11.6, 11.6 and 11.6%) and (13.7, 13.9 and 13.9%) and T = (36.1, 36.1 and 36.1%), (37.0, 37.0 and 37.0%) and (29.2, 29.2 and 29.1%). Nonetheless, the overall frequency distributions of nucleotides at the 1st, 2nd and 3rd codon positions were as follows: A = 28.7%, 30.1% and 33.0%; C = 23.1%, 21.3% and 24.1%; G = 12.0%, 11.6% and 13.8% and T = 36.1%, 37.0% and 29.2%, respectively (data not shown). Herein, the A + T nucleotide bias reported in the animal mitochondrial genome [15] was also found in the G. gallus mtDNA sequences, as also detected from former investigation on chickens [16].
3.3. Genetic diversity
Three mtDNA-haplotypes of G. gallus populations were detected in this study (Table 2). Based on the variable sites of the bar2 haplotype, only two polymorphic (segregating) sites (S) were encountered in which they were considered as A/T transversions (S, 81 in Kai-Tor, 363 in WTYC) (data not shown). In terms of Hd which inferred from mtDNA sequences (partial D-loop, tRNA-phe and partial 12s ribosomal RNA), it valued 0.343 ± 0.097 and ranging from 0.000-0.545. The Pi of all samples for mtDNA sequences was 0.00057, ranging from 0.0000-0.00088. The average number of k or nucleotide differences from mtDNA gene sequences was 0.354. For all three varieties of chicken, Tajima’s D statistics for neutrality test was not significant (p > 0.05). Samples from HL possessed the lowest nucleotide diversity (0.0000), while samples from Kai-Tor had the highest nucleotide diversity (0.00088) (Table 2). In addition, the haplotypes in both Kai-Tor and WTYC were shared with HL, indicating that these chicken strains had a similar hereditary. It has been reported [17] that Thai indigenous Leung-hang-khao chicken could be used for comparing with WTYC in our present investigation. The values based on the averaged haplotype and nucleotide diversities from the former study were about 0.8179 and 0.00563. However, this research found relatively lower genetic diversity than those reported previously [17] because of a limited number of WTYC used in this study.
 | Table 2: Statistics information of mtDNA1 barcode in 3 different chicken breeds. [Click here to view] |
According to Cui et al. [8], two main sequences of the mtDNA gene of Chinese indigenous breeds were analyzed for genetic diversity using bar1 and bar2 as primers. Bar1 of all chicken breeds exhibited two haplotypes, one of which was merely observed in Lingnan yellow broilers, which could provide a basis for various identifications, whereas the other one was seen in all chicken breeds. On the other hand, in bar2, the total of four polymorphic sites and eight haplotypes were also recorded. It was revealed that Pi in both bar1 and bar2 sequences of mtDNA valued 0.00006 (0.00000-0.00006) and 0.00328 (0.00102 to 0.00305) respectively. In the same manner, the bar1 sequence of mtDNA had lower polymorphism compared to bar2 as seen in this analysis. It has been speculated that the mtDNA gene was an effective tool because the DNA taxonomic study of bar2 corresponded to morphological traits in four native chicken breeds as reported elsewhere [8]. Hence, the use of bar2 as a primer for DNA barcoding to identify indigenous chicken breeds was a better choice.
In addition, Yushi et al. [18] also applied two sequences (bar1 and bar2) as DNA barcoding in identifying six Chinese native chicken breeds. It illustrated that the bar1 sequence was worth to identify these chicken breeds. The results disclosed that the bar1 sequence of mtDNA exhibited high polymorphism and had 24 SNPs and 24 haplotypes, 22 of which were specific for six chicken breeds. Meanwhile, the analysis of bar2 sequences has demonstrated that they were low polymorphism and contained 5 SNPs, 5 haplotypes and no special site in most chicken breeds. They suggested that the bar1 sequence should be better adopted for analysis of genetic variation among chicken population [18].
3.4. Serum peptides
Total peptides obtained from LC-MS/MS analysis. All MS/MS spectra were searched through protein databases. The same proteins (820 peptides) were found in all serum samples. While the total peptides of 833, 833 and 828 were identified in Kai-Tor, WTYC, and HL respectively.
In addition, Figure 3 represented properties of the identified proteins. It was classified that proteins were related to cellular process proteins (26%), metabolic process (21%), biological regulation (12%), response to stimulus (9%), developmental process (9%), localization (6%), biogenesis (6%), multicellular organismal process (5%), locomotion (2%), reproduction (2%), biological adhesion (1%), immune system process (1%), growth (0.5%) and rhythmic process (0.2%).
 | Figure 3: A pie chart showing the functional categories of serum peptide of G. gallus that matched proteins in public databases. [Click here to view] |
 | Figure 4: Identification of potential biomarkers from serum peptidome of HL = Commercial layer hen, Kai-Tor = Hybrid red jungle fowl with the native chicken breed, WTYC = White tail yellow chicken. [Click here to view] |
3.5. Identification of potential biomarkers from serum peptidome
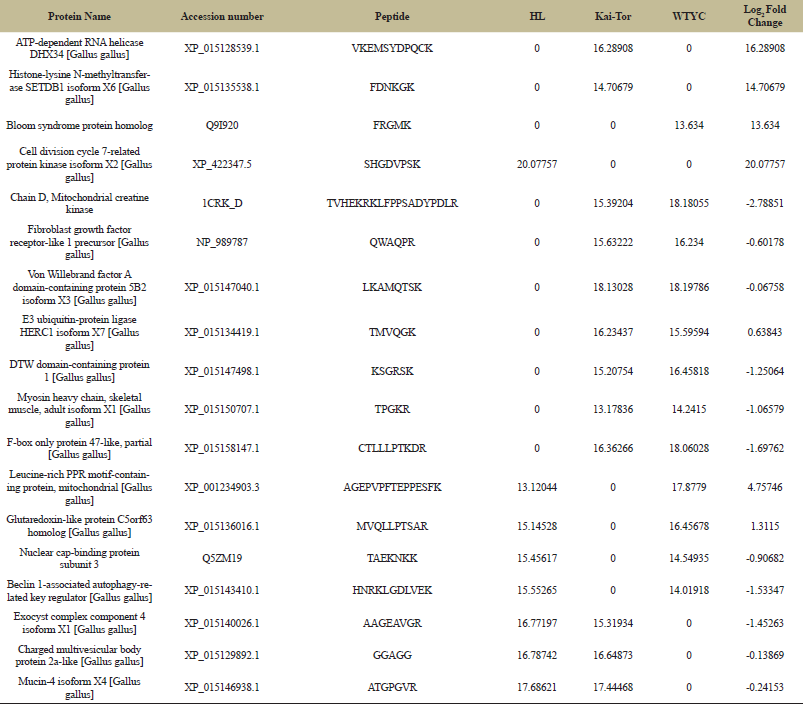
Figure 4 shows the potential biomarkers from serum peptidome. Total 833 peptides, two peptides namely Histone-lysine N-methyltransferase SETDB1 isoform X6 (SETDB1; Accessions number: XP_015135538) and ATP-dependent RNA helicase DHX34 (DHX34; Accessions number: XP_015128539.1) were detected in serum samples of the Kai-Tor, but not in HL and WTYC. Only one peptide was specifically detected in serum samples of HL but not in Kai-Tor and WTYC. This included cell division cycle 7-related protein kinase isoform X2 (G. gallus) (CDC7; Accessions number: XP_422347). Finally, one peptide namely bloom syndrome protein homolog (RecQ helicase homolog) (BLM; Accessions number: Q9I920) (UniProtID No. Q91920.2) was specifically detected in serum samples of WTYC but not in Kai-Tor and HL.
 | Table 3: Identified protein from three different chicken breeds. [Click here to view] |
Moreover, Table 3 represents the protein profile expression levels. Protein names which were identified to be significantly up-regulated or down-regulated by proteomic experiment were shown in this table. The analysis focused on proteins at least ± 2 folds in different chicken breeds compared with the Kai-Tor breed. The relative abundances of peptides were expressed as log2 intensities. Refers to Table 3, seven peptide namely 1) chain D, mitochondrial creatin kinase (CRKD; Accession number: 1CRK_D), 2) fibroblast growth factor receptor-like 1 precursor (FGFRL1; Accession number: NP_989787), 3) Von Willebrand factor A domain-containing protein 5B2 isoform X3 (VWF; Accession number: XP_015147040.1), 4) E3 ubiquitin-protein ligase HERC1 isoform X7 (HERC1; Accession number: XP_015134419.1), 5) DTW domain-containing protein 1 (DTWD1; Accession number: XP_015147498.1), 6) myosin heavy chain, skeletal muscle, adult isoform X1 (MYH3; Accession number; XP_015150707.1) and 7) F-box only protein 47-like, partial (FBX047; Accession number;:XP_015158147.1) were specifically detected in serum samples of Kai-Tor and WTYC. The protein profiles expression values of these proteins in WTYC were higher than Kai-Tor approximately 2.78851, 0.60178, 0.06758, 1.25064, 1.06579 and 1.69762 folds, respectively. While the protein profiles expression values of E3 ubiquitin-protein ligase HERC1 isoform X7 (Accession number; XP_015134419.1) in WTYC were lower than Kai-Tor approximately 0.63843 fold. FGFRL1 plays a major role in binding to FGF and this protein may affect the endochondral ossification which involves a cartilage intermediate [19]. In addition, myosin heavy chain is involved the skeletal muscle. Toydemir et al. [20] revealed that MYH3 mutations interfere with myosin’s catalytic activity. These results added to the growing body of evidence showing that congenital contractures are a shared outcome of prenatal defects in myofiber force production. Accordingly, the higher level of protein profiles expression of these proteins in WTYC inferred to morphology difference in other species. Two peptides namely 1) leucine-rich PPR motif-containing protein, mitochondrial (LRPPRC; Accession number: XP_001234903.3) and 2) glutaredoxin-like protein C5orf63 (C5orf63; Accession number: XP_015136016.1) were detected in serum samples of WTYC and HL. The protein profiles expressions of these proteins in HL were lower than WTYC approximately 4.75746 and 1.3115 fold. Three peptides namely 1) exocyst complex component 4 isoform X1 (EXOC4; Accession number: XP_015140026.1), 2) charged multivesicular body protein 2a-like (CHMP2A; Accession number: XP_015129892.1) and 3) mucin-4 isoform X4 (MUC4; Accession number: XP_015146938.1) were found in serum samples of Kai-Tor and HL. The protein profiles expressions of these proteins in HL were higher than Kai-Tor approximately 1.45263, 0.13869 and 0.24153 folds. MUC4 plays an important role in cell proliferation and differentiation of epithelial cells by inducing specific phosphorylation of ERBB2. The formation of MUC4 complex leads to repressing of apoptosis and stimulation of cell proliferation [21]. Research in this area should be further conducted.
4. CONCLUSION
Phenetic, genetic, proteomic studies of various breeds of G. gallus were evaluated. Based on morphological data, they can be clearly distinguished into two major clades namely Kai-Tor (clade A) and HL (clade B). While WTYC was classified as out-group. Kai-Tor and HL are related. Meanwhile, WTYC was distinctly separated from the other clades. For genetic diversity, mtDNA sequences were successfully used to develop the phylogenetic tree that showed monophyletic clusters. In terms of protein identification and characterization, this study successfully identified proteins from different chicken breeds using LC-MS/MS techniques. All identified proteins could be the potential biomarkers of chicken breeds.
5. ACKNOWLEDGMENTS
This research was financially supported by Pibulsongkram Rajabhat University (PSRU) Grant No. RDI-4-61-11. Appreciation is extended to the Science Center of PSRU for providing facilities and laboratory supports. Many thanks to Mr. Adam Richard Dalton of International Institute of Pibulsongkam Rajabhat University for his editing assistance and advice on English expression in this document.
6. REFERENCES
1. Darwin C. The variation of animals and plants under domestication. 1st ed. London, UK: John Murray; 1868.
2. Hebert PD, Cywinska A, Shelley LB, Jeremy R. Biological identifications through DNA Barcodes. Proc R Soc Lond B Biol Sci 2003; 270:313-321.
3. Loftus RT, MacHugh DE, Bradley DG, Sharp PM, Cunningham P. Evidence for two independent domestications of cattle. Proc Natl Acad Sci USA 1994; 91:2757-2761.
4. Luikart G, Gielly L, Excoffier L, Vigne JD, Bouvet J, Taberlet P. Multiple maternal origins and weak phylogeographic structure in domestic goats. Proc Natl Acad Sci USA 2001; 98:5927-5932.
5. Jansen T, Forster P, Levine MA, Oelke H, Hurles M, Renfrew C, Olek K. Mitochondrial DNA and the origins of the domestic horse. Proc Natl Acad Sci USA 2002; 99:10905-10910.
6. Komiyama T, Ikeo K, Gojobori T. The evolutionary origin of long-crowing chicken: its evolutionary relationship with fighting cocks disclosed by the mtDNA sequence analysis. Gene 2004; 333:91-99.
7. Sulandari S, Zein MSA, Sartika T. Molecular characterization of Indonesian Indigenous chickens based on Mitochondrial DNA Displacement (D)-loop Sequences. HAYATI J Biosci 2008; 15:145-154.
8. Cui H, Ibtisham F, Xu C, Huang H, Su Y. DNA barcoding of Chinese native chicken breeds through COI gene. Thai J Vet Med 2017; 47:123-129.
9. Patil P, Sutar S, Malik SK, John J, Yadav S, Bhat KV. Numerical taxonomy of Abelmoschus Medik. (Malvaceae) in India. Bangladesh J. Plant Taxon 2015; 22:87-98.
10. Rohlf FJ. NTSYS-PC: Numerical taxonomy and multivariate analysis system version 2.02e. New York: Exeter Software; 1997.
11. Kumar S, Stecher G, Tamura K. MEGA7: Molecular evolutionary genetics analysis version 7.0 for bigger datasets. Mol Biol Evol 2016; 33:1870-1874.
12. Librado P, Rozas J. DnaSP v5: a software for comprehensive analysis of DNA polymorphism data. Bioinformatics 2009; 25:1451-1452.
13. Mi H, Muruganujan A, Casagrande JT, Thomas PD. Large-scale gene function analysis with the PANTHER classification system. Nat Protoc 2013; 8:1551-1566.
14. Yamada T, Letunic I, Okuda S, Kanehisa M, Bork P. iPath2. 0: interactive pathway explorer. Nucleic Acids Res 2011; 39:412-415.
15. Boore JL. Animal mitochondrial genomes. Nucleic Acids Res 1999; 27:1767-1780.
16. Huang XH, Li GM, Chen X, Wu YJ, Li WN, Zhong FS, Wang WZ, Ding ZL. Identification of a novel mtDNA lineage B3 in chicken (Gallus gallus domesticus). Zool Res 2017; 38:208-210.
17. Teinlek P, Siripattarapravat K, Tirawattanawanich C. Genetic diversity analysis of Thai indigenous chickens based on complete sequences of mitochondrial DNA D-loop region. Asian-Australas J Anim Sci 2018; 31:804-811.
18. Yushi G, Yunjie T, Haibing T, Kehua W, Kuanwei C, Rong G. DNA Barcoding application of mtDNA gene in Identifying Six indigenous chicken breeds in China. J Agric Biol 2007; 15:924-930.
19. Trueb B, Zhuang L, Taeschler S, Wiedemann M. Characterization of FGFRL1, a novel fibroblast growth factor (FGF) receptor preferentially expressed in skeletal tissues. J Biol Chem 2003; 278:33857-33865.
20. Toydemir RM, Rutherford A, Whitby FG, Jorde LB, Carey JC, Bamshad MJ. Mutations in embryonic myosin heavy chain (MYH3) cause Freeman-Sheldon syndrome and Sheldon-Hall syndrome. Nature Genetics 2006; 38:561.
21. Carraway KL, Perez A, Idris N, Jepson S, Arango M, Komatsu M, Carraway CAC. Muc4/sialomucin complex, the intramembrane Er6B2 ligand, in cancer and epithelia: to protect and to survive. Prog Nucleic Acid Res Mol Biol 2002; 71:149-185.