
1. INTRODUCTION
Phycocyanin, a pigment of considerable interest across diverse domains, has garnered attention for its potential applications, particularly in the pharmaceutical and medicinal sectors. Extensive research has been conducted on its anticarcinogenic attributes, capacity to stimulate cell proliferation, induction of apoptosis in cancer cells, and antioxidative properties. The pigment is prevalently found in cyanobacteria, red algae, and Cryptophyte [1]. Investigations into its production primarily focus on Arthrospira platensis or Spirulina platensis, renowned sources of protein-rich food additives and cosmetics [2,3]. Moreover, phycocyanin has been explored for its viability as a food colorant, with reported potential utilization in a dairy beverage containing a prototype phycobiliprotein [3]. Phycocyanin’s unique fluorescence properties have revolutionized biomedical research methodologies. This pigment-protein complex is a crucial fluorescent probe in histochemistry for tissue visualization, flow cytometry for cell analysis, and fluorescence-activated cell sorting for precise cellular isolation. Additionally, its application in fluorescence immunoassays significantly enhances molecular detection sensitivity. These diverse applications underscore phycocyanin’s pivotal role in advancing both diagnostic accuracy and research capabilities in the biomedical field [4]. Nevertheless, the quantification of phycocyanin content in a given sample is subject to diverse factors, encompassing the growth conditions of the organism, extraction methodologies, and preservation techniques [5,6].
Environmental conditions are crucial in shaping cyanobacteria’s growth and influencing phycocyanin production. Growth conditions, including light exposure, photoperiod, temperature, and pH, exert discernible effects on phycocyanin content. Light quality profoundly impacts cyanobacterial photosynthesis due to their specialized pigments. Manipulating light spectral composition can optimize growth rates, biomass production, and metabolite synthesis in cyanobacteria, offering significant implications for biotechnological applications and environmental management strategies [7]. Cyanobacteria possess pigments that selectively absorb light at specific wavelengths; for instance, chlorophyll efficiently absorbs red and blue light. Literature reviews indicate that the ratio of blue to red light can impact growth, the carbohydrate-to-protein ratio, and the photosynthetic response, reflecting the involvement of specific pigments and photoreceptors in capturing these wavelengths [8]. Cyanobacterial species exhibit heterogeneous photophysiological adaptations, resulting in diverse responses to light parameters. These species-specific light tolerance and utilization efficiency variations manifest in differential growth kinetics and biomass productivity. Such photo-adaptive traits offer selective advantages in varying light regimes [7]. The pH is a crucial determinant that significantly influences cyanobacterial growth and metabolic processes. The culture medium’s pH profoundly influences cyanobacterial physiology and biochemical reactions. Different cyanobacterial species exhibit varying pH optima for growth and metabolism, with a generally narrow pH range within which optimal conditions prevail. Deviations from the optimal pH range can lead to diminished growth rates or, in extreme cases, cell death [2,7]. For instance, Synechocystis sp. thrives at pH 10.0 [2], while Anabaena NCCU-9 shows viability in highly alkaline environments [9]. The pH tolerance spectrum among cyanobacteria ranges from species with broad adaptability to those specialized for specific pH niches, reflecting the diversity of their ecological adaptations [7]. Recent studies have delved into the impact of different light colors on phycocyanin production [10–13]. Notably, research has demonstrated that red light positively influences both phycocyanin concentration and cell biomass. In contrast, blue light detrimentally affects growth due to deficiencies in the chlorophyll performance of cyanobacteria [14]. Beyond light conditions, factors such as thermal stability and pH ranges play a crucial role in influencing the preservation and production of phycocyanin. Researchers have explored the effects of varying pH values and thermal conditions on the stability of phycocyanin production [15,16].
Cyanobacteria, commonly referred to as blue-green algae, are photosynthetic bacteria crucial for oxygen production. They utilize carbon dioxide as a carbon source, harnessing light energy through photochemical processes to sustain their vital functions. Within the cyanobacterial genus Limnothrix, a filamentous cyanobacterium classified under the Pseudanabaenaceae family [14,16], numerous strains have been utilized in research to investigate the antioxidant activities and nutraceutical properties associated with the phycocyanin pigment [2,15]. Despite the acknowledged potential of Limnothrix to yield biomass and valuable pigments like phycocyanin, limited attention has been devoted to optimizing the cyanobacteria Limnothrix. Our investigation delves into the assessment of biomass, photosynthetic efficiency, and phycocyanin content of Limnothrix planctonica (Wo?oszy?ska) Meffert 1988 (KU.B3) across varying pH conditions and light colors to explore its potential for industrial-scale production.
2. MATERIALS AND METHODS
2.1. General Chemicals and Materials
The chemicals used in this study were purchased from various sources as follows. BG-11 medium: NaNO3 (Kemaus, Australia), K2HPO4·3H2O (Ajax Finechem, Australia), CaCl2·2H2O (Ajax Finechem, Australia), Citric acid (HOC(COOH)(CH2COOH)2·2H2O) (Ajax Finechem, Australia), Ethylenediamine tetra acetic acid (EDTA; Ajax Finechem, Australia), MgSO4·7H2O (Merck, Germany), and Ferric ammonium citrate green (C6H8O7·Fe3·NH3; Carlo Erba Reagents, France). For the trace elements: H3BO3 (Ajax Finechem, Australia), MnCl2·4H2O (Carlo Erba Reagents, France), ZnSO4·7H2O (Ajax Finechem, Australia), NaMoO4·2H2O (Ajax Finechem, Australia), CuSO4·5H2O (Ajax Finechem, Australia), and Co(NO3)2·6H2O (Ajax Finechem, Australia). Dimethyl sulfoxide (99% DMSO; Fisher Scientific, UK). The phosphate buffer included K2HPO4 (Ajax Finechem, Australia), and KH2PO4 (Merck, Germany). Spectrophotometric determination was performed using a UV-visible spectrophotometer (Shimadzu, Japan). The centrifuge was performed using a Centrifuge 5430 (Eppendorf, USA). Chlorophyll fluorescence was performed using a pulse amplitude modulation (PAM) with a suspension cuvette (Mini MR, Model: us-2500, Germany) equipped with a magnetic stirrer and fiber optic holder (Mks-2500, Germany). DNA extraction was performed using Nucleospin® Plant II Kit (Macherey-Nagal Gmbh & Co., KG)
2.2. Cyanobacterial Strain
A strain of unbranching filamentous cyanobacteria, identified as L. planctonica (KU.B3), was isolated from Nonthaburi, Thailand’s vegetable plant drainage system, and observed under the light microscope (Fig. 1). The strain shares intrinsic morphological characteristics with Geitlerinema and Phormidium species. Cyanobacterial DNA was extracted using the Nucleospin® Plant II Kit and stored at −20°C. The 16S rRNA gene was amplified via polymerase chain reaction (PCR) using primers CYA106F (5′- CGGACGGGTGAGTAACGCGTGA -3′) [17] and CYAN738R (5′- GCTAGGACTACWGGGGTAT -3′) [18]. PCR mixtures contained the DNA template and primers at 5 mM concentration. Nucleotide sequencing was performed as described by Sanger et al. [19]. However, isolates of this strain have been genetically matched to Limnothrix planctonica (Wo?oszy?ska) Meffert 1988 with 98% similarity, using 16s rRNA gene sequencing analysis. The strain was cultured in BG-11 liquid media under cool-white fluorescent lamps with an intensity ranging from 20 to 30 μmol photon m−2 s−1. The cultivation occurred within a 12:12 hours dark/light period, facilitated by an airflow system, and maintained at room temperature (25°C).
2.3. Light Colors and pH Variations of Culturing
Cells at the early stationary phase of L. planctonica (KU.B3) were transferred to liquid BG11 with an initial cell density of 0.1 at 750 nm for experiments involving light colors and pH variations during culturing. The dark/light periods were maintained on a 12:12 hours cycle. The study consisted of two sequential experiments. Initially, pH optimization was conducted by adjusting medium acidity to 6.0, 7.4 (control), 8.0, 9.0, and 10.0 using 1 N HCl or 1 N NaOH. These cultures were maintained under cool-white fluorescent lamps (20–30 μmol photon m−2 s−1) in triplicate. Subsequently, the optimal pH condition identified from this experiment was utilized to assess light quality effects on cyanobacterial growth and physiology. The culture conditions were configured with a light intensity of 70 μmol photon m−2 s−1, utilizing 4 different LED light sources: red (580–640 nm), orange (530–700 nm), blue (430–470 nm), and white LED light mixed with red light (400–700 nm).
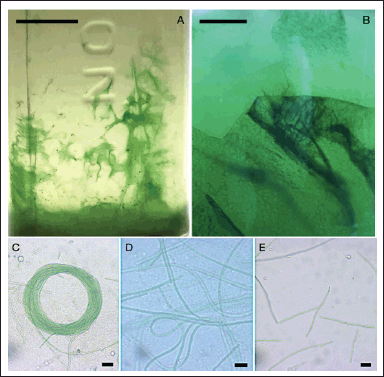 | Figure 1. Morphological of L. planctonica (KU.B3). (A-B) The strain cultured in BG11 media (scale bar = 1 cm). (C-E) Filament characteristics. (C, E scale bar = 20 μm, and D scale bar = 10 μm). [Click here to view] |
2.4. Determination of Phycocyanin, Chlorophyll a, and Growth Rate
2.4.1. Phycocyanin content
The determination of phycocyanin content in L. planctonica (KU.B3) was conducted every other day (n = 9) throughout the experimental period. A 5 ml aliquot of the sample was collected and centrifuged at 3,000 rpm for 5 minutes (Eppendorf 5430, Germany). The pellet was resuspended in 5 ml of 0.1 M phosphate buffer (pH 7.2) and thoroughly mixed using a vortex mixer. Subsequently, the crude extract underwent two freeze-thawing cycles, incubating at −20°C for 24 hours (Hitachi R-V380PZ) and then thawing at room temperature. The freeze-thawed crude extract was centrifuged at 5,000 rpm (Eppendorf 5702R) for 10 minutes. The supernatant obtained was then assessed for absorbance at 620 nm (A620) and 652 nm (A652), from which the phycocyanin yield (Yield PC) content was calculated using the following equations [20]:
PC concentration (mg ml−1) = [A620 – (0.474×A652)]/5.34
Yield PC (mg g−1 dry weight) = (PC × V)/?DB
Here, V (ml) represents the volume of the sample, and DB (g) corresponds to the dry weight of the samples.
2.4.2. Chlorophyll a content
A 5 ml sample (n = 9) was collected and centrifuged at 3,000 rpm for 5 minutes. The pellet was added with 5 ml of 99% DMSO (Fisher Chemical) in a 1:1 ratio and maintained at 4°C for 30 minutes for extraction. Subsequently, the extraction was centrifuged at 5,000 rpm for 5 minutes, and the supernatant was measured at the absorbance of 666 nm (A666). Determining chlorophyll a content was performed using the following equation [21].
Chlorophyll a (μg ml−1) = 11.1362 × A666.
2.4.3. Growth rate
The specific growth rate, μ (d−1), (n = 9) was determined by utilization of the chlorophyll a content during the exponential phase, with x0 and xi representing chlorophyll a content at times (days) t0 and ti, respectively. The maximum specific growth rate (μmax) was calculated using the following equation [22]:
μmax (d−1) = ln (xi / x0)/ti − t0
2.5. Photosynthetic Efficiency Measurement
The photosynthetic efficiency of L. planctonica (KU.B3) was assessed under variable light and pH conditions. The biological replicates of n = 72 for pH variations and n = 81 for light qualities. The cell culture was subsequently adapted to darkness for 30 minutes. Following this dark adaptation, a 1 ml sample of the cells was utilized for recording with a PAM to estimate chlorophyll fluorescence. This recording process was carried out using a suspension cuvette (Mini MR, Model: us-2500, Germany) and a magnetic stirrer equipped with a fiber optic holder (Mks-2500, Germany). The PAM setup included a light intensity of 9 and 4 gains [23]. The outcome of this procedure provided an evaluation of the effective quantum yield of photosystem II (PSII), denoted as Fv ?/ Fm.
2.6. Statistical Analysis
Statistical analysis for biomass, pigment contents, and photosynthesis efficiency data was conducted utilizing the RStudio program. The assessment involved employing one-way analysis of variance to specific significant differences, with a significance threshold set at p ≤ 0.05. Tukey’s test was employed for conducting multiple comparisons among different groups.
3. RESULTS AND DISCUSSION
3.1. Impact of pH Variations on the Growth of L. planctonica (KU.B3)
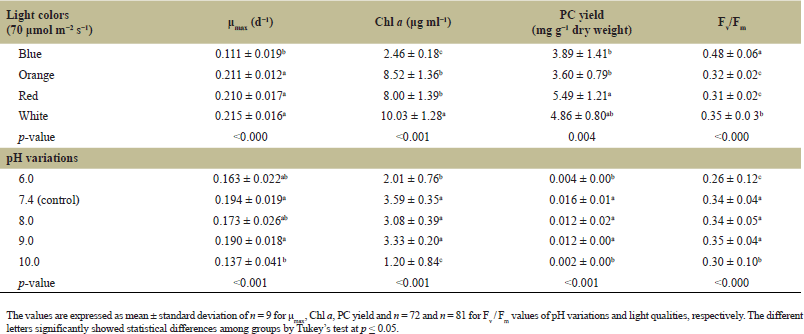
Following the cultivation of L. planctonica (KU.B3) in different pH conditions, the growth curve exhibited distinct patterns, and the stationary phase was attained at varying time points in cultures subjected to different pH levels. Specifically, the strain rapidly reached the stationary phase at pH 6.0 (highly acidic) and pH 10.0 (highly alkaline) around the 8th and 6th days, respectively (Fig. 2A). In contrast, cultures within the pH range of 7.4 to 9.0 demonstrated more efficient growth, taking a longer duration to reach the stationary phase, approximately around the 14th and 16th (Fig. 2A). Evaluation of the pH effects on the strain’s growth indicated that the specific growth rate (μmax) of L. planctonica (KU.B3) did not exhibit significant differences (p > 0.05) at pH 6.0, 7.4, 8.0, and 9.0, with approximate values of 0.163, 0.194, 0.173, and 0.190 d−1 (Table 1), respectively. However, at pH 10.0, the specific growth rate was lower, approximately 0.137 d−1, followed by pH 6.0 (Table 1). The highest specific growth rate was observed at pH 7.4, although growth rates between pH 8.0 and 9.0 were also favorable.
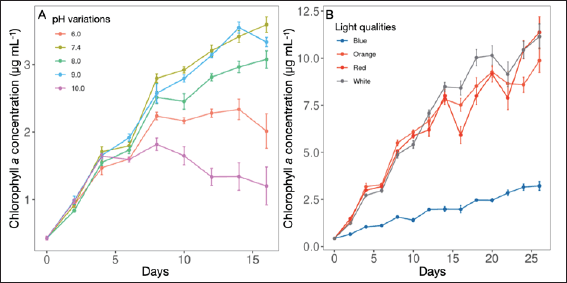 | Figure 2. The growth curve of the strain L. planctonica (KU.B3). (A) pH variations and (B) light qualities representing chlorophyll a concentration. Error bars indicate mean ± standard error of n = 9. [Click here to view] |
Biomass production, as indicated by chlorophyll a content under varying pH conditions, revealed that cultures cultivated at pH 7.4, 8.0, and 9.0 exhibited comparable chlorophyll a content levels at 3.59, 3.08, and 3.33 μg ml−1 (Table 1), respectively. These pH conditions appeared conducive to the growth of L. planctonica (KU.B3), as evidenced by their similar biomass production. Conversely, cultures grown under highly acidic (pH 6.0) and highly alkaline (pH 10.0) conditions had significantly lower chlorophyll a content, approximately 2.01 and 1.20 μg ml−1, respectively.
Examining pH variations on L. planctonica (KU.B3) revealed an optimal pH range for the strain’s cultivation, demonstrating favorable outcomes in biomass production and pigment synthesis within the pH range of 7.4 and 9.0. Contrastingly, extreme pH conditions, both highly acidic (pH 6.0) and highly alkaline (pH 10.0), resulted in detrimental effects on the growth and pigment production of L. planctonica (KU.B3). It might assumed that pH conditions impacted on stress culture that pH 6.0 and pH 10.0 conditions were less suitable for L. planctonica (KU.B3), as they led to rapid entry into the stationary phase, which might indicate stress culture conditions. Further stress could lead to early entry into the death phase compared to cultures within the pH range of 7.4–9.0. This finding differs from the research on Synechocystis sp., which showcased thriving capabilities at a pH of 10.0 [2,9], highlighting species-specific pH preferences among cyanobacteria. The diminished chlorophyll a content suggests reduced biomass production in these extreme pH conditions. The decreased chlorophyll a content and biomass production at pH 6.0 and 10.0 aligned with the earlier finding of lower growth rates observed at these pH levels. The strain experienced stress and inefficient growth in highly acidic and alkaline conditions, reducing chlorophyll synthesis and biomass production. The results indicated that pH levels between 7.4 and 9.0 were suitable for the growth and productivity of L. planctonica (KU.B3). The strain exhibited similar chlorophyll content and biomass production within this pH range, suggesting stable and efficient growth. The observable color change in L. planctonica (KU.B3) cultures, transitioning from green to pale yellow under highly alkaline pH, indicates unfavorable conditions leading to strain decline. Similar color variations have been noted in other cyanobacterial strains, such as Anabaena NCCU-9, under extreme pH conditions [9]. Extreme pH conditions have the potential to alter intracellular pH, triggering protein denaturation and loss of protein functionality, thereby adversely impacting cellular processes [9,24]. In natural environments, interactions between autotrophic organisms like cyanobacteria and heterotrophic organisms can create microenvironments with specific pH conditions. Alkaline pH levels, for instance, may enhance nutrient and element solubility, providing advantages for cyanobacteria. However, excessively high pH levels might disrupt the absorption of crucial elements, such as carbon and nitrogen, essential for cyanobacterial growth [9,25].
Specific pigments, such as chlorophyll a and phycobilisomes (PBS), play a critical role in capturing and absorbing light energy, which is then used for photosynthesis [26]. The study of L. planctonica (KU.B3) indicated that orange and red light induced similar growth patterns, suggesting optimization of the cyanobacteria’s pigments for light capture within these wavelengths. In contrast, slower growth under blue light aligned with the absence of accessory pigments like chlorophyll b in the strain. Chlorophyll b, known for its effective absorption of blue light, was absent, potentially impeding efficient energy capture and utilization under blue light conditions [27]. A comparison with a study involving green algae Chlorella and cyanobacteria Synechocystis, exploring the effects of blue and red light ratios on growth [8], revealed that Synechocystis preferred higher red light ratios for optimal growth. On the other hand, the green algae Chlorella showed increased growth when blue light was increased. This reinforces the idea that distinct photosynthesis organisms exhibit diverse responses to varying light wavelengths, influenced by their unique pigments and adaptative strategies. The limited growth of L. planctonica (KU.B3) under blue light aligns, reflecting cyanobacteria’s challenges in effectively utilizing blue light for growth. Additionally, the absence of accessory pigments and potential energy transfer imbalances contribute to reduced growth efficiency under blue light conditions.
 | Table 1. The maximum specific growth rate (μmax), chlorophyll a concentration (Chl a), phycocyanin yield (PC yield) per gram (g−1) of dry weight, and photosynthetic efficiency (Fv / Fm) of the strain L. planctonica (KU.B3) in the different light qualities and pH variations. [Click here to view] |
3.2. Impact of Different Light Qualities on the Growth of L. planctonica (KU.B3)
The growth curve analysis of the L. planctonica (KU.B3) conducted under varying LED light qualities revealed distinctive strain responses to specific light spectra. The growth curves associated with white, red, and orange light exhibited similar patterns, showcasing growth inhibition on the 16th and 22nd days. However, the strain exhibited subsequent recovery and sustained growth, indicating an adaptive response to the prevailing light conditions. The growth curve further revealed the attainment of a stationary phase after the 16th day, indicative of a stable growth rate under these light conditions (Fig. 2B). The high chlorophyll a concentration and steep slope observed during the exponential phase suggested proficient utilization of light colors for growth and energy production. Notably, there were significant differences between blue light and other light colors. Limnothrix planctonica (KU.B3) displayed notably low chlorophyll a concentration under blue light, indicating limited utilization of blue light for growth and energy production (Table 1).
Analysis of the specific growth rate under white, red, and orange light revealed no significant differences (p > 0.05), with approximate values of 0.215, 0.210, and 0.211 d−1, respectively (Table 1). However, the specific growth rate under blue light was significantly lower, approximately 0.111 d−1, compared to the other light colors. Analysis of different light colors on chlorophyll a concentration (biomass productions) demonstrated that red and orange light effectively supported in promoting biomass production, with no significant differences between them (p > 0.05) at 8.00 and 8.52 μg ml−1, respectively. White light was the most effective biomass production, with 10.03 μg ml−1. In contrast, blue light resulted in the lowest biomass production, 2.46 μg ml−1 (p < 0.001) (Table 1), indicating its considerably lower efficiency in promoting biomass growth compared to the other three light colors. These findings align with previous observations where blue light negatively impacted the specific growth rate and growth ability of L. planctonica (KU.B3). Conversely, white, red, and orange light efficiently supported the strain’s biomass production.
In this investigation, the cyanobacterial strain L. planctonica (KU.B3) demonstrated augmented growth rates (μmax) under orange and red light conditions, surpassing those observed under white light. This preference for wavelength within the orange and red spectrum suggests their efficacy in facilitating optimal growth conditions for the strain. Furthermore, the assessment of biomass production, as indicated by chlorophyll a content, provided additional evidence supporting the notion that orange and red light conditions fostered heightened biomass yields compared to white light. Both the μmax values and biomass production outcomes underscore the favorable influence of orange and red light on promoting the growth and biomass accumulation of L. planctonica (KU.B3).
Pigments such as chlorophyll a and PBS play crucial roles in cyanobacteria, with chlorophyll a primarily located in photosystem I (PSI) and PBS responsible for capturing and transferring light energy to PSII [12]. Carotenoids, another group of pigments, act as accessory pigments, absorbing light energy and contributing to photoprotection [28]. A comprehensive understanding of cyanobacterial response to blue light absorption reveals that pigments, including chlorophyll a and carotenoids, absorb blue light, leading to high-energy transitions within photosystems. However, an excess of energy in PSI relative to PSII can disrupt the electron transport chain, hindering efficient energy utilization. The surplus energy captured from blue light may create an imbalance between the production of energy-rich molecules (ATP and NADPH) and their demand in growth processes. Consequently, this imbalance could divert energy generated through photosynthesis away from growth-related processes, resulting in diminished growth rates [12]. Relating this insight to the study on L. planctonica (KU.B3), the observed reduction in growth rate under blue light conditions may be attributed to the imbalances described above. Despite chlorophyll a’s ability to absorb blue light, the overall utilization of this light for growth might be compromised due to a mismatch between absorbed energy and its efficient transfer for growth processes. These findings suggest that L. planctonica (KU.B3) demonstrated similar and effective growth rates under white, red, and orange light, without notable variance among these three light colors. Conversely, our results indicate that blue light may not promote the growth of L. planctonica (KU.B3), potentially due to the strain’s limitation in utilizing blue light for photosynthesis and energy generation. This suggests that blue light negatively impacts the growth ability of the strain, rendering it unsuitable for promoting the growth of L. planctonica (KU.B3).
Cyanobacteria are equipped with phycobiliproteins, such as phycoerythrin and phycocyanin, which efficiently absorb red light, stimulating photosynthetic activity and promoting growth under favorable conditions [29]. However, prolonged exposure to high-intensity red light can induce photoinhibition, damaging the photosynthetic apparatus due to the accumulation of reactive oxygen species (ROS). Although cyanobacteria have mechanisms to mitigate ROS damage, excessive exposure to red light can still inhibit growth. Moreover, red light has been implicated in triggering specific physiological responses in cyanobacteria, including pigment synthesis and phototaxis regulation, which may influence overall growth and behavior [30,31]. Blue light, essential for cyanobacterial photosynthesis, is absorbed by chlorophyll and other photosynthetic pigments, facilitating efficient photosynthesis and growth. Cyanobacteria possess blue light receptors, such as phototropins and cryptochromes, which play roles in various cellular processes, including phototaxis, circadian rhythms, and gene expression regulation. Studies have indicated that blue light can affect cyanobacterial morphology, motility, metabolic activities, and the production of secondary metabolites. Additionally, blue light influences the expression of genes associated with stress responses and metabolic pathways [8,12,32,33]. White light, encompassing a broad spectrum of wavelengths including red, blue, and green light, is commonly used in laboratory settings to investigate cyanobacterial growth and photosynthesis [34–36]. Cyanobacteria can adapt to white light conditions, utilizing available wavelengths for photosynthesis and other metabolic processes. However, the growth response of cyanobacteria to white light may vary depending on the balance between different spectral components and the illumination intensity. High-intensity white light may induce photoinhibition and oxidative stress, while low-intensity white light may support optimal growth and photosynthetic efficiency [29,31].
3.3. Effects of pH and Light on Phycocyanin Production
The outcomes of a pH variations experiment on phycocyanin production in the L. planctonica (KU.B3) strain revealed a noteworthy influence of the growth medium’s pH. In highly acidic conditions (pH 6.0), the strain exhibited significantly low phycocyanin production, approximately 0.004 mg g−1 dry weight. This pH environment proved unfavorable for the strain, impeding efficient phycocyanin production, similar to the outcomes observed in highly alkaline conditions (pH 10.0), where phycocyanin production was significantly low at 0.002 mg g−1 dry weight (Table 1, Fig. 3A). In both extreme pH scenarios, the strain faced challenges in achieving efficient phycocyanin production. Conversely, the control medium (pH 7.4) exhibited relatively higher phycocyanin production compared to pH 6.0 and pH 10.0. The phycocyanin production at pH 7.4 was approximately 0.016 mg g−1 dry weight. Slightly alkaline conditions with pH 8.0 and 9.0 also demonstrated non-significant differences (p = 0.9104) yet relatively lower phycocyanin production than the control. Phycocyanin production at pH 8.0 and 9.0 was 0.012 and 0.012 mg g−1 dry weight, respectively. Consequently, the strain exhibited optimal phycocyanin production within the pH range from neutral to slightly alkaline conditions (pH 7.4–9.0). Both highly acidic (pH 6.0) and highly alkaline (pH 10.0) conditions were deemed unfavorable for the strain, resulting in significantly reduced phycocyanin production [7].
Diverse effects on phycocyanin production were observed following cultivating L. planctonica (KU.B3) in four different light colors. Notably, red light demonstrated the highest phycocyanin production, yielding approximately 5.49 mg g−1 dry weight (Table 1). This outcome signifies that red light is exceptionally effective in inducing phycocyanin synthesis in the utilized strain. White light-induced phycocyanin production at a level of approximately 4.86 mg g−1 dry weight, showing no significant difference from red light (p = 0.6042) (Table 1, Fig. 3B), thus highlighting its considerable potential for inducing phycocyanin production. In contrast, blue light-induced phycocyanin production at a lower level, 3.89 mg g−1 dry weight (Table 1). Although not significantly different from white light (p = 0.2524), it was significantly lower than red light (p = 0.0183). The most minor phycocyanin production was observed under orange light, approximately 3.60 mg g−1 dry weight. Similar to blue light, it did not significantly differ from white light (p = 0.0853), but its production was significantly lower compared to red light (p = 0.004).
PBS, intricate light-harvesting complexes inherent in cyanobacteria and red algae, are pivotal in absorbing light energy and transferring it to the photosystems for photosynthesis [37]. The examination of L. planctonica (KU.B3) under blue light conditions revealed suboptimal growth, likely noticeable in Arthrospira maxima, which exhibited heightened pigment production, including phycocyanin, phycoerythrin, and allophycocyanin. This observation implies an adaptive response to enhance light energy capture within the blue wavelength range [26]. In Synechocystis sp. PCC 6803, the low growth rate under blue light may be attributed to an energy transfer imbalance between PSI and PSII. The increased energy transfer of PBS in blue light could lead to excess energy in one photosystem over the other, causing an imbalance and potential disruption in energy utilization and distribution [38]. These effects might lead to be different outcome of the pigment production when thrived under different lights for L. planctonica.
3.4. Effects of pH and Light on Photosynthetic Efficiency of Fv/Fm
The Fv / Fm values assessment at various pH conditions revealed a range of 0.34 to 0.35 when the strain was cultured within the pH range of 7.4 to 9.0. However, at pH 6.0, the Fv / Fm value decreased to 0.26, signifying an 8.5% reduction compared to the control condition (pH 7.4) (Table 1, Fig. 4A). Similarly, at pH 10.0, the Fv / Fm value decreased to approximately 0.30, representing a 4.5% decrease compared to the control (Table 1, Fig. 4A). The strain’s growth was adversely affected under extreme pH conditions (pH 6.0 and pH 10.0), suggesting that highly acidic and highly alkaline media are unfavorable for its growth. The examination of photosynthetic efficiency indicated that the strain’s photosynthetic efficiency, as measured by Fv/Fm, was negatively impacted under extreme pH conditions (pH 6.0 and pH 10.0). This observation aligns with the decrease in growth observed under these extreme pH conditions. The strain exhibited optimal photosynthesis efficiency within a more neutral pH range (pH 7.4–9.0), as evidenced by the higher Fv / Fm values recorded within this range.
Examining pH variations on the photosynthetic efficiency of L. planctonica (KU.B3) revealed intriguing insights. Within the pH range of 7.4 to 9.0, the Fv / Fm value remained relatively stable, suggesting robust photosynthetic performance under these conditions. However, a notable decline of approximately 13%–21% in the Fv / Fm value was observed at pH 6.0, indicating a significant adverse impact on photosynthetic efficiency under highly acidic conditions. Comparative analysis with another cyanobacterial species, Synechocystis sp. PCC 6803, revealed contrasting responses to pH variations. While L. planctonica exhibited optimal photosynthetic efficiency within the pH range of 7.4–9.0, Synechocystis sp. PCC 6803 displayed a more stable photosynthetic efficiency across a broader pH spectrum. Specifically, the Fv / Fm values for Synechocystis sp. PCC 6803 under neutral pH conditions ranged between 0.40 and 0.42, with only a slight decrease of 11% to 0.37%, recorded under highly alkaline conditions (pH 11.0) [39]. This contrasts with the pronounced impact observed on L. planctonica (KU.B3) under highly acidic (pH 6.0) and highly alkaline (pH 10.0) conditions. These findings underscore the species-specific responses of cyanobacteria to pH variations, highlighting the importance of understanding their physiological adaptations to environmental conditions.
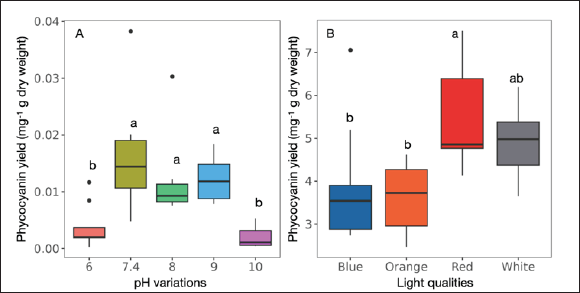 | Figure 3. Comparisons of phycocyanin yield of the strain L. planctonica (KU.B3). (A) pH variations. (B) light qualities. Box plot was used (n = 9), and the different letters significantly showed statistic differences among groups by Tukey’s test at p ≤ 0.05. [Click here to view] |
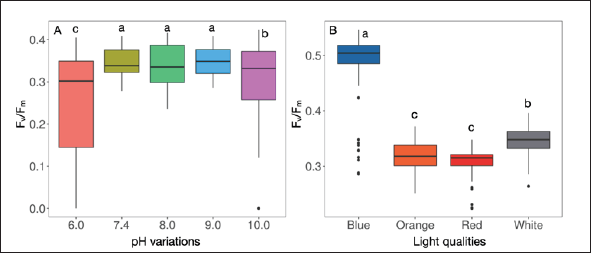 | Figure 4. The photosynthetic efficiency represented the Fv / Fm ratio on cell growth. (A) pH variations. (B) light qualities. Box plot was used (n = 72 for pH variations and n = 81 for light qualities), and the different letters significantly showed statistical differences among groups by Tukey’s test at p ≤ 0.05. [Click here to view] |
In investigating the impact of various light colors on the strain’s photosynthetic efficiency (Fv / Fm), Fv / Fm values were assessed under different light conditions. Notably, blue light resulted in the highest Fv / Fm of 0.48 (p ≤ 0.000) (Table 1, Fig. 4B), signifying that the strain exhibited greater efficiency in photosynthesis under blue light, as indicated by the elevated Fv / Fm value. However, it is noteworthy that despite the high photosynthetic efficiency observed under blue light, the strain’s growth rate and biomass production were the lowest compared to other light conditions (Table 1). White light showed the second-highest photosynthetic efficiency, with an Fv / Fm value of 0.35 (p ≤ 0.000). This suggests that white light was also conducive to photosynthesis, albeit not as effective as blue light. Orange and red light exhibited similar Fv / Fm values, approximately 0.32 and 0.31, respectively (Table 1, Fig. 4B). The strain demonstrated lower photosynthetic efficiency under orange and red light than under blue and white light. However, it is noteworthy that despite the lower Fv / Fm under orange and red light, these light conditions still supported high growth rates, biomass production, and pigment production (Table 1). This suggests the strain performed well under orange and red light conditions, demonstrating its adaptability and successful functioning despite relatively lower photosynthetic efficiency.
The Fv /Fm ratio serves as a pivotal metric in assessing cyanobacteria’s photosynthetic efficiency and vitality, offering insights into the functionality of PSII and the conversion of absorbed light energy into chemical energy. pH fluctuations can significantly impact cyanobacterial physiology, potentially influencing photosynthetic performance and altering the Fv / Fm ratio. However, the precise correlation between Fv / Fm and pH conditions in cyanobacteria is multifaceted and contingent upon various factors. Cyanobacteria typically exhibit optimal growth and photosynthetic activity within specific pH ranges, with deviations from these optima inducing physiological stress and impeding photosynthetic efficiency. Reduced Fv / Fm values often reflect such deviations, signifying compromised photosynthetic performance and may indicate stress-induced photoinhibition or PSII damage under unfavorable pH conditions [27,40,41].
Light, an indispensable factor in photosynthesis, is the primary energy source for converting carbon dioxide and water into glucose and oxygen [37]. Different wavelengths of light exert distinct effects on photosynthetic organisms [7]. In this study, L. planctonica (KU.B3) demonstrated enhanced photosynthetic efficiency, as measured by Fv/Fm ratio, when exposed to orange and red light compared to blue light. This finding suggests that L. planctonica (KU.B3) efficiently captured and utilized light energy in the more favorable orange and red wavelengths, facilitating efficient photosynthesis. The heightened Fv/Fm value under blue light indicates the strain’s adaptation to this less favorable wavelength. This adaptation may involve the augmentation of specific photoprotective mechanisms, including synthesizing pigments to manage excess light energy. Despite the increase in Fv/Fm value under blue light, the strain displayed the lowest growth in terms of biomass. This finding suggests that while L. planctonica (KU.B3) could harness light energy under blue light, this energy may not be optimally utilized for growth. The observed imbalance between photosynthetic efficiency and growth could stem from the diversion of energy toward photoprotective mechanisms and pigment synthesis rather than being directed toward processes promoting cell division and biomass production.
4. CONCLUSION
In conclusion, our investigation highlights the critical role of optimizing cultivation conditions, particularly concerning pH levels and light quality, in enhancing the productivity of L. planctonica (KU.B3). Within the pH range of 7.4 to 9.0, optimal growth and pigment synthesis were observed, while highly acidic and alkaline conditions negatively impacted growth and photosynthetic efficiency. Furthermore, our findings underscore the strategic significance of selecting specific light wavelengths, such as orange and red light, to achieve enhanced yields and ensure efficient cultivation practices. These results emphasize the interplay between environmental factors and cyanobacterial physiology, offering insights into biotechnological applications and environmental sustainability. Future research should investigate the molecular mechanisms underlying these responses to enable more precise manipulation of cyanobacterial physiology for sustainable bioproduction and environmental remediation efforts. Additionally, further investigations are warranted to understand the growth mechanisms of L. planctonica (KU.B3) under diverse light conditions and optimize phycocyanin extraction for its broader applications.
5. ACKNOWLEDGMENTS
The authors extend their sincere gratitude to Weerasin Sonjaroon, a valued member of the Advanced Plant Production with Artificial Light team at Kasetsart University, for generously providing the equipment utilized in their work. This research is funded by Kasetsart University through the Graduate School Fellowship Program. Additionally, funding was received from the International SciKU Branding (ISB), Faculty of Science, Kasetsart University.
6. AUTHOR CONTRIBUTIONS
All authors made substantial contributions to conception and design, acquisition of data, or analysis and interpretation of data; took part in drafting the article or revising it critically for important intellectual content; agreed to submit to the current journal; gave final approval of the version to be published; and agree to be accountable for all aspects of the work. All the authors are eligible to be an author as per the international committee of medical journal editors (ICMJE) requirements/guidelines.
7. CONFLICTS OF INTEREST
The authors report no financial or any other conflicts of interest in this work.
8. ETHICAL APPROVALS
This study does not involve experiments on animals or human subjects.
9. DATA AVAILABILITY
All the data is available with the authors and shall be provided upon request.
10. PUBLISHER’S NOTE
All claims expressed in this article are solely those of the authors and do not necessarily represent those of the publisher, the editors and the reviewers. This journal remains neutral with regard to jurisdictional claims in published institutional affiliation.
11. USE OF ARTIFICIAL INTELLIGENCE (AI)-ASSISTED TECHNOLOGY
The authors declares that they have not used artificial intelligence (AI)-tools for writing and editing of the manuscript, and no images were manipulated using AI.
REFERENCES
1. Eriksen NT. Production of phycocyanin—a pigment with applications in biology, biotechnology, foods and medicine. Appl Microbiol Biotechnol 2008;80(1):1–14.
2. Pagels F, Guedes AC, Amaro HM, Kijjoa A, Vasconcelos V. Phycobiliproteins from cyanobacteria: chemistry and biotechnological applications. Biotechnol Adv [Internet] 2019;37(3):422–43; http://doi.org/10.1016/j.biotechadv.2019.02.010
3. Galetovi A, Seura F, Gallardo V, Cort J, Benito G. Use of phycobiliproteins from Atacama cyanobacteria as food colorants in a dairy beverage prototype. Foods 2020;9(2):1–13.
4. Cai YA, Murphy JT, Wedemayer GJ, Glazer AN. Recombinant phycobiliprotiens: recombinant C-phycocyanins equipped with affinity tags, oligomerization, and biospecific recognition domains. Anal Biochem 2001;290(2):186–204.
5. Tian F, Buso D, Wang T, Lopes M, Niangoran U, Zissis G. Effect of red and blue LEDs on the production of phycocyanin by Spirulina platensis based on photosynthetically active radiation. J Sci Technol Lighting 2017;41:1–5.
6. Hsieh-lo M, Castillo G, Ochoa-becerra MA, Mojica L. Phycocyanin and phycoerythrin: strategies to improve production yield and chemical stability. Algal Res [Internet] 2019;42(March):101600; http://doi.org/10.1016/j.algal.2019.101600
7. Singh P, Gupta SK, Guldhe A, Rawat I, Bux F. Culturing techniques [Internet]. In: Kim SK (ed.). Handbook of marine microalgae, Elsevier Inc., Cambridge, MA, pp 43–54, 2015; http://doi.org/10.1016/B978-0-12-800776-1.00004-2
8. Luimstra VM, Verspagen JMH, Xu T, Schuurmans JM, Huisman J. Changes in water color shift competition between phytoplankton species with contrasting light-harvesting strategies. Ecology 2020;101(3):e02951.
9. Hemlata, Fatma T. Screening of cyanobacteria for phycobiliproteins and effect of different environmental stress on its yield. Bull Environ Contam Toxicol 2009;83(4):509–15.
10. Chaiklahan R, Chirasuwan N, Bunnag B. Stability of phycocyanin extracted from Spirulina sp .: influence of temperature, pH and preservatives. Process Biochem [Internet] 2012;47(4):659–64; http://doi.org/10.1016/j.procbio.2012.01.010
11. Martelli G, Folli C, Visai L, Daglia M, Ferrari D. Thermal stability improvement of blue colorant C-phycocyanin from Spirulina platensis for food industry applications. Process Biochem [Internet] 2014;49(1):154–9; http://doi.org/10.1016/j.procbio.2013.10.008
12. Luimstra VM, Schuurmans JM, Verschoor AM, Hellingwerf KJ, Huisman J. Blue light reduces photosynthetic efficiency of cyanobacteria through an imbalance between photosystems I and II. Photosynth Res [Internet] 2018;0(0):0; http://doi.org/10.1007/s11120-018-0561-5
13. Sivasankari S, Vinoth M, Ravindran D, Baskar K, Alqarawi AA. Efficacy of red light for enhanced cell disruption and fluorescence intensity of phycocyanin. Bioprocess Biosyst Eng [Internet] 44(1):141–50; http://doi.org/10.1007/s00449-020-02430-5
14. Gkelis S, Rajaniemi P, Vardaka E, Moustaka-Gouni M, Lanaras T, Sivonen K. Limnothrix redekei (Van Goor) Meffert (Cyanobacteria) strains from Lake Kastoria, Greece form a separate phylogenetic group. Microb Ecol 2005;49(1):176–82.
15. Gantar M, Simovi? D, Djilas S, Gonzalez WW, Miksovska J. Isolation, characterization and antioxidative activity of C-phycocyanin from Limnothrix sp. strain 37-2-1. J Biotechnol 2012;159(1–2):21–6.
16. Zhu M, Yu G, Li X, Tan W, Li R. Taxonomic and phylogenetic evaluation of Limnothrix strains (Oscillatoriales, Cyanobacteria) by adding Limnothrix planktonica strains isolated from central China. Hydrobiologia 2012;698(1):367–74.
17. Nübel U, Garcia-Pichel F, Muyzer G. PCR primers to amplify 16S rRNA genes from cyanobacteria. Appl Environ Microbiol 1997;63(8):3327–32.
18. Valério E, Chambel L, Paulino S, Faria N, Pereira P, Tenreiro R. Molecular identification, typing and traceability of cyanobacteria from freshwater reservoirs. Microbiology 2009;155(2):642–56.
19. Sanger F, Nicklen S, Coulson AR. DNA sequencing with chain-terminating inhibitors. Proc Natl Acad Sci U S A 1977;74(12):5463–7.
20. Bennett A, Bogorad L. Complementary chromatic adaptation in a filamentous blue-green alga. J Cell Biol 1973;58:419–35.
21. Ritchie RJ, Sma-Air S, Phongphattarawat S. Using DMSO for chlorophyll spectroscopy. J Appl Phycol 2021;33(4):2047–55.
22. Tang D, Han W, Li P, Miao X, Zhong J. CO2 biofixation and fatty acid composition of Scenedesmus obliquus and Chlorella pyrenoidosa in response to different CO2 levels. Bioresour Technol [Internet] 2011;102(3):3071–6; http://doi.org/10.1016/j.biortech.2010.10.047
23. Kaeoboon S, Suksungworn R, Sanevas N. Toxicity response of Chlorella microalgae to glyphosate herbicide exposure based on biomass, pigment contents and photosynthetic efficiency. Plant Sci Today 2021;8(2):293–300.
24. Keithellakpam OS, Nath TO, Oinam AS, Thingujam I, Oinam G, Dutt SG. Effect of external pH on cyanobacterial phycobiliproteins production and ammonium excretion. J Appl Biol Biotechnol 2015;3(04):38–42.
25. Fang F, Gao Y, Gan L, He X, Yang L. Effects of different initial pH and irradiance levels on cyanobacterial colonies from Lake Taihu, China. J Appl Phycol 2018;30(3):1777–93.
26. Park J, Dinh TB. Contrasting effects of monochromatic LED lighting on growth, pigments and photosynthesis in the commercially important cyanobacterium Arthrospira maxima. Bioresour Technol [Internet] 2019;291:121846; http://doi.org/10.1016/j.biortech.2019.121846
27. Ogawa T, Misumi M, Sonoike K. Estimation of photosynthesis in cyanobacteria by pulse-amplitude modulation chlorophyll fluorescence: problems and solutions. Photosynth Res 2017;133(1–3):63–73.
28. Heldt HW, Piechulla B. Chapter 2: The use of energy from sunlight by photosynthesis is the basis of life on earth. In: Plant biochemistry. 4th edition, Academic Press, Cambridge, MA, pp 43–64, 2011.
29. Mirkovic T, Ostroumov EE, Anna JM, Van Grondelle R, Govindjee, Scholes GD. Light absorption and energy transfer in the antenna complexes of photosynthetic organisms. Chem Rev 2017;117(2):249–93.
30. Latifi A, Ruiz M, Zhang CC. Oxidative stress in cyanobacteria. FEMS Microbiol Rev 2009;33(2):258–78.
31. Janeeshma E, Johnson R, Amritha MS, Noble L, Raj Aswathi KP, Telesi?ski A, et al. Modulations in chlorophyll a fluorescence based on intensity and spectral variations of light. Int J Mol Sci 2022;23(10):5599.
32. Montgomery BL. Sensing the light: photoreceptive systems and signal transduction in cyanobacteria. Mol Microbiol 2007;64(1):16–27.
33. Luimstra VM, Schuurmans JM, De Carvalho CFM, Matthijs HCP. Exploring the low photosynthetic efficiency of cyanobacteria in blue light using a mutant lacking phycobilisomes. Photosynth Res [Internet] 2019;141(3):291–301; http://doi.org/10.1007/s11120-019-00630-z
34. Glemser M, Heining M, Schmidt J, Becker A, Garbe D, Buchholz R, et al. Application of light-emitting diodes (LEDs) in cultivation of phototrophic microalgae: current state and perspectives. Appl Microbiol Biotechnol 2016;100(3):1077–88.
35. Hotos GN, Antoniadis TI. The effect of colored and white light on growth and phycobiliproteins, chlorophyll and carotenoids content of the marine cyanobacteria Phormidium sp. and Cyanothece sp. in Batch Cultures. Life 2022;12(6):837.
36. Rahman M, Asaeda T, Abeynayaka HDL, Fukahori K. An assessment of the effects of light intensities and temperature changes on cyanobacteria’s oxidative stress via the use of hydrogen peroxide as an indicator. Water (Switzerland) 2023;15(13):2429.
37. Dagnino-Leone J, Figueroa CP, Castañeda ML, Youlton AD, Vallejos-Almirall A, Agurto-Muñoz A, et al. Phycobiliproteins: structural aspects, functional characteristics, and biotechnological perspectives. Comput Struct Biotechnol J [Internet] 2022;20:1506–27; http://doi.org/10.1016/j.csbj.2022.02.016
38. Luimstra VM, Schuurmans JM, Hellingwerf KJ, Matthijs HCP, Huisman J. Blue light induces major changes in the gene expression profile of the cyanobacterium Synechocystis sp. PCC 6803. Physiol Plant 2020;170(1):10–26.
39. Touloupakis E, Cicchi B, Benavides AMS, Torzillo G. Effect of high pH on growth of Synechocystis sp. PCC 6803 cultures and their contamination by golden algae (Poterioochromonas sp.). Appl Microbiol Biotechnol 2016;100(3):1333–41.
40. Stirbet A, Lazár D, Papageorgiou GC, Govindjee. Chlorophyll a fluorescence in cyanobacteria: relation to photosynthesis. In: Mishra AK, Rai AN, Tiwari DN (eds.). Cyanobacteria: from basic science to applications, Academic Press, Cambridge, MA, pp 79–130, 2018.
41. Yadav P, Singh RP, Rana S, Joshi D, Kumar D, Bhardwaj N, et al. Mechanisms of stress tolerance in cyanobacteria under extreme conditions. Stresses 2022;2(4):531–49.