1. INTRODUCTION
Aquaculture has a significant potential to improve world nutrition and food security. China, India, Vietnam, Bangladesh, and Egypt are the world’s top producers of aquaculture [1]. The aquaculture production in India contains carps (Cyprinus carpio), catla (Labeo catla), rohu (Labeo rohita), and mrigal (Cirrhinus mrigala). Approximately 32,000 distinct fish species exist worldwide [2]. Among them, Tilapines are the bright star of aquaculture, with farms springing up all over the world and consumption outpacing even the most extensive farm construction plans. Tilapia has a wide range of breeds and strains, and it is now the most tamed of farmed fishes by criteria. It is unique among the primarily farmed fishes in that it plays an important role in rural aquaculture, increasing the well-being of the poorest farmers while also being reared in high-tech production systems and marketed globally. It was always thought that Tilapia farming was only threatened by a few commercially significant infections. However, this assumption is considered to be highly risky due to newly emerging infections. The first-ever serious epidemic disease in Tilapia, Tilapia Lake Virus Disease (TiLVD), was recently discovered in the year 2014 [3], putting the entire business at peril.
This illness has serious socioeconomic consequences for millions of people in Africa, Asia, and South America, and it is a direct threat to food security. Although the World Organisation for Animal Health reported in early 2018 that TiLV, the disease’s etiological agent, had been officially detected on three continents in eight countries, there have been additional reports of TiLV in Tanzania, Uganda, Indonesia, India, and other countries. The virus has been described as a novel enveloped, single-stranded, negative-sense RNA virus with 10 segments encoding 10 proteins [3–5] with a diameter of 55 to 100 nm [6,7]. Each of the 10 segments has an open reading frame, with the largest segment, segment 1, having a poor sequence homology to the influenza C virus PB1 subunit (17% amino acid identity, 37% segment coverage) [8]. It was discovered after massive losses of wild and farmed Tilapia in Israel’s Lake Galilee. The occurrence of summer mortalities and the one-month mortality syndrome linked to TiLV infection was noted in Nile and Red hybrid Tilapia (Oreochromis spp.) populations, both in Egypt and Thailand. There is no certain treatment for this viral infection to date. For the prompt and accurate diagnosis of TiLV, quantitative real-time PCR assays were developed [9]. Since TiLV is an RNA virus, the diagnosing assays should isolate RNA as a preliminary step. RNA extraction has been a time-consuming operation in the past, requiring expensive reagents, refrigeration, and an RNAse-free environment.
Obtaining high-quality RNA is the first and generally most important step in many molecular procedures, especially for the downstream application, including reverse transcription and real-time PCR (qRT-PCR). The quantity and quality of the input RNA determine how precisely gene expression is assessed. The overall performance of RNA-based analysis depends on the purity and integrity of the RNA. The outcome of downstream applications, which are frequently tedious, time-consuming, and costly, may be influenced by the initial use of low-quality RNA. Before using whole RNA for quantitative real-time PCR, microarrays, or other applications, it should be analyzed for quality [10].
Conventional extraction (Trizol method) and silica-membrane spin column technology are the most often used RNA isolation methods. Trizol reagents comprise harmful, abrasive, and corrosive compounds. Direct skin contact with these reagents might result in discomfort, redness, ulceration, and scarring. Therefore, users must pay more attention while working with these reagents. Low RNA yield with protein contamination, RNA degradation, and interference with downstream enzyme activities are all common issues when using the organic extraction method. One of the most essential challenges is reagent storage and operating temperature. RNA samples which are intended to proceed with qRT-PCR, digestion with DNase is necessary to get rid of any remaining DNA traces. Further purification procedures with RNA pellet in the final stage are necessary, because DNAse digestion including the removal of extra salts and protein contaminants from the purified sample, can impact the efficacy of the experiment. Trizol reagents are relatively expensive compared to other laboratory reagents. Proper storage conditions are crucial for maintaining the integrity and functionality of the reagent. RNA extraction kits are expensive and not always affordable. The membrane may become clogged or contaminated with proteins or genomic DNA due to a poor homogenization process [11]. Many different approaches have been done by researchers with different samples for RNA extraction.
In light of these challenges, this study aims to develop a novel and cost-effective RNA extraction method for the accurate diagnosis of TiLVD. The proposed method is based on the utilization of citrate buffer, offering several advantages over conventional techniques. By eliminating the need for harsh organic solvents and DNase treatment, this novel approach simplifies the extraction process, reduces costs, and promotes environmental sustainability.
The development of a robust and affordable RNA extraction method specifically tailored for TiLVD diagnosis holds immense potential for the aquaculture industry. It not only addresses the limitations of existing techniques but also has the potential to enhance disease surveillance, facilitate early detection, and enable effective management strategies. Furthermore, the availability of high-quality RNA samples obtained through this novel method will contribute to a better understanding of TiLVD pathogenesis and host–virus interactions.
In this study, we present the results of evaluating the performance of the Citrate buffer-based RNA extraction method in comparison to the Conventional technique (Trizol method). Additionally, we discuss the implications of this novel method in improving TiLVD diagnostics. Understanding the disease pathogenesis and contributing to the sustainable management of Tilapia aquaculture.
2. MATERIALS AND METHODS
2.1. Procurement and Acclimation of Fish
Tilapia (Oreochromis niloticus) fishes were obtained from a fish farm located in Walajapet, Tamil Nadu (12.282ºN, 80.099ºE) for this study. The fish were then transferred and maintained in the Aquaculture Biotechnology Laboratory at Vellore Institute of Technology, India. Throughout the experimental period, the fish were fed with commercial fish feed twice a day. To maintain optimal conditions for the fish, aeration was provided continuously, ensuring sufficient oxygen supply in the aquatic environment. To allow the fish to acclimate to the laboratory conditions, a one-week acclimation period was provided before the commencement of the experiments. This acclimation period helped the fish adjust to the new environment, minimizing stress and ensuring a more accurate representation of their physiological responses during the experimental procedures. By following these procedures and providing appropriate care and conditions, we aimed to ensure the well-being and adaptability of the Tilapia fishes throughout the study. Prior to initiating the experiments, three animals were randomly chosen and subjected to TiLV infection diagnosis through reverse transcriptase-PCR to confirm the healthy status of the fish.
2.2. Preparation of Viral Inoculum
Healthy Tilapia fishes were intentionally infected with TiLV inoculum, sourced from our previous study [12]. When clinical symptoms indicative of TiLV infection, including skin erosion, hemorrhaging, abnormal swimming, and lethargy, were observed [13], fish samples were procured during the moribund stage for RNA extraction. Experimentally infected fish samples, each weighing 5 mg, were subjected to homogenization. The addition of ice during homogenization served a dual purpose: firstly, to act as a mild anesthetic, thereby minimizing potential distress to the fish, and secondly, to protect the integrity of RNA present in the fish tissue, which is crucial for preserving RNA stability during the homogenization process. Following homogenization, a 1:4 dilution in Sterile Nacl-Tris-EDTA buffer (NTE) was prepared to create a suitable working concentration for subsequent steps. The diluted sample was then subjected to centrifugation at 12,000×g for 10 min at a temperature of 4°C. This centrifugation step allowed for the separation of the supernatant, which contains the viral particles, from the solid cellular debris. The resulting supernatant was carefully collected, taking precautions to avoid disturbing the pellet, and transferred to a new tube. To remove potential contaminants, the supernatant was filtered using a syringe filter with a pore size of 0.22 μM from Hi-Media [14]. This filtration step ensured the removal of any debris or particles that could interfere with subsequent analyses. To further minimize the presence of bacterial contaminants, the clear supernatant underwent three cycles of freeze-thawing.
2.3. Experimental Infections of TiLV
Tilapia fish were divided into four groups, with each group consisting of 25 fish. Among these groups, three groups were designated as experimental groups and received intraperitoneal injections with a known viral load of TiLV. Each group was administered a viral load of 2.14 × 10⁸ copies, which was determined to be the optimal dosage through real-time PCR analysis. This injection procedure was performed in three groups simultaneously to ensure the robustness and reliability of the results. The fourth group, serving as the experimental control, was injected with sterile NTE buffer instead of the TiLV load. This control group allowed for a baseline comparison to assess the specific effects of the virus on the experimental groups. To monitor the progression of the disease and gather data at different time points, fish samples were collected every 24 h until the moribund stage was reached. At each time point, a total of five fish samples were collected from each group. Tissue samples from fish, each weighing around 5 mg, were collected every 24 h and preserved in ice-cold NTE buffer. These samples were then stored at −20°C until the 96-hour mark. Subsequently, all the samples were processed simultaneously for RNA extraction.
2.4. Comparative Analysis of RNA Extraction Methods for TiLV-Infected Fish Samples
RNA extraction was conducted on samples collected at specific time intervals, including 24 h, 48 h, 72 h, and the moribund stage (96 h), from fish that were experimentally injected with TiLV. To assess the efficiency and effectiveness of RNA isolation methods, a novel approach was employed: the Citrate buffer-based method. The widely used standard Conventional method (Trizol method) was utilized as the reference for comparison [15]. The subsequent procedures outline the methodologies employed for these experiments.
2.4.1. Conventional RNA extraction (Trizol method)
The conventional method of RNA extraction was evaluated with the rapid method of RNA extraction. 200 μL of viral inoculum were added to 800 μL of Trizol reagent, briefly vortexed and mixed with 400 μL of chloroform, then centrifuged at the speed of 12,000×g for about 10 min at 4°C. After centrifugation, the aqueous phase of the sample was recovered and mixed in a clean tube with an equal volume of isopropanol. The tube was vigorously shaken manually to ensure thorough mixing and then placed in an incubator for 10 min. After the incubation period, the mixture underwent centrifugation at 12,000×g for 10 min at 4°C. The supernatant was removed and discarded, leaving behind a solid pellet. To cleanse the pellet, it was rinsed twice with 500 μL of ice cold 70% ethanol. Subsequently, the pellet was dried at room temperature for 10 min and then reconstituted in RNase-free water [16].
2.4.2. Citrate buffer-based RNA extraction
According to the protocols, a 1:1.5 ratio of the crude sample (TiLV inoculum) and Lysis Buffer were mixed by pipetting. The Lysis Buffer consists of 70 mM SDS, 135 mM anhydrous citric acid, 70 mM sodium citrate dihydrate, and 10 mM EDTA at pH 5.0. Subsequently, the Precipitation Buffer, containing 40 mM anhydrous citric acid, 20 mM sodium citrate dihydrate, and 4 M NaCl was added and mixed by inversion [17]. The mixture was then centrifuged at 15,000×g for 3 min at room temperature, followed by a 5-minute incubation at room temperature to separate the cellular debris and insoluble components from the supernatant containing RNA [18].
Next, a clean tube containing an equal ratio of isopropanol and the supernatant was mixed and incubated at room temperature for 10 min. The mixture was then centrifuged at 15,000×g for 5 minutes. The resulting pellet was washed with 300 μL of ice-cold 70% ethanol. The tubes were left open for 10 min to allow the pellet to dry, after which it was resuspended in 50 μL of RNase-free water [19].
2.5. Qualitative Analysis of RNA
For the assessment of RNA purity, a nanodrop spectrophotometer (Thermo Scientific, USA) was utilized. Before analysis, the lower and upper surface arms of the spectrophotometer were cleaned, and a blank measurement was conducted using RNAase-free water. One microliter (1 μL) of the extracted RNA sample was loaded onto the nanodrop, and the instrument automatically determined the RNA concentration along with the purity ratios of 260/280 and 260/230. The measurement was repeated three times to ensure the accuracy and consistency of results. The 260/280 ratio is commonly used to assess the purity of the RNA sample. A value around 1.8–2.0 is generally considered indicative of pure RNA without contamination from proteins or organic compounds. The 260/230 ratio provides information about the presence of contaminants such as salts, phenols, or other organic compounds. Ideally, this ratio should be around 2.0 or higher, indicating minimal contamination [10].
By repeating the measurement three times, an average value was obtained and the consistency of the results was assessed. Samples exhibiting good purity and consistent results were deemed reliable and processed further for cDNA synthesis. The reliable RNA samples were normalized to a concentration of 1 μg and subjected to reverse transcription to generate cDNA using the One Step PrimeScript cDNA Synthesis Kit (TaKaRa, Japan) as per the manufacturer’s instructions.
2.6. Data Analysis for Quality of RNA
We evaluated whether the quality of RNA obtained from all the above-discussed methods interferes with purity by comparing A260/280 and A260/230 in samples by Sidak’s multiple comparisons test. For all analytical purposes, P values less than 0.05 were considered to be statistically significant.
2.7. Evaluation of RNA Extraction Methods
Based on the spectrophotometric analysis described above, we compared the Citrate buffer-based RNA extraction method with the Conventional method (Trizol method) using 10 steps of two-fold serial dilution of the obtained cDNA from hourly samples of experimentally injected TiLV inoculum. Reverse transcriptase PCR was conducted for all serially diluted cDNA samples from both methods to assess their sensitivity. To further ensure the accuracy of TiLV validation in terms of copy numbers and TiLV gene expression, real-time PCR was performed using the cDNA obtained from both RNA extraction methods. The specific primers utilized for these analyses can be found in Table 1.
Table 1: Oligonucleotide sequence for real-time PCR analysis [28].
| Oligo Name | Sequence | Size |
|---|
| TiLV RT-F | GCACAACTCAGGCAGGGAAA | 150 bp |
| TiLV RT- R | GAGTTTGACGGGTACAGGGC |
| EF1 α-Tilapia-F | CCCAGAAACACCGAAACTAAA | 120 bp |
| EF1 α-Tilapia-R | TGTCGATTCCTCCGCACT |
2.8. Real-Time PCR for the Comparison of RNA Isolation Methods
Real-time PCR was performed for the viral load analysis by both the Citrate buffer-based method and the Conventional method (Trizol). RNA obtained by both methods was reversed transcribed to cDNA before which the concentration of RNA for both the methods was normalized to 1 µg/mL. The reaction mixture was prepared by using 2X SYBR Premix Ex Taq II master mix (TaKaRa, Japan) with 200nM of forward and reverse primer as depicted in Table 1. On the other hand, primers recognize and amplify TiLV segment three regions of the virus plus an additional primer set to detect the EF1α gene representing a control for sample integrity. The gene expression profile of the two different methods was evaluated. All the reactions were carried out in the BIORAD CFX96 real-time PCR system (Bio-Rad Laboratories, Inc., USA). The program for the reaction is given in Table 2. The viral load obtained from both methods was compared at the time course of the infection.
Table 2: Program for real-time PCR.
| Program | Temperature (ºC) | Duration | Repeats |
|---|
| Initialdenaturation | 95 | 3 min | 1 cycle |
| Denaturation | 95 | 30 s | 40 cycles |
| Annealing | 60 | 10 s |
| Extension | 72 | 20 s |
| Melt curve | 65°C to 95°C, with the gradient increasing of 0.5°C for every 0.05 s |
To find the efficacy of RNA extracted by the Citrate buffer method for Gene expression studies, the samples were subjected to gene expression studies of the TiLV segment 3 gene with the reference gene (EF1α). The gene expression was analyzed using the Conventional method. The fold change of the TiLV gene in the course of infection was analyzed by normalizing the expression of the control gene EF1α. The fold change obtained from both methods was compared to validate the Citrate buffer method of RNA extraction.
2.9. Statistical Analysis
The results of real-time PCR obtained by the Citrate buffer-based method and Conventional method were compared with the significance test. We tested the samples for normality using Shapiro–Wilk’s significance Test [20]. The correlation between both methods was compared by the Pearson correlation coefficient. A paired t-test was used to compare the data obtained from the real-time PCR using GraphPad Prism 7.0 software. A P-value of <0.05 was considered to be statistically significant [21].
3. RESULTS
In this work, the efficacy of RNA extracted from fish infected with TiLV using commonly applied methods—Trizol method (Conventional approach) and Citrate buffer-based method employing non-aggressive solvents and a less time-consuming protocol—was compared [22]. To isolate RNA from fish, Trizol-based methods have been employed most commonly [23]. The Citrate buffer-based technique is as reliable as the Conventional method. Notably, the processing time of the Citrate buffer-based technique was comparable to or less than that of the Conventional method. The RNA extraction by Trizol method requires approximately 1–2 h, whereas the Citrate buffer method of RNA extraction takes only 30–60 min. It makes use of inexpensive supplies and machinery that are common in molecular biology labs. Also, rather than 4ºC, ambient temperature was used for the experiments [19]. The comparison of the Trizol method and the Citrate buffer method is tabulated in Table 3. Reverse transcription PCR was used to validate the Citrate buffer-based RNA extraction as depicted in Figure 1.
Table 3: Comparison of conventional method and citrate buffer-based method
| Conventional Method (Trizol method) | Citrate Buffer Method |
|---|
| Required harmful, abrasive and corrosive chemicals | Required nontoxic chemicals |
| Uses reagents are expensive | Used less expense common laboratory chemicals |
| Entire experiment should be maintained at 4ºC | Experiments are performed at room temperature |
| Reagents need to be stored at 4ºC | Stored at room temperature |
| Complications of RNA degradation, interference of downstream enzyme activities | No downstream enzyme activities and no interference with downstream enzyme activities |
| Highly expensive | Much less expensive |
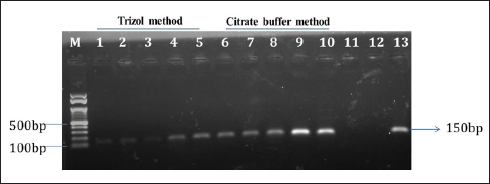 | Figure 1: Citrate buffer-based RNA extraction confirmed by reverse transcriptase PCR. Lane M – marker; Lane 1–4 – Trizol method of RNA extraction of timely interval samples (24 to 96 h); Lane 5 – Trizol method of RNA extraction of Wild-infected sample (positive); Lane 6–9 – Citrate buffer-based method of RNA extraction of timely interval samples (24 to 96 h); Lane 10 – citrate buffer method of RNA extraction of Wild-infected sample (Positive); Lane 11 – negative control for Trizol method; Lane 12 – negative control for Citrate buffer method; Lane 13 – PCR Positive control (TiLV Plasmid).
[Click here to view] |
3.1. Qualitative Analysis of RNA
RNA extracted using procedures described above was evaluated for quality using a nanodrop spectrophotometer. The results showed that the quality of RNA acquired by the Citrate buffer-based method was in the acceptable range with a 260/280 ratio and 260/230 ratio, and by repeating the experiments three times, the results were found to be reliable and consistent, which were validated by statistical analysis. The comparison of A260/280 and A260/230 ratios of the novel RNA extraction method and the Trizol method was plotted in the graphs and shown in Figures 2A and 2B.
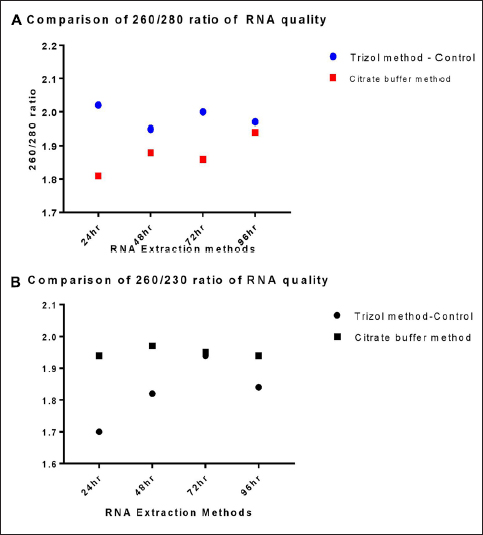 | Figure 2: (A) Comparative analysis of A260/280 ratio of samples obtained by both the methods of RNA extraction. (B) Comparative analysis of A260/230 ratio of samples obtained by both the methods of RNA extraction.
[Click here to view] |
The statistical results suggest that the Trizol method and the Citrate buffer method may yield similar RNA purity, as indicated by the consistent A260/280 and A260/230 ratios, which were analyzed by Tukey’s multiple comparison test with P < 0.01. Table 4 shows the data for qualitative analysis of RNA. The samples from the Citrate buffer method of RNA extraction also pass the Shapiro–Wilk test for normality.
Table 4: Qualitative analysis of experimentally infected RNA by two different methods
| Hourly Samples | Purity | Trizol Method | Citrate Buffer Method |
|---|
| 24 h | 260/280 | 2.02 | 1.81* |
| 260/230 | 1.70 | 1.94* |
| 48 h | 260/280 | 1.95 | 1.88* |
| 260/230 | 1.82 | 1.97* |
| 72 h | 260/280 | 2.00 | 1.86* |
| 260/230 | 1.94 | 1.95* |
| 96 h | 260/280 | 1.97 | 1.94* |
| 260/230 | 1.84 | 1.94* |
3.2. Sensitivity of Citrate Buffer-based Method of RNA Extraction
The limit of detection (LOD) for the RNA extracted from the infected Tilapia fish using a Citrate buffer-based approach was tested to determine the extent to which the RNA could be diluted and still produce a positive result [24]. This was accomplished by analyzing RNA in various quantities. The LOD of a sample was determined by the lowest quantity of RNA that produced a positive response in the assay. The method was validated by serial dilution of the samples used as a template for reverse transcriptase PCR, as illustrated in Figure 3. When the RNA was extracted using the Citrate buffer-based approach was tested using reverse transcriptase PCR, it was revealed that this method allowed for the use of a minimum concentration of 0.4 ng of cDNA while still obtaining a positive response in the assay. The Trizol method exhibited comparable sensitivity to the Citrate buffer-based extraction method.
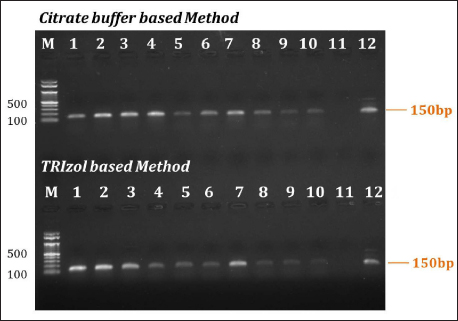 | Figure 3: Sensitivity of RNA eExtraction method. Lane M – Marker; Lane 1 to –10 – serial dilution of RNA samples (from 0.2 µg to 0.4 ng) by Citrate buffer-based method and Trizol Trizol-based method (Control). Lane 11 – Negative control (without template); Lane 12 – Positive positive control (Wild Wild-infected sample).
[Click here to view] |
Determining that the Citrate buffer-based approach allows for the use of a minimum concentration of 0.4 ng of cDNA while still obtaining a positive response suggests that this concentration is within the reliable detection range of the assay. Performing additional dilutions may not provide any additional information or improve the assay’s performance, but it only leads to handling errors. Avoiding further dilutions simplifies the experimental procedure and reduces the risk of introducing errors or variability. It also saves time and resources, as additional dilutions and subsequent testing would require additional reagents and consumables.
3.3. Efficiency of Citrate Buffer Method
To calculate the copy numbers of the samples, the standard graph was generated by constructing a plasmid containing the segment 3 gene of TiLV in pGEMT-easy vector as depicted in Figure 4A, and the amplication curve for the standard graph is depicted in Figure 4B. With the help of the standard graph, the copy numbers of TiLV in the experimentally infected fish (24–96hrs) were determined. The comparison of Cq (quantification cycle) values of the TiLV gene from both experiments was visualized in the form of a heat map, which is depicted in Figure 5.
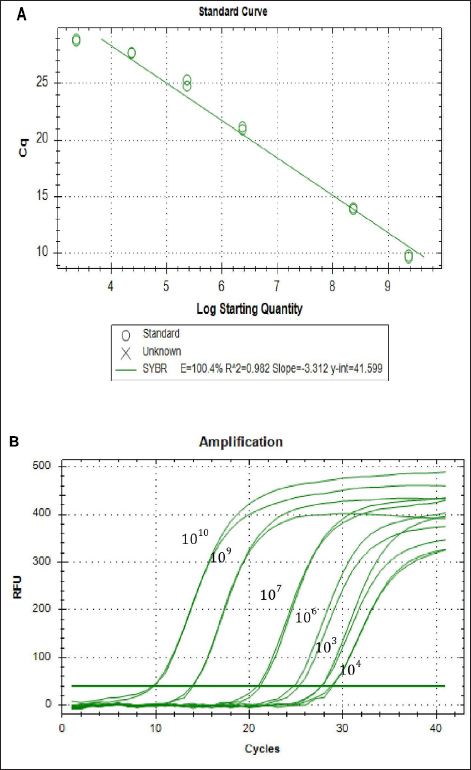 | Figure 4: (A) Standard graph generated using pGEMT easy-TiLV segment3 plasmid. (B) Amplification curve generated using pGEMT easy-TiLV segment3 plasmid.
[Click here to view] |
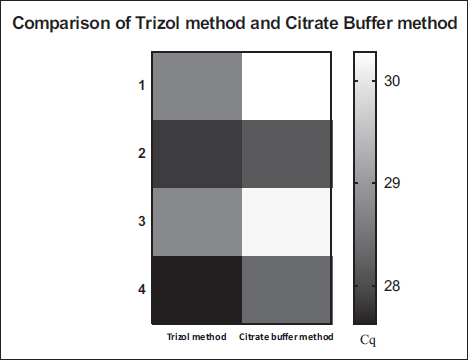 | Figure 5: Heat map for the comparison of Cq obtained from TiLV gene expression by Trizol method (Control) and Citrate buffer method. 1 represents -24 Hr h of TiLV TiLV-infected samples; 2- represents 48 Hr h of TiLV TiLV-infected samples; 3- represents 72 Hr h of TiLV TiLV-infected samples; 4- represents 96 Hr h of TiLV TiLV-infected samples. The scale bar positioned on the right side indicates the Cq values.
[Click here to view] |
Figure 6 compares the TiLV copy numbers achieved using the Conventional method and the Citrate buffer-based method. Based on the results, it was evident that RNA produced using a method based on citrate buffers could also be used for real-time PCR test analysis. The cost of the chemicals used for the RNA extraction by both methods was compared in Table 5 for approximately 10 reactions. It shows that the cost of the Citrate buffer method approximately 27 times lower than the cost of the Trizol method.
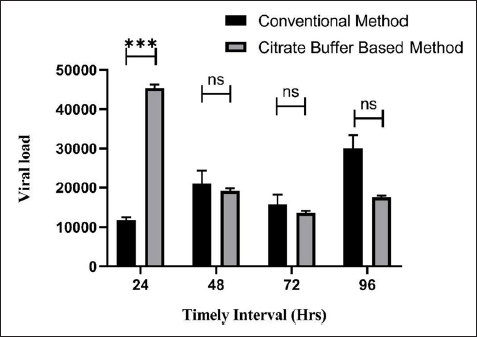 | Figure 6: Viral load comparison between the Trizol method (Control) and Citrate buffer method. * represents p<0.001 and ns represents no significant difference in the group compared by Tukey’s multiple comparison test.
[Click here to view] |
Table 5: Cost comparison between Trizol and Citrate buffer method
| Cost of Citrate Buffers (10 samples) | Cost of Trizol Reagents (10 samples) |
|---|
| Lysis buffer | $0.059 | Rs. 4.96 | Trizol | $6.37 | Rs. 532 |
| Precipitation buffer | $0.037 | Rs. 3.13 | Chloroform | $0.081 | Rs .6.8 |
| Isopropanol | $0.067 | Rs. 5.6 | Isopropanol | $0.067 | Rs. 5.6 |
| Ethanol | $0.048 | Rs. 4.0 | Ethanol | $0.048 | Rs. 4.0 |
| RNAse free Water | $0.030 | Rs. 2.5 | RNAse free Water | $0.030 | Rs. 2.5 |
| Total cost | $0.241 | Rs. 20.19 | Total cost | $6.60 | Rs. 550.9 |
The gene expression of the TiLV gene was evaluated throughout the infection using both the Citrate buffer method and the Trizol method. The fold change in gene expression was analyzed and compared between the two methods. Interestingly, the profiles of gene expression obtained from both methods were found to be similar. This suggests that both the Citrate buffer method and the Trizol method are reliable and yield consistent results in assessing the gene expression of TiLV during infection.
3.4. Statistical Analysis of RNA Extraction Methods
RNA isolated from the Citrate buffer-based method was analyzed statistically by paired t-test, which shows that there is no significant difference between the RNA samples obtained by the Citrate buffer-based method with P < 0.05. The correlation of viral load obtained from both methods was analyzed by Pearson correlation. The methods were highly correlated with the Pearson coefficient r = 0.997 [25] and the linear regression of R square = 0.99. The correlation with the linear regression is depicted in Figure 7. The statistical analysis of gene expression studies revealed that the Citrate buffer method was statistically significant and correlated with the Pearson coefficient r = 0.98. All the statistical analysis for this study was performed using GraphPad Prism 7.0.
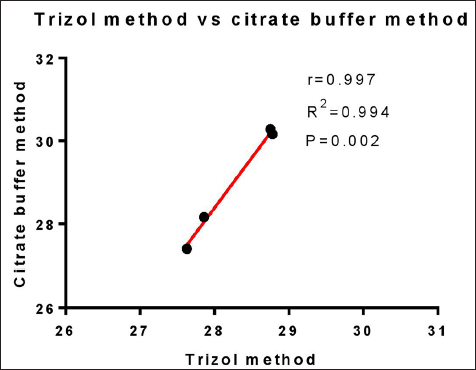 | Figure 7: Scatter plot for Cqs of TiLV gene expression with Pearson correlation analysis. The x-axis represents the Cq values obtained using the Citrate buffer method, while the y-axis represents the Cq values obtained using the Trizol method. The statistical correlation between both methods was compared here.
[Click here to view] |
4. DISCUSSION
Tissues from various organs are usually studied and interpreted in the investigation of the Tilapia Lake Virus. It is possible to study the disease using a variety of methods, but researchers should always attempt to understand the tissue abnormalities using qRT-PCR. It is simple to acquire pathological smears. They can provide information about the epithelium’s tissues and the changes that took place as a result of the host defense system. They are practical and affordable. To identify early changes in the organs, more specific detection is needed, which is qRT-PCR. The current study’s goal was to determine the most effective RNA extraction technique for obtaining samples efficiently and inexpensively for use in qRT-PCR [15]. In RNA samples that are intended to be used in qRT-PCR, digestion with DNase is necessary to get rid of any remaining DNA traces. Further purification procedures are necessary because DNase digestion involves the removal of extra salts and protein contaminants in the sample to improve the effectiveness of RNA for cDNA synthesis [10].
As mentioned earlier, despite variations in the quantity and quality of RNA obtained from the aforementioned methods, nearly all samples yielded positive results in qRT-PCR experiments. Even when the RNA isolated from infected fish was diluted to very low quantities, it still tested positive. RNA yield obtained from different sample types varied, likely due to variations in the total RNA content of each sample. It is important to note that false-positive and false-negative results can occur in amplification-based tests, including real-time and conventional RT-PCR methods that were used in this study. To ensure the accuracy of the assays, strict precautions and a variety of controls must be implemented [26].
Citrate buffer acts as a lysis and stabilization solution in this extraction method. It helps to disrupt cell membranes, solubilize proteins, and stabilize RNA, enabling efficient RNA extraction. The Citrate buffer breaks down cell membranes, releasing the cellular components into the solution. Citrate ions also help to stabilize RNA molecules by inhibiting RNA degradation enzymes, such as RNases. RNA can be separated from DNA and other molecules due to its varying polarity, which helps maintain the solution at a low pH condition [18].
The pH and ionic strength of the solutions used for spectrophotometric analysis can significantly affect the qualitative and quantitative determination of nucleic acids. For instance, RNA solubilized in water can alter the A260/280 ratio of the RNA preparation. In this study, all techniques utilized RNase-free water for RNA solubilization [27].
During RNA isolation, quality control is crucial, especially when dealing with small quantities of RNA but requiring large amounts for experiments such as microarrays. The citrate buffer-based RNA extraction method proved to be effective for isolating RNA from TiLV-infected Tilapia tissues, ensuring both quality and yield. This method avoids the use of harsh organic solvents and generates RNA free of genomic DNA, eliminating the need for DNase treatment. This is particularly significant for gene-expression studies as DNase treatment can be time-consuming and costly [10]. Moreover, the absence of genomic DNA is essential for downstream applications that require its removal. The citrate buffer-based RNA extraction method employs mild reagents, minimizing the introduction of additional contaminants to the isolated RNA. Although the Conventional approach is more accurate than the Citrate buffer-based method, the latter method has the additional benefit of employing inexpensive and safe reagents, allowing the experiment to be conducted at room temperature, not interfering with downstream activities and not requiring skilled personnel to perform experiments.
In conclusion, our study presents a novel and cost-effective RNA extraction method based on citrate buffer for the accurate diagnosis of TiLVD. This method offers advantages in terms of simplicity, cost-effectiveness, and environmental friendliness, making it a valuable tool for aquaculture industries and research institutions. The availability of high-quality RNA samples will contribute to a better understanding of TiLVD and facilitate the development of targeted control measures to mitigate the impact of this viral disease in Tilapia populations.
5. ACKNOWLEDGMENTS
The authors are grateful to the management of the Vellore Institute of Technology for providing the necessary facilities to carry out this study.
6. AUTHOR CONTRIBUTIONS
All authors made substantial contributions to conception and design, acquisition of data, or analysis and interpretation of data; took part in drafting the article or revising it critically for important intellectual content; agreed to submit to the current journal; gave final approval of the version to be published; and agree to be accountable for all aspects of the work. All the authors are eligible to be an author as per the international committee of medical journal editors (ICMJE) requirements/guidelines.
7. FINANCIAL SUPPORT AND SPONSORSHIP
This study was funded by Aquaculture Biotechnology Lab, VIT,Vellore.
8. CONFLICTS OF INTEREST
The authors report no financial or any other conflicts of interest in this work.
9. ETHICAL APPROVALS
This study does not involve experiments on animals or human subjects.
10. DATA AVAILABILITY
All the data is available with the authors and shall be provided upon request.
11. USE OF ARTIFICIAL INTELLIGENCE (AI)-ASSISTED TECHNOLOGY
The authors confirm that there was no use of artificial intelligence (AI)-assisted technology for assisting in the writing or editing of the manuscript and no images were manipulated using AI.
12. PUBLISHER’S NOTE
All claims expressed in this article are solely those of the authors and do not necessarily represent those of the publisher, the editors and the reviewers. This journal remains neutral with regard to jurisdictional claims in published institutional affiliation.
REFERENCES
1. Naylor RL, Goldburg RJ, Primavera JH, Kautsky N, Beveridge MCM, Clay J, et al. Effect of aquaculture on world fish supplies. Nature. 2000; 405(6790):1017-24.
2. Coad BW, Murray AM. Fishes of the World. Joseph S. Nelson. Can Field Nat. 2006;120(1):116.
3. Eyngor M, Zamostiano R, Tsofack JEK, Berkowitz A, Bercovier H, Tinman S, et al. Identification of a novel RNA virus lethal to tilapia. J Clin Microbiol. 2014;52(12):4137-46.
4. Tsofack JEK, Zamostiano R, Watted S, Berkowitz A, Rosenbluth E, Mishra N, et al. Detection of tilapia lake virus in clinical samples by culturing and nested reverse transcription-PCR. J Clin Microbiol. 2017;55(3):759-67.
5. Surachetpong, W, Dvm. Enhancing capacity/risk reduction of emerging Tilapia Lake Virus (TiLV) to African tilapia aquaculture: Intensive Training Course on TiLV Kenya in cooperation with Kenya Marine Fisheries Research Institute (KMFRI) and Kenya Fisheries Service (KeFS) 2. FAO/ASTF Project: GCP/RAF/510/MUL. Session: Diagnostic PCR method for Tilapia Lake Virus (TiLV); 2018.
6. Ferguson HW, Kabuusu R, Beltran S, Reyes E, Lince JA, del Pozo J. Syncytial hepatitis of farmed tilapia, Oreochromis niloticus (L.): a case report. J Fish Dis. 2014;37(6):583-9.
7. del-Pozo J, Mishra N, Kabuusu R, Cheetham S, Eldar A, Bacharach E, et al. Syncytial Hepatitis of Tilapia (Oreochromis niloticus L.) is associated with orthomyxovirus-like virions in hepatocytes. Vet Pathol. 2017;54(1):164-70.
8. Bacharach E, Mishra N, Briese T, Zody MC, Kembou Tsofack JE, Zamostiano R, et al. Characterization of a novel orthomyxo-like virus causing mass die-offs of tilapia. mBio. 2016;7(2):e00431-16.
9. Waiyamitra P, Piewbang C, Techangamsuwan S, Liew WC, Surachetpong W. Infection of Tilapia tilapinevirus in Mozambique Tilapia (Oreochromis mossambicus), a globally vulnerable fish species. Viruses. 2021;13(6).
10. Tavares L, Alves PM, Ferreira RB, Santos CN. Comparison of different methods for DNA-free RNA isolation from SK-N-MC neuroblastoma. BMC Res Notes. 2011;4(1):3.
11. Mészáros E. Comprehensive introduction to DNA extraction. Mol Biol Blog. 2021. Available from: https://www.integra-biosciences.com/china/en.
12. Saranya SR, Sudhakaran R. Report on prevalence of tilapia lake virus infection in tilapia fishes (Oreochromis niloticus). Biocatal Agric Biotechnol. 2020;27:101665.
13. Jaemwimol P, Sirikanchana K, Tattiyapong P, Mongkolsuk S, Surachetpong W. Virucidal effects of common disinfectants against tilapia lake virus. J Fish Dis. 2019;42(10):1383-9.
14. Hasson K, Fan Y, Reisinger T, Venuti J, Varner P. White-spot syndrome virus (WSSV) introduction into the Gulf of Mexico and Texas freshwater systems through imported, frozen bait-shrimp. Dis Aquat Organ. 2006;71:91-100.
15. Mônica Ghislaine Oliveira A, Pérez-Sayáns M, Padín-Iruegas ME, Reboiras-López MD, Suarez-Peñaranda JM, López-López R, et al. Comparison of RNA extraction methods for molecular analysis of oral cytology. Acta Stomatol Croat. 2016;50(2):108-15.
16. Xiang X, Qiu D, Hegele RD, Tan WC. Comparison of different methods of total RNA extraction for viral detection in sputum. J Virol Methods. 2001;94(1-2):129-35.
17. Heath . Low pH RNA isolation reagents, method, and kit. United States; 5,973,137. 1999.
18. Oñate-Sánchez L, Verdonk JC. Citrate-citric acid RNA isolation (CiAR) for fast, low-cost, and reliable RNA extraction from multiple plant species and tissues. Curr Protoc. 2021;1(12):e298.
19. Wozniak A, Cerda A, Ibarra-Henríquez C, Sebastian V, Armijo G, Lamig L, et al. A simple RNA preparation method for SARS-CoV-2 detection by RT-qPCR. Sci Rep. 2020;10(1):16608.
20. Fanson BG, Osmack P, Di Bisceglie AM. A comparison between the phenol–chloroform method of RNA extraction and the QIAamp viral RNA kit in the extraction of hepatitis C and GB virus-C/hepatitis G viral RNA from serum. J Virol Methods. 2000;89(1-2):23-7.
21. Kim TK. T test as a parametric statistic. Korean J Anesthesiol. 2015;68(6):540.
22. Zhang B, Chen K, Ni E. Comparison of three methods for extraction of HCV RNA in sera collected from individuals with hyperlipidemia, hyperbilirubinemia and hyperglobulinemia. J Virol Methods. 2015;212:44-6.
23. Roy D, Tomo S, Modi A, Purohit P, Sharma P. Optimising total RNA quality and quantity by phenol-chloroform extraction method from human visceral adipose tissue: a standardisation study. MethodsX. 2020;7:101113.
24. Deng MY, Wang H, Ward GB, Beckham TR, McKenna TS. Comparison of six RNA extraction methods for the detection of classical swine fever virus by real-time and conventional reverse transcription–PCR. J Vet Diagn Invest. 2005;17(6):574-8.
25. Possebon FS, Ullmann LS, Malossi CD, Miodutzki GT, da Silva EC, Machado EF, et al. A fast and cheap in-house magnetic bead RNA extraction method for COVID-19 diagnosis. J Virol Methods. 2022;300:114414.
26. Deng MY, Wang H, Ward GB, Beckham TR, McKenna TS. Comparison of six RNA extraction methods for the detection of classical swine fever virus by real-time and conventional reverse transcription–PCR. J Vet Diagn Invest. 2005;17(6):574-8.
27. Wilfinger WW, Mackey K, Chomczynski P. Effect of pH and ionic strength on the spectrophotometric assessment of nucleic acid purity. Biotechniques. 1997;22(3):474-81.
28. Tellez-Bañuelos MC, Santerre A, Casas-Solis J, Zaitseva G. Endosulfan increases seric interleukin-2 like (IL-2L) factor and immunoglobulin M (IgM) of Nile tilapia (Oreochromis niloticus) challenged with Aeromona hydrophila. Fish Shellfish Immunol. 2010;28(2):401-5.
