1. INTRODUCTION
Mangroves are vital in coastal management and protection. Throughout the world, mangroves face the constant threat of habitat loss due to human settlement and the usage of mangroves as timber, fodder, fuel, and medicine. Mangroves are the stronghold of the coastal ecosystem and also the bioshield that prevents the coast from eroding due to untoward climatic conditions. The peculiarity of mangroves lies in their ability to adapt to varying weather and salinity conditions. The tolerance levels of salinity vary for each mangrove species, and they develop strategies to face the harsh environmental conditions anatomically, morphologically, and physiologically [1,2].
India has a total mangrove cover of 4,992 km2, making up about 0.15% of the country’s total landmass. The total mangrove cover in Kerala is 9 km2 [3]. Mangroves are spread throughout Kerala’s west coast. Mangrove cultivation is now being encouraged throughout the state for its high productivity, which corresponds to nesting, breeding grounds, grazing, and shelter areas for a wide range of biota [4-7]. Mangroves also ought to be a great source of carbon sinks, which aid in climate change mitigation and adaptation [8]. In Kerala, these mangroves are progressing on the island system’s sediments according to the state’s special geographical system.
Bruguiera gymnorrhiza of the family Rhizophoraceae is the basal genus in the same family and is a rare species found in Kerala, with confirmed presence mainly in the southern districts of Kerala [9]. It is commonly known as black mangrove as it propagates well in the mud and also on the seaside of estuaries in places supplemented with plenty of water and free of frost. When there is a high accumulation of salt in the mangrove swamps, these mangroves develop a special mechanism to excrete these salts, that is, the salts get deposited in their old leaves and are later desiccated from the main plants. These plants are also economically important as they provide a reliable source of timber. Throughout the world, these are used to make boats as mangrove woods are waterproof. These are also used in the tanning process as the bark is rich in tannin and yields a black dye [10].
With technological advancements, classical techniques for the assessment of genetic variabilities such as comparative anatomy, morphology, embryology, and physiology have greatly been coupled with molecular techniques. Marker-based polymorphism in biomolecules has led to research in many disciplines such as plant systematics and molecular biology. Even though it is an important plant of the mangrove community, there are not many studies on B. gymnorrhiza in India. There is a remarkable variation in their flowering pattern and morphological structure. It was already established using random amplified polymorphic DNA (RAPD) that B. gymnorrhiza and B. cylindrica are more closely related than B. lyliadica from the Karimunjawa islands of Indonesia [11]. When compared to the efficacy of RAPD and inter simple sequence repeat (ISSR) markers, RAPD was found to be more productive than ISSR [12]. This may be due to the uniform distribution of RAPD markers along the genome while the ISSR marker is found in between microsatellite loci. Genetic markers are immune to environmental stresses and are profusely available. This biological technique has greatly helped in studying mangrove phylogeny [13]. Genetic diversity is the characteristic of an ecosystem and gene pool, which are ubiquitous for survival [14]. A. marina collected from the Arabian region found the genetic structure correlating with geographical distance, indicating significant lineage diversification. The mangroves at the northern edge were also exposed to severe environmental fluctuations. It is evident from this that rapid diversification has led mangroves to adapt, highlighting peripheral environment as a significant driver of lineage diversity [15]. It is essential to have studies on RAPD and ISSR because these markers provide vital information on conserving this mangrove species. Mangroves are often considered for their ecological significance as they occur along the shorelines and withstand high saline conditions, continuous flooding, and low soil aeration. Due to many anthropogenic activities, mangroves worldwide are decreasing, leading to a major shift in the paradigm of ecological balance. Due to such an imbalance, there will be a deprivation in biodiversity. Understanding a particular species inside a mixed population through morphological characteristics remains a hurdle, and, in such a situation, molecular markers come in handy. DNA technique in conservation is a thoughtful process as it uncovers diversity in the genetic makeup of population. ISSR is utilized without prior knowledge of DNA sequence [16]. The main advantage of ISSR markers is their good reproducibility, affordability, and less technical complexity, making them an excellent candidate for population genetic study [17,18]. Considering all this, the present work is aimed at measuring the genetic polymorphism levels of B. gymnorrhiza across the four southern districts of Kerala with different salinity levels. We also aim to assess the sustainability of the species on the west coast and the decline of the species in the specified study area; for this, we used two molecular markers, ISSR and RAPD, for assessing the genetic diversity.
2. MATERIALS AND METHODS
2.1. Collection Site
B. gymnorrhiza was collected from their naturally occurring habitat along Kerala’s west coast. In northern Kerala, the species is found only in the districts of Kollam, Alappuzha, Cochin, and Thrissur [19]. The species Bruguiera is not uniformly distributed, it is found in mixed populations, and demographic interference also plays a key role in disturbing the natural distribution. It is found in Cochin (10°01’39” N 76°12’49” E), Thrissur (10°14’54” N 76°12’13” E), Alappuzha (9°46’37” N 76°17’12” E), and Kollam (8°55’27” N 76°33’08” E) [Figure 1]. From the islands of Kollam, Cochin, and Thrissur, the leaf samples were collected from four locations. In Kollam, the salinity was found to be 5.33 ppt, which tends to have the highest salinity. The other three districts were found to be inferior to this.
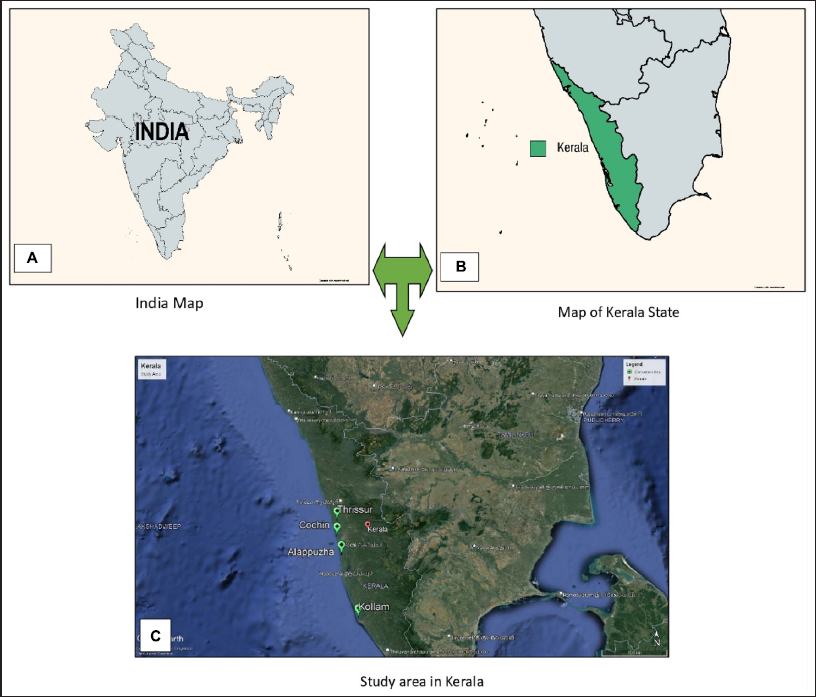 | Figure 1: Geographical map of India and Kerala: (A) India, (B, C) the state of Kerala and four areas of sample collection.
[Click here to view] |
2.2. DNA Isolation
The young leaves from B. gymnorrhiza were taken for DNA isolation. The leaves were weighed from all four locations and washed thoroughly using double-distilled water. DNA isolation using NucleoSpin® Plant II Kit (Macherey-Nagel) was employed, and the plant tissues were macerated using liquid nitrogen in a mortar and pestle under hygienic conditions. DNA isolation was done from the leaf samples collected from the four districts of northern Kerala.
2.3. Molecular Marker Analysis (RAPD and ISSR)
A total of 10 decamer RAPD and 10 ISSR primers were selected to assess the selected plant’s genetic diversity [Tables 1 and 2]. Each reaction amalgam of 15 µl contained 1.5 μl of 2X dreamtaq reaction buffer, 1 μl of primer, 0.2 μl of dreamtaq polymerase, 8.8 μl of Millipore water, and 1 µl of 25 ng template DNA. The amplification was carried out in a PCR thermal cycler (GeneAmp PCR System 9700, Applied Biosystems). Initially, at the start of the cycles, the DNA was subjected to denaturation at 94°C for 5 min. The 35 cycles of the denaturation period were set to 45 s, the primer annealing period was 72°C for 1.30 min for RAPD and 50°C for 1 min for ISSR, and the temperature for the annealing period was adjusted based on the individual primer’s melting temperature (Tm). The end cycle of the primer extension was done at 72°C for 10 min, and the temperature of the reaction mixture was brought down to 4°C. The final PCR products were separated by gel electrophoresis. The amplified PCR products were determined in 1.2 % (w/v) agarose gel electrophoresis with 1× Tris–acetic acid–EDTA (TAE) buffer (pH 8). The agarose gel was mixed with 0.5 mg/ml ethidium bromide. The size of amplified fragments was evaluated using a 100 bp DNA ladder (HiMedia). The DNA bands were visualized in a Genei transilluminator, and the image was captured under UV light using a Gel documentation system (Bio-Rad) and analyzed using various statistical software.
Table 1: RAPD primers used.
| S. No. | Primer | Nucleotide Sequence | Annealing
Temperature (°C) |
|---|
| 1 | OPA-01 | 5’ CAGGCCCTTC 3’ | 72 |
| 2 | OPA-02 | 5’ TGCCGAGCTG 3’ | 72 |
| 3 | OPA-04 | 5’ AATCGGGCTG 3’ | 72 |
| 4 | OPA-05 | 5’ AGGGGTCTTG 3’ | 72 |
| 5 | OPA-07 | 5’ GAAACGGGTG 3’ | 72 |
| 6 | OPB-01 | 5’ GTTTCGCTCC 3’ | 72 |
| 7 | OPB-03 | 5’ CATCCCCCTG 3’ | 72 |
| 8 | OPB-05 | 5’ TGCGCCCTTC 3’ | 72 |
| 9 | OPC-01 | 5’ TTCGAGCCAG 3’ | 72 |
| 10 | OPE-01 | 5’ CCCAAGGTCC 3’ | 72 |
Table 2: List of ISSR primers.
| S. No. | Primer | Nucleotide Sequence | No. of Nucleotides | Annealing Temperature (°C) |
|---|
| 1 | ISSR 808 | 5′ AGAGAGAGAGAGAGAGC 3′ | 17 | 50 |
| 2 | ISSR 811 | 5′ GAGAGAGAGAGAGAGAC 3′ | 17 | 50 |
| 3 | ISSR 812 | 5′ GAGAGAGAGAGAGAGAA 3′ | 17 | 50 |
| 4 | ISSR 818 | 5′ CACACACACACACAG 3′ | 15 | 50 |
| 5 | ISSR 830 | 5′ TGTGTGTGTGTGTGTGG 3′ | 17 | 50 |
| 6 | ISSR 834 | 5′ AGAGAGAGAGAGAGAGYT 3′ | 18 | 50 |
| 7 | ISSR 836 | 5′ AGAGAGAGAGAGAGAGYA 3′ | 18 | 50 |
| 8 | ISSR 840 | 5′ GAGAGAGAGAGAGAGAYT 3′ | 18 | 50 |
| 9 | ISSR 841 | 5′ GAGAGAGAGAGAGAGAYC 3′ | 18 | 50 |
| 10 | ISSR 842 | 5′ GAGAGAGAGAGAGAGAYG 3′ | 18 | 50 |
2.4. Statistical Inference
The appearance of bands was considered to make a binary matrix and calculated by using the multivariate analysis program NTSYS-PC [20]. A similarity matrix was created according to Jaccard’s coefficient [21]. By combining cluster analysis and the unweighted pair group with the arithmetic mean (UPGMA) method [22], using NTSYS version 2.1, the phylogenetic tree was constructed. The PAST 3.20 [23] statistical software was used for calculating the mean of the observed number of alleles per loci (na) and the mean effective number of alleles per loci (ne). Nei’s genetic diversity value (h), Shannon’s information index (I), and marker index (MI) were also calculated [24].
3. RESULTS
3.1. RAPD Analysis
Out of the 10 primers used, a total of 145 bands were produced, with an average of 7 bands ranging from 5 to 12 bands for each primer. Of these, 14 were polymorphic bands, which make up 3.5% of the loci that were found to be polymorphic. The band size range was 100–3000 bp. Of these 10 primers, polymorphism was found in primers OPA 07, OPB 01, OPB 05, OPC 01, and OPE 01 [Figure 2].
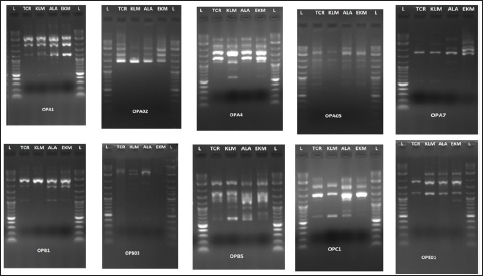 | Figure 2: RAPD gel image of four genotypes of B. gymnorrhiza with 10 primers as listed in Table 1. L: ladder (100–3000 bp). TCR: Thrissur. KLM: Kollam. ALA: Alappuzha. EKM: Cochin
[Click here to view] |
3.2. ISSR Analysis
Out of the 10 primers used, a total of 191 amplified bands were produced, of which 26 bands were polymorphic. The total polymorphism exhibited was 13.6%. The band expression varied from primer to primer as the minimum was 9 and the maximum was 40. The band size range was 100–3000 bp. The highest number of polymorphic bands were produced by the primers ISSR 808, ISSR 830, ISSR 840, ISSR 841, and ISSR 842. The amplified gel image patterns are shown in Figure 3.
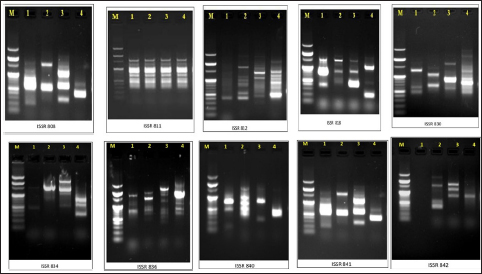 | Figure 3: ISSR gel images of four genotypes of B. gymnorrhiza with 10 primers as listed in Table 2. M: ladder (100–3000 bp). 1, Kollam; 2, Alappuzha; 3, Cochin; and 4, Thrissur.
[Click here to view] |
3.3. Statistical Inference
In B. gymnorrhiza, the RAPD analysis generated a total of 145 bands, of which 14 were polymorphic. The mean of the detected number of alleles per loci (na) was 2.000, and the mean effective number of alleles per loci (ne) was 1.7686 [Table 3]. Nei’s genetic diversity index (h) was 0.4304 (SD = 0.0526) and Shannon’s information index (I) was 0.6208 (SD = 0.0562). The polymorphic information content (PIC) value for each location was also assessed; a high PIC value of 0.4591 was noted from the sample collected at Kollam and a low PIC value of 0.2187 from Alappuzha. The average PIC value of the four locations was recorded at 0.3541. The mean coefficient of genetic differentiation (Gst) value of 0.132 denotes a moderate level of population differentiation, and the gene flow (Nm) in the population was recorded at 3.269. The similarity matrix constructed using the NTSYS-PC 2.10e software showed that Jaccard’s similarity index ranged from 0.60 to 0.72, with a mean value of 0.67. Dendrograms representing both RAPD and ISSR and RAPD and ISSR combined were made based on genetic distances with the UPGMA algorithm represented [Figure 4]. The sample from the least saline zone is clustered in the same clade. The sample from high salinity is distant from others.
Table 3: Diversity indices used in the study.
| S. No. | RAPD (Mean Value With Standard Deviation) | Diversity Indices | ISSR (Mean Value With Standard Deviation) |
|---|
| 1 | 2.000±0.000 | Na | 5.600±0.516 |
| 2 | 1.768±0.154 | Ne | 1.837±0.117 |
| 3 | 0.430±0.052 | h | 0.453±0.036 |
| 4 | 0.620±0.056 | I | 1.093±0.053 |
| 5 | 0.430±0.002 | Ht | 0.453±0.001 |
| 6 | 0.373±0.005 | Hs | 0.381±0.001 |
| 7 | 0.132 | Gst | 0.159 |
| 8 | 3.269 | Nm | 2.633 |
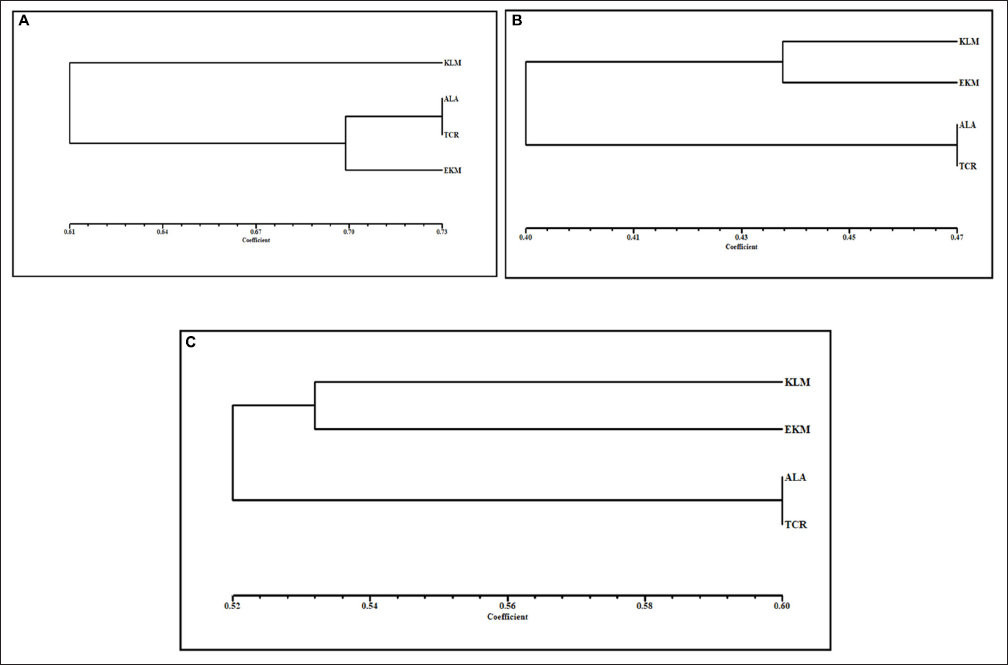 | Figure 4: Dendrogram of B. gymnorrhiza. (A) RAPD analysis; (B) ISSR; and (C) RAPD and ISSR combined using the UPGMA method. KLM: Kollam. ALA: Alappuzha. EKM: Cochin. TCR: Thrissur.
[Click here to view] |
In total, the ISSR analysis generated 191 bands, of which 26 were polymorphic. The na, ne, h, and I for the samples of this marker were also cataloged as 5.600, 1.8374, 0.4537 (SD = 0.0360), and 1.0936 (SD = 0.0538). The highest PIC value was recorded at Kollam (0.498) and the least at Cochin (0.465). The average PIC value was 0.484. The Gst was 0.159, and the estimate of gene flow (Nm) was 2.633. The similarity matrix was constructed based on UPGMA with Jaccard’s similarity matrix. The least saline zones of Alappuzha and Thrissur were clustered together.
The principal component analysis for both RAPD and ISSR markers was recorded. In the ISSR marker, the eigenvalue ranged from 0.67 to 1.31, where the highest percentage variance was recorded in Kollam (32.75) and the least in Thrissur (16.87). In the RAPD marker, the eigenvalues range from 0.08–0.31, with a high variance percentage in Kollam (43.09) and the least in Thrissur (11.16).
N., observed no. of alleles; N., expected no. of alleles; h, Nei’s genetic diversity index; I, Shannon’s information index; H., heterozygosity; H., average heterozygosity; Gst, degree of genetic differentiation; N., a gene flow estimate.
4. DISCUSSION
It is a prerequisite for understanding the morphology, ecology, and physiology of mangroves before starting any conservation projects for the mangrove. Mangroves can thrive in extreme salt conditions and provide a perfect coastal wall and breeding grounds for many fishes, migratory birds, and epibenthic organisms [25]. The diversity of mangroves varies heavily across various species depending on the habitat conditions. So, it is essential to give accountable data using the molecular markers that aid in describing the broad allocation of individual species and unlocking the genetic potential for evolution prospects of mangrove conservation [26]. A. marina is one of the most studied mangrove species compared with others, and Avicennia is also a salt-tolerant mangrove compared with less salt-tolerant Bruguiera [27]. The Sundarbans in West Bengal, India, is the most studied site [28], which makes our study site of novel interest. A deep understanding of the flow of genetic information in the natural environment is essential to assess the differentiation of geographical and climatic areas using molecular markers. Unlike morphological markers, molecular markers have stability as they do not tend to vary with climatic factors and often provide accurate data on the conservation aspect.
In the present work with RAPD and ISSR markers, the degree of polymorphism was high in ISSR-mediated genetic diversity analysis (13.6%). When compared with Merope angulata, the mangrove associated with both AFLP and ISSR markers combined revealed a polymorphism level of 42.93% [29]. The relatedness of genetic polymorphism expression can be observable from the dendrograms constructed based on similarity. The higher degree of polymorphism is attributed to B. gymnorrhiza when analyzed with an ISSR marker, making it an efficient ROS scavenger and suitable for thriving in more stressed conditions. The degree of polymorphism can be seen as an activator of certain genes for the efficient production of ROS scavengers. ROS are actively produced by the plant to carry out its daily activities, but it requires a proper switch to control its regulation and polymorphism may be the answer for the plant to adapt to varying environmental conditions. The plant had an effective ROS scavenging mechanism at higher salinity as evident from Kollam, which proves to be authentic evidence that the plant is highly sustainable [30]. Genetic diversity is an essential requirement for species to adapt to changing environments and for a progressing world of microbiota [31].
With these markers, a high level of genetic diversity was recorded with an average Nei score of 0.43 and 0.45, which was much higher than that of the normal dicotyledonous plant (0.18) [32]. The Gst value for RAPD (0.13) and ISSR (0.15) indicates a moderate level of variation among the population. The values for estimating gene flow Nm < 1, Nm > 1 and Nm > 4 were classified as low, moderate, and extensive gene flow. Regarding this, the values obtained for gene flow (Nm) based on mean Gst were 2.633 for ISSR and 3.269 for RAPD, indicating a moderate level of gene flow among the populations. These amplifications uncovered diverseness independent of each marker from various genomic regions. RAPD represents the widespread regions of the genome, while the ISSR interprets the short tandem repeats of the genome. The clustering of the isolates was almost similar to RAPD, ISSR, and both RAPD and ISSR combined. These dendrograms help categorize and cluster them according to the area of collection. The samples from Alappuzha and Thrissur are grouped into one because of their geographical vicinity or similar climatic conditions. ISSR marker technology is highly reliable for its specificity in bringing out genetic diversity, structure, and the relationship between genetic and geographical distance, and the knowledge of genetic variability at the species level is an essential prerequisite for survival and development [33]. The molecular tools employed in this study to generate heterogeneousness through the accessions of B. gymnorrhiza were compared with several parameters. Kollam district had a higher degree of genetic diversity compared with that of other districts where samples were collected. However, based on greater PIC values (RAPD = 0.354; ISSR = 0.484), Shannon diversity index (RAPD = 0.620; ISSR = 1.093), percentage polymorphism (RAPD = 3.5; ISSR = 13.6), and marker index (RAPD = 0.39; ISSR = 0.50), the ISSR markers were considerably more detailed than RAPD in the profiling of genetic diversity in B. gymnorrhiza compared with A. marina using RAPD markers collected from the Tamil Nadu, Andhra Pradesh, and West Bengal; the highest genetic diversity was from Tamil Nadu compared with the other two states [34]. Soil composition and topography can be crucial factors in the determination of diversity [35] from the samples collected from each location. Human interference can also contribute to the variation in species. The chances of inbreeding between the same individuals can be taken into account in places like Alappuzha and Thrissur, which has led to the decline in the genetic diversity in the region. The major limitation of the study can be the limited number of B. gymnorrhiza in the state, which in turn inhibits variability among the population, and accessibility to certain locations in the vicinity is a herculean task as there is no proper transport or road system. The population of B. gymnorrhiza in both these locations is very sparse, and without proper scientific care can go extinct shortly. From the above results, we can conclude that RAPD can be used to analyze the interpopulation genetic differences but ISSR tends to be the best marker for the in situ conservation program. Our sampling areas require an in situ approach to conservation to restore the ecological balance and species diversity in the mangrove population.
5. CONCLUSION
This study underscores the critical importance of B. gymnorrhiza on Kerala’s west coast, emphasizing the threats posed by anthropogenic activities and environmental disasters, leading to a decline in their population. Salinity fluctuations, influenced by unpredictable climate conditions, further disrupt their vegetation patterns and functions. The genetic data obtained through ISSR and RAPD markers reveal important insights. B. gymnorrhiza from Kollam and Cochin exhibit similarities, while Alappuzha and Thrissur are closely related. Location-specific diversity arises from topography, climate, and human interference. Kollam shows low inbreeding likelihood due to population heterozygosity, in contrast with high inbreeding risks in Thrissur and Alappuzha, potentially jeopardizing genetic diversity and leading to species extinction. Cochin faces severe habitat loss, with mangrove clearing for economic activities intensifying. ISSR markers emerge as crucial for species protection and conservation, advocating for an in situ conservation model in the northern districts of Kerala’s west coast. In conclusion, this study provides vital genetic markers for understanding B. gymnorrhiza’s variation along Kerala’s west coast. Urgent action is recommended to safeguard populations from further degradation, emphasizing the need for conservation efforts in the face of environmental challenges.
6. ACKNOWLEDGMENTS
The authors thank the PSG College of Arts & Science for providing the facilities to carry out the work, and Mr. Mohan Raj, Department of Plant Science, Madurai Kamaraj University, for timely assistance. They also thank the Tamil Nadu Forest Department for their support.
7. AUTHOR CONTRIBUTIONS
All authors contributed to the study’s conception and design. Material preparation, data collection, and analysis were performed by SS and HS. The first draft of the manuscript was written by SS, and all authors, including AA and SV, commented on previous versions of the manuscript. All authors read and approved the final manuscript.
8. FINANCIAL SUPPORT AND SPONSORSHIP
The authors thank the PSG College of Arts & Science for the research grant provided during the preparation of this manuscript.
9. CONFLICT OF INTEREST
The authors report no financial or any other conflicts of interest in this work.
10. ETHICAL APPROVAL
This study does not involve experiments on animals or human subjects.
11. DATA AVAILABILITY
All the data is available with the authors and shall be provided upon request.
12. USE OF ARTIFICIAL INTELLIGENCE (AI)-ASSISTED TECHNOLOGY
The authors confirm that there was no use of artificial intelligence (AI)-assisted technology for assisting in the writing or editing of the manuscript and no images were manipulated using AI.
13. PUBLISHER’S NOTE
All claims expressed in this article are solely those of the authors and do not necessarily represent those of the publisher, the editors and the reviewers. This journal remains neutral with regard to jurisdictional claims in published institutional affiliation.
References
1. Ankure S, Tah M, Mondal S, Murmu AK, Naskar S. Adaptive evolution of leaf anatomical features in mangrove Rhizophoraceae cues differential strategies of salt tolerance. Flora. 2023;300:152225. [CrossRef]
2. Srikanth S, Lum SKY, Chen Z. Mangrove root: adaptations and ecological importance. Trees. 2016;30:451–65. [CrossRef]
3. Indian State Forest Report. 2021. Available from: https://fsi.nic.in/forest-report-2021-details
4. Nagelkerken I, Blaber S, Bouillon S, Green P, Haywood M, et al. The habitat function of mangroves for terrestrial and marine fauna: a review. Aquat Bot. 2008;89:155–85 [CrossRef]
5. Lee SY, Primavera JH, Dahdouh-Guebas F, McKee K, Bosire JO, et al. Ecological role and services of tropical mangrove ecosystems: a reassessment. Glob Ecol Biogeogr. 2014;23:726–43. [CrossRef]
6. Carugati L, Gatto B, Rastelli E, Martire ML, Coral C, Greco S, et al. Impact of mangrove forests degradation on biodiversity and ecosystem functioning. Sci Rep. 2018;8:13298. [CrossRef]
7. Primavera JH, Friess DA, Van Lavieren H, Lee SY. The Mangrove ecosystem. In: C. editor. Sheppard World Seas: An Environmental Evaluation: Volume II: The Indian Ocean to the Pacific. Cambridge, MA: Academic Press; 2018. P. 18–51.
8. Duarte CM, Losada IJ, Hendriks IE, Mazarrasa I, Marba` N. The role of coastal plant communities for climate change mitigation and adaptation. Nat Clim Change. 2013;3:961–8. [CrossRef]
9. Ratheesh N, Manoj KB, Lekshmi S. Diversity of Mangroves in Asramam, Kollam District, Kerala. J Adv Biol Sci. 2017;4(1):20–4.
10. Sudhir S, Arunprasath A, Vel VS. A critical review on adaptations, and biological activities of the mangroves. J Nat Pest Res 2022;2022:100006. [CrossRef]
11. Susilo M. Genetic variation of three bruguiera species from Karimunjawa Islands detected by using RAPD molecular markers. Asian J Plant Sci. 2018;17(4):198–203.
12. Moulin MM, Rodrigues R, Gonçalves LSA, Sudré CP, Pereira MG. A comparison of RAPD and ISSR markers reveals genetic diversity among sweet potato landraces (Ipomoea batatas (L.) Lam.). Acta Sci Agron. 2012;34:139–47.
13. Mehta PA, Sivaprakash K, Parani M, Venkataraman G, Parida AK. Generation and analysis of expressed sequence tags from the salt-tolerant mangrove species Avicennia marina (Forsk) Vierh. Theor Appl Genet. 2005;110(3):416–24 [CrossRef]
14. de Lafontaine G, Napier JD, Petit RJ, Hu FS. Invoking adaptation to decipher the genetic legacy of past climate change. Ecology. 2018;99(7):1530–46. [CrossRef]
15. Friis G, Smith EG, Lovelock CE, Ortega A, Marshell A, Duarte CM, et al. Rapid diversification of grey mangroves (Avicennia marina) driven by geographic isolation and extreme environmental conditions in the Arabian Peninsula. Mol Ecol 2024;33:1–21.e17260.
16. Buhroo ZI, Bhat MA, Ganai NA, Kamili AS, Bali GK, Aziz A. An efficient protocol for the inter-simple sequence repeat (ISSR) marker approach in population genetic studies. J Entomol Zool 2018;6(4):597–600.
17. Chen JM, Liu X, Gituru WR, Wang JY, Wang QF. Genetic variation within the endangered quillwort Isotoma petraea (Lobeliaceae). Aquat Bot. 2005;8:775–89 [CrossRef]
18. Li F, Xia N. Population structure and genetic diversity of an endangered species, Glyptostrobus pensilis (Cupressaceae). Bot Bull Sin. 2005;46:155–62.
19. Vidyasagaran K, Madhusoodanan V. Distribution and plant diversity of mangroves in the west coast of Kerala, India. J Biodivers Environ Sci. 2021;4:2220–6663.
20. Rohlf FJ, Ntsys PC. Numerical taxonomy and multivariate analysis system Version I. 80-Setauket, NY, Exeter S; 1993. Available from: www.exetersoftware.com/downloads/ntsysguide21.pdf
21. Jaccard P. Nouvelles researches sur la distribution forale. Bull Soc Sci Nat. 1998;44:223–70.
22. Sneath PH, Sokal RR. Numerical taxonomy. The principles and practice of numerical classification. San Francisco, CA: W. H. Freeman; 1973.
23. Hammer Ø, Harper DAT, Ryan PD. PAST: paleontological statistics software package for education and data analysis. Palaeont Electr. 2001;4(1):9.
24. Amiryousefi A, Hyvönen J, Poczai P. iMEC: online marker efficiency calculator. App Plant Sci. 2018;6(6):e01159. [CrossRef]
25. Kathiresan K, Bingham BL. Biology of mangroves and mangrove ecosystems. Adv Mar Biol. 2001;40:81–251. [CrossRef]
26. Spalding MD, Blasco F, Field CD. (editors). World Mangrove Atlas. Okinawa: The International Society for Mangrove Ecosystem; 1997. p. 178.
27. Maguire TL, Peakall R, Saenger P. Comparative analysis of genetic diversity in the mangrove species Avicennia marina (Forsk.) Vierh. (Avicenniaceae) detected by AFLPs and SSRs. Theor Appl Genet. 2002;104:388–98.
28. Dasgupta N, Nandy P, Sengupta C, Das S. RAPD and ISSR marker mediated genetic polymorphism of two mangroves Bruguiera gymnorrhiza and Heritiera fomes from Indian Sundarbans in relation to their sustainability. Physiol Mol Biol Plants. 2015;21(3):375–84. [CrossRef]
29. Jena SN, Verma S, Nair KN, Srivastava AK, Misra S, Rana TS. Genetic diversity and population structure of the mangrove lime (Merope angulata) in India revealed by AFLP and ISSR markers. Aquat Bot. 2015;120:260–7.
30. Tripathy BC, Oelmüller R. Reactive oxygen species generation and signalling in plants. Plant Signal Behav. 2012;7(12):1621–33. [CrossRef]
31. Hauffe HC, Barelli C. Conserve the germs: the gut microbiota and adaptive potential. Conserv Genet. 2019;20(1):19–27. [CrossRef]
32. Hamrick JL, Godt MJW. Effects of life history traits on genetic diversity in plant species. Philos Trans R Soc Lond B Biol Sci Philos T R Soc B. 1996;351:1291–8. [CrossRef]
33. Shen XL, Guo WZ, Zhu XF, Yuan YL, Yu JZ, Kohel RJ, et al. Molecular mapping of QTL for fibre qualities in three diverse lines in upland cotton using SSR markers. Mol Breeding. 2005;15:169–81. [CrossRef]
34. Hazarika D, Thangaraj M, Sahu SK, Kathiresan K. Genetic diversity in three populations of Avicennia marina along the eastcoast of India by RAPD markers. J Environ Biol. 2013;34(3):663.
35. Yang Q, Zhang H, Wang L, Ling F, Wang Z, Li T, et al. Topography and soil content contribute to plant community composition and structure in subtropical evergreen-deciduous broadleaved mixed forests. Plant Divers. 2021;43(4):264–74. [CrossRef]
