
1. INTRODUCTION
Glycogen phosphorylase (GP), an essential homodimer enzyme, is responsible for maintaining glucose homeostasis and hepatic glycogen levels. GP is now seen as an efficient target for allosteric regulation by pharmacological agents as it contains multiple potential effector binding sites, which can be exploited to design innovative GP inhibitors [1]. The active or catalytic site is positioned in the middle of each monomer, accompanied by the pyridoxal-5’-phosphate (PLP) coenzyme. It forms a bond with glycogen, glucose-1-phosphate, glucose, and an effective glucose analog inhibitor known as N-acetyl-beta-D-glucopyranosyl amine (NBG). Molecular docking studies have demonstrated that a few flavonoids and NBG analogs possess a strong affinity for binding to the active site [2,3]. The exposure or occlusion of the catalytic site and enzyme activity depend on the structural transition of human liver GP (HLGPa) in its active and inactive conformations. HLGPa complexed with AMP denotes the active conformation (R state), whereas HLGPa complexed with the potent glucose analog inhibitor NBG denotes the enzyme’s inactive conformation (T state).
The 280s loop in the active site of GPa plays a prominent role in regulating the binding of the substrate and inhibitor. The concerted movement of loops at the domain interface regulates the substrate’s access to the catalytic site. On inhibitor binding to the active site, the 280s loop/gate (residues 282–287) between α helix 7 (residues 261–274) and α helix 8 (residues 289–314) remains closed and stabilized [3]. Hence, the substrate glycogen’s access to the catalytic site is blocked, which favors the T-state conformation of the enzyme. When transitioning takes place from the T state to the R state, the gate residues become disarranged, unfolding the channel and displacing Asp283 with Arg569 at the catalytic site. This opening of the gate or active site crevice recreates the recognition site and allows direct access of glucose and phosphate substrates to the catalytic site, thereby promoting a suitable electrostatic environment for the essential cofactor PLP [3].
The glycogen storage site lies on the protein surface and allows the binding of oligosaccharides and glycogen. Compounds such as cyclodextrins and maltopentaose are known to bind at the glycogen storage site [3]. The novel allosteric site situated at the dimer interface accommodates the effective antidiabetic drug CP320626 [3]. The allosteric or AMP binding site is situated at the dimeric interface, approximately 30 Å away from the catalytic site. It accommodates AMP, adenosine triphosphate (ATP), inosine monophosphate (IMP), and glucose-6-phosphate. Acyl ureas have been identified as a new class of AMP site inhibitors of HLGPa using structure-based design approaches combined with pharmacophore and 3D QSAR models [4]. The inhibitor or purine binding site is located on the enzyme surface and joined to the catalytic site through a 12 Å channel. It binds purine analogs such as caffeine, nucleosides (adenosine and inosine), nucleotides (AMP, IMP), ATP, flavin mononucleotide, and NADH. Flavin compounds such as riboflavin display the highest affinity by interacting with a portion of the adjacent hydrophobic surface. Flavopiridol binds to the inhibitor site in the muscle GPa (mGP) and GPb, but the liver GPa (lGP) shows extreme selectivity for inhibitors [5]. These binding sites provide an opportunity to design a benign drug to alleviate the effects of GP and attain glucose homeostasis.
In mammals, the three GP isozymes are predominantly expressed in the brain (bGP), skeletal muscle (mGP), and liver (lGP). Furthermore, these GP isoforms share nearly 80% amino acid sequence identity and almost 100% homology at the catalytic site. Hence, finding more specific and effective inhibitors targeting the catalytic site of lGP remains a crucial subject of research [6]. The present study focuses on the exploration of new inhibitors for the active site of HLGPa, which may have the potential to lower the glucose output in the liver. Computer-aided drug discovery has emerged as the most rapid, cost-effective, and reliable approach to identifying safe and efficacious antidiabetic drug candidates. We used GPa to dock structural analogs of NBG and computationally predetermined a pool of absorption, distribution, metabolism, excretion, and toxicity (ADMET) properties in this study. The corresponding docked results were visualized using Discovery Studio. A second-step analysis was done by 100 ns molecular dynamics (MD) simulations for the best docked compound and the standard NBG to observe the stable interactions of the protein-ligand complexes. This study aimed to examine the affinity of selected ligands and their intermolecular interactions at the active site of HLGPa. Our current in silico approach reports befunolol as a safe agent that can be additionally reviewed for the in vitro and in vivo antidiabetic activity of GP against type 2 diabetes (T2D).
2. MATERIALS AND METHODS
2.1. Software
We initiated our study with the support of the software detailed in this paper. The 3D structure of HLGPa was retrieved from the RCSB PDB database [https://www.rcsb.org/structure/1FC0]. NBG structural analogs were downloaded from PubChem (https://pubchem.ncbi.nlm.nih.gov) and ZINC [https://zinc.docking.org/substances/home/] databases. The docked protein-ligand complexes were created, and their docking poses were analyzed using AutoDock4.2 (MGL Tools version 1.5.6) (https://autodock.scripps.edu/download-autodock4/). Open Babel (https://github.com/openbabel/openbabel/releases/tag/openbabel-3-1-1) was used to convert the chemical file formats of the ligands from sdf format to pdb format. Web servers such as SwissADME (http://www.swissadme.ch/), ADMETlab2.0 (https://admetmesh.scbdd.com/), PreADMET (https://preadmet.webservice.bmdrc.org/), and ProTox-II (https://tox-new.charite.de/protox_II/) were used for ADMET profiling [7-9]. BIOVIA Discovery Studio visualizer v21.1.0.20298 (https://discover.3ds.com/discovery-studio-visualizer-download) and ADT4.2 software were used for 2D and 3D visualization of the best docking poses of protein-ligand complexes as well as their intermolecular interactions. MD simulations of the docked complexes were performed using Schrödinger Maestro 13.3 software.
2.2. Ligands Selection
Seven ligands based on their structural similarity to the reference compound NBG were chosen: Befunolol, Pivaloyl-D-galactosylamine, Acifran, Benmoxin, Ciclazindol, Amixetrine, and Carpindolol.
2.3. Molecular Docking
The X-ray crystallographic structure of the inactivated form of HLGPa (PDB ID: 1FC0) was downloaded from the RCSB PDB in PDB format with a resolution of 2.40 Å [10]. We executed the entire molecular docking experiment using the ADT4.2 software suite. As GP is a homodimer, only the monomer (chain A) was considered for the docking study, and the other chain was deleted in the initial step. The heteroatoms and occasional water molecules were deleted from the protein’s crystal structure for further analysis. Essential polar hydrogen atoms and Kollman charges were added to the protein, and Gasteiger charges were computed for the selected ligand atoms. A grid box was generated to dock the ligand at the active site of the target GPa. The docking parameters were set by increasing the number of GA runs to 100 and the population size to 300. The 2D and 3D visualization and analysis of the docked protein-ligand complexes were carried out using Discovery Studio.
2.4. ADMET Profiling
Physicochemical parameters like molecular weight (MW), topological polar surface area (TPSA), molar refractivity (MR), number of hydrogen bond donors (nHBD), number of hydrogen bond acceptors (nHBA), LogS, LogD, and LogP were calculated on the ADMETlab predictor. The pharmacokinetic parameters such as blood–brain barrier (BBB) permeation, gastrointestinal (GI) absorption, cytochrome P450 (CYP450) enzyme inhibition, plasma glycoprotein (Pgp) substrate, Pgp inhibitor, skin permeation (LogKp), and drug-likeness were assessed using the SwissADME tool. Other parameters like hepatotoxicity, carcinogenicity, immunotoxicity, Ames mutagenicity, cytotoxicity, hERG blockers, lethal dose (LD50), and acute toxicity class were predicted using the ProTox-II server to estimate the toxicity profile of the selected ligands [11]. Molecular properties analyzed with these web tools were used to select the best drug candidate from the seven compounds.
2.5. MD Simulations
To further validate the best configurations obtained from AutoDock results, we used Schrödinger’s Glide and Prime molecular mechanics generalized bound and surface area (MMGBSA) to redock and predict the binding energy of all compounds. The MD simulations were run with a duration of 100 ns for both candidate compounds and standard compounds using the Desmond module from Schrödinger Maestro 13.3 software. The root mean square deviation (RMSD) and root mean square fluctuation (RMSF) figures quantified the binding stability of the proposed ligand-protein complexes.
3. RESULTS AND DISCUSSION
3.1. Molecular Docking Analysis
Binding energy is evaluated through docking and is considered a primary parameter for assessing ligand-protein affinity. Binding energy and ligand affinity are inversely related to each other. A low binding energy signifies a good affinity of the ligand for the protein, making it a desirable drug candidate for further investigation. Table 1 details the binding energies and intermolecular interactions between the test ligands, NBG, and the target GPa. In our current findings, befunolol displayed the lowest binding energy of −8.83 kcal/mol, creating a strong fit with GP and a stable inhibitor-protein complex compared to NBG (−6.20 kcal/mol). Other test ligands had higher docking scores than NBG, except for pivaloyl-D-galactosylamine [Table 1]. Befunolol showed molecular interactions with Leu494, Lys544, Glu654, Lys655, and Pro658 [Figure 1a] in the active site of GP. The bioavailability score describes the permeability and bioavailability of a drug molecule [12]. Both befunolol and NBG were within the acceptable range of 0.55 [Table 1], which is a good indicator of an active drug. Figure 1a and b display befunolol-GPa and NBG-GPa complexes in 2D and 3D, respectively. Figure S1 illustrates the interactions of GPa with other molecules.
Table 1: Binding energies of the test ligands docked with HLGPa predicted by Autodock and Prime MMGBSA.
| Molecule | Binding energy (kcal/mol) | Residual amino acid interactions | Bioavailability | Drug score | |
|---|---|---|---|---|---|
| Autodock | Prime MMGBSA | ||||
| NBG | −6.20 | −31.779798 | Leu136, Asn284, His377, Glu672, Ser674, Gly675 | 0.55 | 0.30 |
| Befunolol | −8.83 | −40.74846323 | Leu494, Lys544, Glu654, Lys655, Pro658 | 0.55 | 0.95 |
| Ciclazindol | −8.73 | −20.8015797 | Val567, Lys568, Arg569, Tyr648, Thr676, Lys680, Phe681 | 0.55 | 0.91 |
| Carpindolol | −8.05 | −36.10973782 | Gly135, Leu136, Asn284, His341, His377, Ala383, Lys574, Thr676 | 0.55 | 0.90 |
| Benmoxin | −7.89 | −24.4503342 | Glu88, Leu136, Asn282, Asp283, Phe285, Arg292, His341 | 0.55 | 0.74 |
| Acifran | −7.33 | −1.046325638 | Lys568, Lys574, Tyr648, Glu672, Thr676, Gly677, Lys680 | 0.85 | 0.61 |
| Amixetrine | −7.26 | −29.92297481 | Leu136, Phe285, Arg292, His341 | 0.55 | 0.70 |
| Pivaloyl-D Galactosylamine | −5.90 | −21.3258291 | Gln96, Glu120, Leu494, Cys495, Asn541, Lys544, Pro658, Ala659 | 0.55 | 0.29 |
HLGPa: Human liver GP, MMGBSA: Molecular mechanics generalized born and surface area, NBG: N-acetyl-beta-D-glucopyranosyl amine.
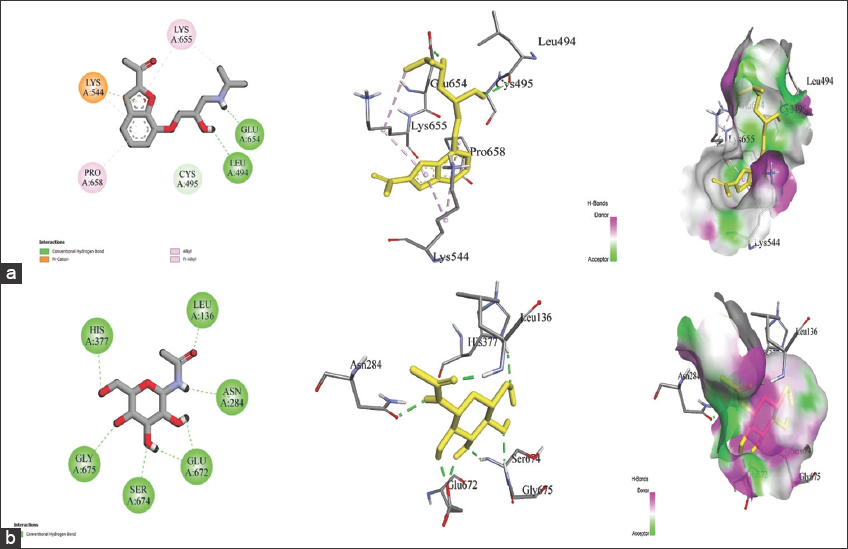 | Figure 1: Post docking analysis visualized in 2D and 3D animated poses representing ligand-protein interactions, and Hydrogen bond surface that forms the binding pocket for Befunolol and N-acetyl-beta-D-glucopyranosyl amine (NBG) (a) Befunolol and GP complex (b) NBG and GP complex [Click here to view] |
3.2. ADMET Analysis
3.2.1. Physicochemical properties
We noticed that all the molecules satisfied Lipinski’s rule of five (RO5) [13], demonstrating their drug-like nature and oral bioavailability. It is suggested that any violation of RO5 could result in poor absorption or low permeability of the molecule [14]. Befunolol was found to obey all parameters of Lipinski’s rule: MW of 291.34 Da, 5 HBA, and 2 HBD [Table S1]. The MLogP value for befunolol was 0.50, suggesting good oral and intestinal absorption compared to NBG (−2.61) [Table S1].
The MW and TPSA of a molecule strongly influence its ability to permeate through the biological barrier. This permeability decreases with an increase in MW and TPSA. All the test ligands had a low MW [Table S1], which enhances the rate of absorption in the body. It has been reported that a molecule with a TPSA >140 Å results in poor absorption, while those with a TPSA of 60 Å results in good absorption [15]. We observed that befunolol showed 71.70 Å TPSA and 84.26% Abs, whereas NBG showed 119.25 Å TPSA and 67.85% Abs [Table S1]. The lower the LogS value, the higher the solubility, which increases the rate of absorption. For befunolol, the calculated results of LogS (−2.922) and LogD (2.377) suggested moderate solubility and good distribution of the compound [Table S1]. NBG and pivaloyl-d-galactosylamine had poor LogD values (−1.708 and −1.056, respectively), probably due to fewer functional groups [Table S1].
3.2.2. Drug metabolism and pharmacokinetics studies
Befunolol was predicted to have moderate Caco-2 permeability (−4.95 log cm/s) [Table S2]. Interestingly, befunolol may not act as a drug transporter of the Pgp substrate, suggesting that there is no drug-drug interaction, while NBG acts as a drug transporter of the Pgp substrate [Table S2], which could cause a pharmacokinetic drug-drug interaction, triggering unwanted side effects or toxicity due to accumulation and lower clearance (CL) [16]. The half-life (T1/2) and CL of befunolol were positive compared to NBG [Table S2]. Human intestinal absorption (HIA) reveals the pathway of orally administered drug molecules from the intestine into the bloodstream. The efficacy of drug molecules relies on their T1/2, which reflects the effective dose. The predicted HIA value of befunolol (0.029) showed good absorption and could be considered an effective and promising drug candidate [Table S2]. The distribution of molecules was analyzed for plasma protein binding (PPB) and BBB permeability parameters. Befunolol could permeate the BBB to reach the molecular targets in the central nervous system, and the PPB value was found to be 75.32% [Table S2], indicating a high pharmacological effect that could contribute to its ability to work as a drug.
CYP450 family enzymes are important determinants of toxicity and therapeutic efficacy [17]. The molecules or drugs enter the circulation, undergo degradation by these enzymes in the liver, and are excreted via urination. Inhibiting these enzymes results in abnormal biodegradation of the drug molecule, as CYP450 enzymes play a crucial role in detoxification [18]. Befunolol was predicted to be a non-inhibitor of the CYP450 enzyme [Table S3] and also indicated low permeability to the skin (LogKp of −6.64 cm/s) [Table S3].
3.2.3. Toxicity analysis
The ability to possess non-toxic effects is the main factor in choosing a therapeutic candidate molecule [19]. ProTox-II toxicity predictions showed all molecules to be non-mutagenic, non-cytotoxic, and non-immunotoxic [Table S4], thereby considering them non-fatal. Only benmoxin showed carcinogenicity and hepatotoxicity [Table S4]. Based on acute toxicity, these compounds were categorized into six classes: class I and II, which are fatal if consumed; class III, which is toxic if consumed; class IV, which is harmful if consumed; class V, which is perhaps harmful if consumed; and class VI, which is non-toxic. The median lethal dose (LD50) values were computed in the range of 159–14388 mg/kg [Table S4]. Befunolol was confirmed to be a non-hERG blocker [Table S4], as blocking of hERG (the K+ channel responsible for the correct rhythm of the heart) signaling leads to cardiac arrest.
3.3. MD Simulation Studies
Of all the compounds tested, befunolol displayed the strongest affinity for HLGPa (−40.74 kcal/mol), as predicted by Prime MMGBSA [Table 1]. Furthermore, we used a 100 ns MD simulation to examine the binding stability and intermolecular interactions of the topmost compound (Befunolol-HLGPa) and the standard (NBG-HLGPa). The simulation results of these docked complexes were described with RMSD, RMSF, and protein-ligand contacts.
3.3.1. RMSD and RMSF analysis
RMSD and RMSF provide insight into the conformational changes, dynamic fluctuations, and stabilization of the selected protein-ligand complexes throughout the MD simulation event compared to the unbound protein structure. RMSD plots of the docked complexes are depicted in Figure 2a and b. The protein backbone fluctuations in response to NBG binding are displayed in the region of 2.1–2.8 Å during the 20–100 ns interval [Figure 2a]. As shown in Figure 2b, the protein initially showed fluctuations at around 2.2–2.8 Å during 5–42 ns in response to befunolol binding. Thereafter, the complex stability of befunolol-HLGPa was sustained for around 55–85 ns [Figure 2b], with minimal fluctuations after the 85 ns simulation period. The RMSF graph depicts the intermolecular interactions of the ligands NBG and befunolol with the target protein [Figure 2c and d]. Protein RMSF peaks represent fluctuations in protein residues during the simulation process. The docked complexes show low fluctuations (small peaks) due to ligand interactions with the protein structure. Two large peaks with RMSF values of >4.5 Å and 4.2 Å are seen in the NBG-bound protein [Figure 2c]. Three large peaks at 3.7 Å, >4.5 Å, and 4.2 Å are observed in the protein complexed with befunolol [Figure 2d], indicating no ligand-binding residues in these regions of the protein backbone.
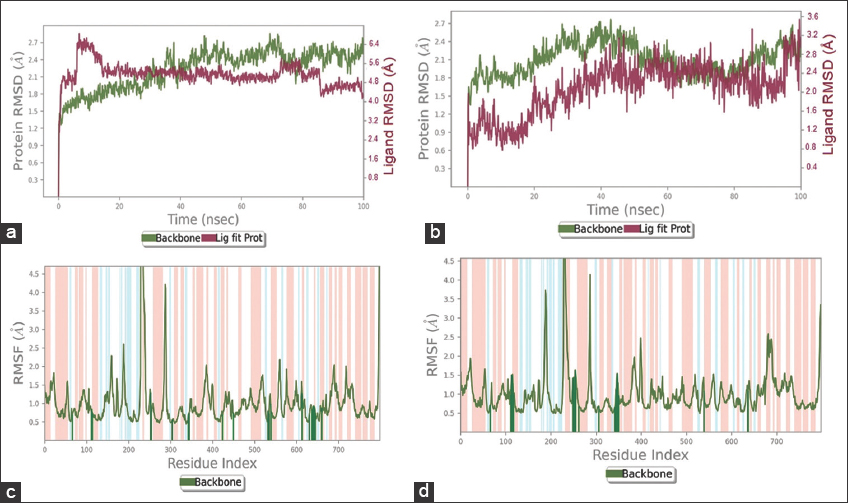 | Figure 2: Root mean square deviation (RMSD) and root mean square fluctuation (RMSF) graphs of the protein-ligand complex during 100 ns molecular dynamics simulation. (a) RMSD of protein and N-acetyl-beta-D-glucopyranosyl amine (NBG) (b) RMSD of protein and befunolol. (c) Protein RMSF plot in response to NBG binding (d) Protein RMSF plot in response to befunolol binding. Protein is shown in green color and ligand in pink color. Red and blue backgrounds represent the alpha-helical and beta-strand regions respectively. The protein residues that interact with the ligand are marked with green-colored vertical bars. [Click here to view] |
3.3.2. Protein-ligand contacts
The bar charts in Figure 3a and b reveal favorable protein-ligand contacts such as hydrogen bonds, hydrophobic bonds, and ionic and water bridges within the binding pocket. Befunolol exhibited varied interactions with the protein compared with NBG. Moreover, the residual interactions that remained for more than 30% of the simulation time throughout the MD trajectory are shown in Figure 3c and d.
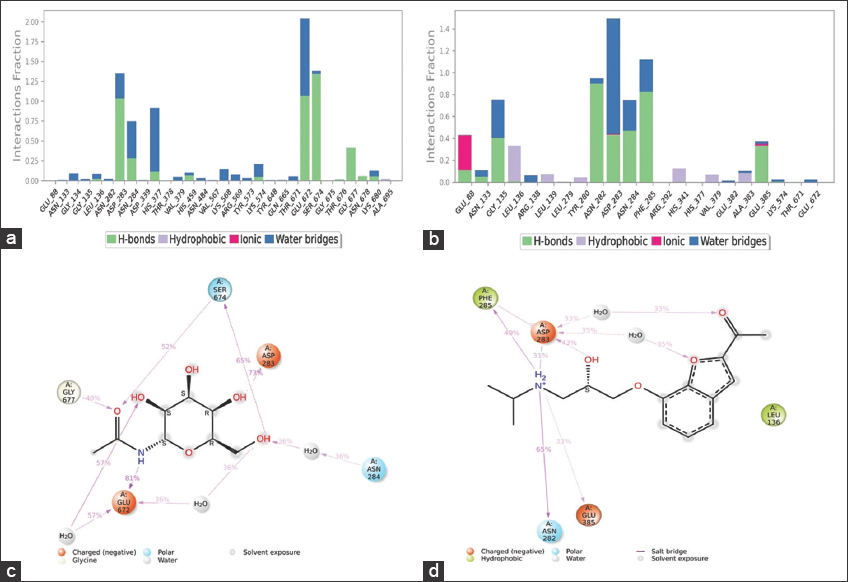 | Figure 3: Protein residue interactions with the ligand monitored throughout the simulation and their 2D interactions. (a) and (c) Protein- N-acetyl-beta-D-glucopyranosyl amine contacts (b) and (d) Protein-Befunolol contacts. [Click here to view] |
4. CONCLUSION
GP has turned out to be a justified target to modulate the blood glucose levels in T2D. The active site of the enzyme GPa accommodates analogs of D-glucose, such as NBG. This in silico docking study found befunolol to have the highest binding affinity and best drug score. ADME analysis and toxicity profiling showed that befunolol is a safe drug with no toxicity warnings. Further validation by MD analysis revealed more stable interactions between befunolol and protein structure. Befunolol produced more effective results than NBG in our study, making it a potential inhibitor targeting GPa and a better antidiabetic lead compound. Moreover, in vitro and in vivo studies must be conducted to validate befunolol’s effectiveness in treating T2D.
5. AUTHOR CONTRIBUTIONS
All authors made substantial contributions to conception and design, acquisition of data, or analysis and interpretation of data; took part in drafting the article or revising it critically for important intellectual content; agreed to submit to the current journal; gave final approval of the version to be published; and agreed to be accountable for all aspects of the work. All the authors are eligible to be an author as per the International Committee of Medical Journal Editors (ICMJE) requirements/guidelines.
6. FUNDING
The funding was provided by University Grants Commission (No.F.30- 546/2021(BSR); dated: 29/07/2021); Bojja KS is grateful for the fellowship received from DST-INSPIRE-IF210095.
7. CONFLICTS OF INTEREST
The authors report no financial or any other conflicts of interest in this work.
8. ETHICAL APPROVALS
This study does not involve experiments on animals or human subjects.
9. DATA AVAILABILITY
All the data is available with the authors and shall be provided upon request.
10. PUBLISHER’S NOTE
All claims expressed in this article are solely those of the authors and do not necessarily represent those of the publisher, the editors and the reviewers. This journal remains neutral with regard to jurisdictional claims in published institutional affiliation.
11. USE OF ARTIFICIAL INTELLIGENCE (AI)-ASSISTED TECHNOLOGY
The authors declares that they have not used artificial intelligence (AI)-tools for writing and editing of the manuscript, and no images were manipulated using AI.
REFERENCES
1. Ekstrom JL, Pauly TA, Carty MD, Soeller WC, Culp J, Danley DE, et al. Structure-activity analysis of the purine binding site of human liver glycogen phosphorylase. Chem Biol 2002;9:915-24. [CrossRef]
2. Mechchate H, Es-Safi I, Bourhia M, Kyrylchuk A, El Moussaoui A, Conte R, et al. In-vivo antidiabetic activity and in-silico mode of action of LC/MS-MS identified flavonoids in Oleaster leaves. Molecules 2020;25:5073. [CrossRef]
3. Somsák L, Czifrák K, Tóth M, Bokor E, Chrysina ED, Alexacou KM, et al. New inhibitors of glycogen phosphorylase as potential antidiabetic agents. Curr Med Chem 2008;15:2933-83. [CrossRef]
4. Klabunde T, Wendt KU, Kadereit D, Brachvogel V, Burger HJ, Herling AW, et al. Acyl ureas as human liver glycogen phosphorylase inhibitors for the treatment of Type 2 diabetes. J Med Chem 2005;48:6178-93. [CrossRef]
5. Oikonomakos NG, Schnier JB, Zographos SE, Skamnaki VT, Tsitsanou KE, Johnson LN. Flavopiridol inhibits glycogen phosphorylase by binding at the inhibitor site. J Biol Chem 2000;275:34566-73. [CrossRef]
6. Rocha S, Aniceto N, Guedes RC, Albuquerque HM, Silva VL, Silva AM, et al. An in silicoand an in vitro inhibition analysis of glycogen phosphorylase by flavonoids, styrylchromones, and pyrazoles. Nutrients 2022;14:306. [CrossRef]
7. Daina A, Michielin O, Zoete V. SwissADME:A free web tool to evaluate pharmacokinetics, drug-likeness and medicinal chemistry friendliness of small molecules. Sci Rep 2017;7:42717. [CrossRef]
8. Dong J, Wang NN, Yao ZJ, Zhang L, Cheng Y, Ouyang D, et al. ADMETlab:A platform for systematic ADMET evaluation based on a comprehensively collected ADMET database. J Cheminform 2018;10:29. [CrossRef]
9. Banerjee P, Eckert AO, Schrey AK, Preissner R. ProTox-II:A webserver for the prediction of toxicity of chemicals. Nucleic Acids Res 2018;46:W257-63. [CrossRef]
10. Rath VL, Ammirati M, LeMotte PK, Fennell KF, Mansour MN, Danley DE, et al. Activation of human liver glycogen phosphorylase by alteration of the secondary structure and packing of the catalytic core. Mol Cell 2000;6:139-48. [CrossRef]
11. Drwal MN, Banerjee P, Dunkel M, Wettig MR, Preissner R. ProTox:A web server for the in silico prediction of rodent oral toxicity. Nucleic Acids Res 2014;42:W53-8. [CrossRef]
12. Martin YC. A bioavailability score. J Med Chem 2005;48:3164-70. [CrossRef]
13. Lipinski CA, Lombardo F, Dominy BW, Feeney PJ. Experimental and computational approaches to estimate solubility and permeability in drug discovery and development settings. Adv Drug Deliv Rev 2001;46:3-26. [CrossRef]
14. Pathak M, Ojha H, Tiwari AK, Sharma D, Saini M, Kakkar R. Design, synthesis and biological evaluation of antimalarial activity of new derivatives of 2,4,6-s-triazine. Chem Cent J 2017;11:132. [CrossRef]
15. Clark DE. Rapid calculation of polar molecular surface area and its application to the prediction of transport phenomena. 1. Prediction of intestinal absorption. J Pharm Sci 1999;88:807-14. [CrossRef]
16. Hollenberg PF. Characteristics and common properties of inhibitors, inducers, and activators of CYP enzymes. Drug Metab Rev 2002;34:17-35. [CrossRef]
17. Van Waterschoot RA, Schinkel AH. A critical analysis of the interplay between cytochrome P450 3A and P-glycoprotein:Recent insights from knockout and transgenic mice. Pharmacol Rev 2011;63:390-410. [CrossRef]
18. Guengerich FP. Cytochrome P-450 3A4:Regulation and role in drug metabolism. Annu Rev Pharmacol Toxicol 1999;39:1-17. [CrossRef]
19. Sadeghi M, Moradi M, Madanchi H, Johari B. In silico study of garlic (Allium sativum L.)-derived compounds molecular interactions with α-glucosidase. In Silico Pharmacol 2021;9:11. [CrossRef]