
1. INTRODUCTION
Strawberry is a major cash crop that is grown all over the world and is suitable for cultivation under a wide range of growing conditions including open fields, polyhouses, kitchen gardens, vertical farming, and hydroponics. The term “vertical farming” was first invented in 1915 by American geologist Gilbert Ellis Bailey which was primarily a sort of rooftop farming. However, in 1951 the concept of vertical farming changed to building towers of hydroponic units. The development of hydroponics and greenhouses had further expanded the concept of vertical farming; however, in 1991, Professor Dickson Despommier made an attempt to bring the food production units nearer to consumers as a way of decreasing carbon footprint. His constant efforts have resulted in the development of a blueprint of vertical farming and he is known as the founding father of modern vertical farming.
According to its size, layout, type of building, density, degree of control, and location, vertical farming is defined in a variety of ways [1]. The goal of vertical farming today is to use every square inch of space, whether in a city or a village, to grow as much food as possible for the world’s hungry people. The vertical farming system ensures a high degree of resource utilization efficiency which might be due to space optimization through the utilization of vertical space; water optimization through precision (drip) irrigation approach and closed-loop system; nutrient optimization through reduced nutrient runoff or leaching or fixation and through targeted delivery of nutrients; and light optimization through application of energy-efficient LED lighting which is major constraints of traditional farming system. Overall, vertical farming ensures a sustainable and resource-efficient model for precision or conservation and hi-tech agriculture. The framework of vertical farming has completely changed over the years. Today, it is a well-liked farming technique used all over the world. India is also seeing a rise in vertical farming. Due to the high net returns, vertical farming is attracting a lot of business interest. Vertical farming can be done on rooftops, balconies, buildings, and warehouses [2].
Building upward is another name for vertical farming, which is regarded as one of the most innovative agricultural technologies for minimizing the amount of land used [3]. According to Butturini and Marcelis [4], vertical gardening is the practice of growing plants on layers that are either vertically inclined or vertically stacked. This system aids in the production of foods that are stacked vertically. When this farming technique is applied, more crops can be grown in the same field [5]. In the United States and Canada, leafy greens (57%) are the most frequently planted crop, followed by tomatoes, flowers, and microgreens [6]. Using a vertical farming system, the cultivation area can be increased by 3–4 times, and a lot of healthy, high-quality fresh food can be produced all year [7]. The availability of resources that the crop can use such as water, nutrients, and lighting is significantly influenced by the plant spacing in vertical farming and is the impact reflected in the growth and yield of the plants [8].
The availability of solar radiation to each level of verticals is the major challenge in vertical farming. It has also been observed that very few research works have been done on growing strawberries under vertical farming using artificial light. A few researchers studied the impact of light on plant growth and a plant needs light for how much period for good vegetative growth and reproduction. There is limited information on the vegetative growth, flowering, fruiting, and yield parameters of strawberry under a vertical farming system. To fill this research gap and to generate knowledge regarding ideal growing conditions for strawberries under vertical farming systems using artificial light present investigation was planned.
2. MATERIALS AND METHODS
2.1. Experimental Area and Materials
2.1.1. Experimental site
The study was initiated in December at Agricultural Farm, School of Agriculture, Lovely Professional University, Phagwara, Punjab (India), during 2021–2023. The experimental area was located latitudinally around 31014’41” N and longitudinally around 75042’4” E at an altitude of 234 m from mean sea level in the Kapurthala district of Punjab region.
2.1.2. Varietal attributes
The well-established commercial cultivar, “Winter Dawn” was taken to carry out a study on the productivity of strawberry under a vertical farming system under outdoor conditions. This cultivar is well suited for the vertical farming system as the plant size is small (height-17 cm and spread 26 cm) with good yield (more than 500 g fruits per plant) so a high yield can be obtained at closer planting which is a key attribute for the vertical farming system. Further, it is resistant to Colletotrichum crown rot whereas moderately resistant to Botrytis and anthracnose fruit rot diseases.
2.2. Experimental Design and Details
2.2.1. Treatment details
The vertical structure consisted of four levels, namely, first layer (ground) (L1), second layer (L2), third layer (L3), and fourth Layer (top) (L4). The verticals were subjected to two light conditions, i.e., natural light (NL) and artificial full spectrum light (AFSL) of different durations. Different levels of verticals were subjected to an artificial supply of light for different time durations to meet out the requirement of minimum intensity of light at every level. The available light intensity was measured using a lux meter and the value was converted in μmol s-1m-2 using 0.0185 as the calibration factor. The additional light duration for 0 h (D0), 2 h (D1), 4 h (D2), and 6 h (D3) was given to the strawberry plants. The treatment combinations, consisting of levels of verticals, nature of light provided, and duration of AFSL are depicted below:
2.2.2. Climate and growing media
In the Punjab region, only a few areas are suitable for the cultivation of strawberry because it is a subtropical area with humid and hot conditions. The optimum temperature recorded for the cultivation was 18–22°C. Punjab also receives monsoons from both southwest and northeast directions from August to February.
2.2.3. Vertical farming system
Strawberry was cultivated in the rack-type vertical system which was made of vertically stacked layers. It consists of an iron rack of 2 feet wide and 4 feet long having four levels fitted with an iron frame. Each level is 2 feet apart vertically and has grow bags of dimension 4 feet × 2 feet (0.743 sqm). The AFSL of 22W (length 2 feet) was installed just below every level and provided to plants for different hours according to the needs of the plant. The light emitting diode (LED) (warm white and cool white diodes) grow tubes of 22W, replicating the sun’s spectrum, were used as a source of AFSL which was emitting visible region of the spectrum (approximately 400–700 nm in wavelength). The schematic of the experimental setup is illustrated in Figure 1.
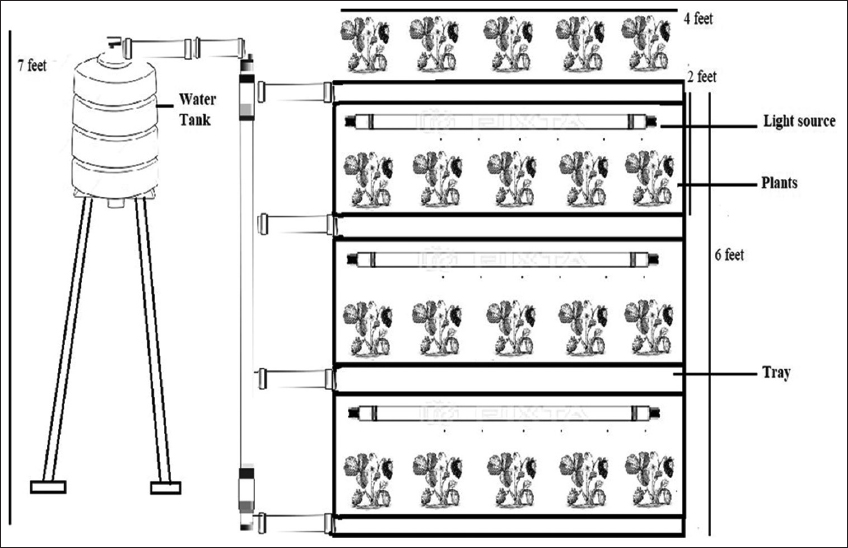 | Figure 1: Schematic of the experimental setup. [Click here to view] |
2.2.4. Agronomic practices
In the vertical system, the growing media was a composite mixture of sand, cocopeat, and vermicompost (3:2:1). The pH of the growing media was 6.4 with an electrical conductivity of 2.96 dSm-1. Planting was done at a spacing of 20 cm × 25 cm accommodating 15 plants in one rack. The fertilizer was applied through foliar application of N: P:K (21:21:21) at the rate 80:40:40 g per 0.743 sqm area at 15-day intervals. The water was provided through a drip connected with a water tank.
2.3. Observations Recorded
2.3.1. Plant growth parameters
The average plant height (cm), average number of leaves per plant, average petiole length (cm), and average plant spread (cm) were observed for each plant at 30, 60, and 90 days after planting. Plant height was taken from the collar region to the tip of the longest runner whereas plant spread was measured in East-West and North-South directions across the crown of the plant using a measuring scale. The leaves on each plant were counted manually and an average value was used for statistical analysis. The leaves of strawberry are borne along the crown on petioles (leafstalks) arranged in in spiral fashion. The petiole length of each leaf on a plant was measured from the base at the crown to the point of connectivity of leaflets using a measuring scale and the mean was taken as the average petiole length per leaf.
| Treatments | Levels of verticals | Duration of AFSL | Available light intensity |
|---|---|---|---|
| T1 | Fourth (Top) Level (L4) | No AFSL (D0) | 208.37–209.96 μmol s-1m-2 |
| T2 | Third Level (L3) | No AFSL (D0) | 175.15–178.55 μmol s-1m-2 |
| T3 | Second Level (L2) | No AFSL (D0) | 158.66–160.37 μmol s-1m-2 |
| T4 | First (Bottom) Level (L3) | No AFSL (D0) | 152.87–155.55 μmol s-1m-2 |
| T5 | Third Level (L3) | 2 h (D1) | 203.54–204.94 μmol s-1m-2 |
| T6 | Second Level (L2) | 4 h (D2) | 175.41–177.79 μmol s-1m-2 |
| T7 | First (Bottom) Level (L3) | 6 h (D3) | 159.12 –160.95 μmol s-1m-2 |
*Since the experiment was under outdoor conditions all the treatments have received natural light.
2.3.2. Flowering and fruiting parameters
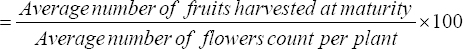
The number of days to bud formation, days to flowering (complete opening of flowers), and days to maturity were counted as a number of days from the date of planting. The floral buds and flowers present on each plant were counted after 20 days, 40 days, 55 days, 70 days, and 90 days of planting whereas the fruit count was done at the time of each harvesting and the total number of fruits per plant was estimated as the sum of each harvesting. The average number of buds, average number of flowers, and average number of fruits (berry) were estimated after dividing the total buds, flowers, and fruits count by the number of plants taken under observation in each replication. The fruit set percent was estimated using the formula given herewith.
 |
2.3.3. Yield and related parameters
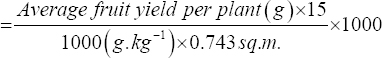
Fruit harvesting was done manually at 5–6 days intervals. The weight of 10 randomly selected fruits from each plot was measured using electronic balance and the average berry weight was estimated and presented in grams (g). The fruit volume was measured in cc (cubic centimeter or mL) using a measuring cylinder. The total fruit weight of harvested fruits from all the plants was divided by a number of plants in treatment to observe the average yield of fruit (berry) in grams per plant. The average fruit weight per plant was used to calculate the fruit yield from 1000 sq. m. of vertical farming system using the given formula and the estimated yield was expressed in kg per 1000 sq.m. (there were 15 plants in the experimental area [0.743 sq.m.] of vertical rack).
 |
2.4. Statistical Analysis
The data were statistically analyzed using MS Excel and OPSTAT software. The mean values of observations from three replications in each treatment were subjected to analysis for randomized complete block design to evaluate the statistical significance for variation due to treatments as explained by Gomez and Gomez [9]. The recorded mean of all the quantitative traits for each replication was exposed to statistical analysis for testing the significance of variation among different levels of verticals and the light duration by F-test [10].
3. RESULTS AND DISCUSSION
3.1. Average Plant Height of Strawberry
The observations recorded for average plant height [Table 1] were significantly affected by levels of vertical structure and the duration of AFSL. The plants at the top or fourth level (T1) have grown better in the absence of AFSL; however, the average height of plants at lower levels was at par when subjected with AFSL in T5, T6, and T7. At 90 days of planting, the highest plant height (20.17 ± 0.455 cm and 19.98 ± 0.26 cm) was observed with a maximum duration of AFSL in T6 (4 h at L2) and T7 (6 h at L1), respectively, which were 1.25 and 1.32 times (T3 and T4, respectively) higher than the plants grown at the same level under the availability of NL only. Strawberry plants grown under full spectrum light demonstrated noticeable improvements in their growth compared to those subjected to NL conditions only. The optimized light spectrum provided by full spectrum LEDs facilitated photosynthesis and stimulated overall plant development, resulting in increased height and a wider plant spread [11]. The light-induced nutrient uptake depends on fluctuating light quality which is sensed by the photoreceptors of the plants [12] and is enhanced due to the development of a photosynthetic sink for nutrients in leaves [13]. Uddin et al. [14] in their study revealed that LED lights increased the plant height which is somehow similar to our study.
Table 1: Average plant height (cm) of strawberry plants grown at different levels of verticals under different treatments.
| Treatments | At 30 days after planting | At 60 days after planting | At 90 days after planting | ||||||
|---|---|---|---|---|---|---|---|---|---|
| 2022 | 2023 | Pooled | 2022 | 2023 | Pooled | 2022 | 2023 | Pooled | |
| T1 | 13.19±0.274a | 13.82±0.069ab | 13.50±0.153ab | 22.81±0.37a | 23.49±0.468a | 23.15±0.41a | 17.67±0.285b | 17.97±0.384bc | 17.82±0.33b |
| T2 | 13.09±0.197a | 14.25±0.191a | 13.67±0.134a | 18.37±0.154c | 19.48±0.183c | 18.93±0.168c | 14.55±0.222d | 15.67±0.285c | 15.11±0.251c |
| T3 | 11.72±0.117b | 12.8±0.029c | 12.26±0.054c | 17.43±0.439d | 18.89±0.254cd | 18.16±0.342cd | 15.62±0.09c | 16.73±0.019c | 16.18±0.037c |
| T4 | 12.05±0.047b | 13.03±0.388c | 12.54±0.204c | 17.09±0.044de | 18.33±0.094d | 17.71±0.046d | 14.70±0.234cd | 15.57±0.11c | 15.13±0.169c |
| T5 | 13.14±0.266a | 13.58±0.2b | 13.36±0.074ab | 21.59±0.167b | 21.12±0.164b | 21.36±0.164b | 18.10±0.522b | 18.26±0.784b | 18.18±0.604b |
| T6 | 13.03±0.174a | 13.43±0.137bc | 13.23±0.149b | 17.39±0.041de | 18.52±0.358d | 17.95±0.166d | 19.19±0.205a | 21.16±0.707a | 20.17±0.455a |
| T7 | 12.81±0.337a | 14.12±0.02a | 13.46±0.175ab | 16.61±0.221e | 18.20±0.081d | 17.40±0.071d | 19.49±0.205a | 20.47±0.318a | 19.98±0.26a |
| SE (m) ± | 0.23 | 0.16 | 0.12 | 0.26 | 0.28 | 0.25 | 0.30 | 0.46 | 0.36 |
| CD (at 0.05) | 0.71 | 0.49 | 0.38 | 0.79 | 0.85 | 0.77 | 0.91 | 1.42 | 1.12 |
| CV% | 3.12 | 2.04 | 1.64 | 2.36 | 2.43 | 2.25 | 3.01 | 4.46 | 3.60 |
All values are mean±SEM values of three replications, T1: Fourth (top) level with only natural light (without artificial full spectrum light), T2: Third level with only natural light, T3: Second level with only natural light, T4: First (bottom) level with only natural light, T5: Third level with artificial full spectrum light (AFSL) of 2 h, T6: Second level with AFSL of 4 h, T7: First (bottom) level with artificial full spectrum light (AFSL) of 6 h. The mean values with different superscript letters in a column are significantly different (p<0.05).
The plant height is the function of a balance between apical dominance and axillary bud initiation. Blue light is actively involved in the improvement of callusing and the number of axillary buds but has an inhibitory action on the sprouting of vegetative buds leading to increased apical dominance whereas red light reduces the apical dominance which reflects an antagonistic model of regulation stem branching and growth in the presence of red and blue lights mediated by photoreceptors [15]. A contrasting mechanism explained by Muleo et al. [16] indicated the inhibition of internodal elongation and enhanced axillary bud formation under blue light as a photon fluence rate-dependent mechanism instead of phytochrome-regulated. The red light alone may result in low photosynthetic capacity, low maximum quantum yield of chlorophyll fluorescence, low photosynthetic capacity and unresponsive stomatal conductance [17,18], excessive stem elongation, and leaf disorders [19] the so-called Red-Light Syndrome. In this case, blue light plays an active role to counteract the excessive effect of red light and alleviates “red light syndrome” to assure good plant development [17].
The various studies on the influence of red and blue light on organogenesis confirm a species-dependent mechanism. Nhut et al. [20] reported irregular plantlet growth in Fragaria x ananassa due to excessive and prolonged red light availability whereas plantlet growth was inhibited under a monochromatic supply of blue light. Jao et al. [21] also reported a shorter stem of plants and a higher chlorophyll content under RL-BL application which highlights the requirement of full spectrum light for regulation of both plant height and chlorophyll biosynthesis. However, the AFSL provided to the strawberry plants in the current study has a broad spectrum composition of white light enriched in the most useful wavelengths (blue light, red light, and green light) which could play an important role in the vertical farming system [22].
3.2. Average Number of Leaves per Plant
The observations recorded for an average number of leaves per plant [Table 2] were significantly affected by treatments given at all days of observations (30, 60, and 90 days after planting). The average number of leaves per plant was highest at lower levels of verticals when subjected with additional full spectrum light in T6 (4 h at L2) and T7 (6 h at L1) followed by T5 (2 h at L3) and were at par to T1 when plants were at top level (L4) without additional supply of light. Somewhat similar results were observed in the study of Uddin et al. [14] which showed an increased number of leaves with the effect of LED lights. A greater fraction of red light is responsible for the impaired development of leaves, i.e., long petioles and thin wide leaves with reduced chlorophyll content, resembling to shade avoidance response under low light; however, the presence of blue light in AFSL could be accountable to counteract the red-light effect to ensure healthy development leaves under vertical farming system [6]. Although a greater fraction of blue light is also associated with abnormalities in leaf development and results in sun-type leaves (high leaf thickness with reduced leaf area) which is antagonized by green light [6]. The AFSL provided to strawberry plants in the present study includes all these spectra (red light, blue light, and green light) which might be responsible for the proliferation of leaf primordia and the development of healthy leaves. Moreover, full spectrum LEDs encouraged the initiation and expansion of leaves, thereby increasing the available leaf area for efficient photosynthesis [23].
Table 2: Average number of leaves of strawberry plants grown at different levels of verticals under different treatments.
| Treatments | At 30 days after planting | At 60 days after planting | At 90 days after planting | ||||||
|---|---|---|---|---|---|---|---|---|---|
| 2022 | 2023 | Pooled | 2022 | 2023 | Pooled | 2022 | 2023 | Pooled | |
| T1 | 10.67±0.57b | 15.93±0.176ab | 13.30±0.351ab | 14.47±0.176b | 19.40±0.757a | 16.93±0.448a | 17.20±0.231b | 17.00±1.206a | 17.10±0.603ab |
| T2 | 10.67±0.24b | 13.27±0.751b | 11.97±0.371b | 11.73±0.067c | 15.13±0.593bc | 13.43±0.328c | 14.60±0.231d | 13.47±1.954b | 14.03±0.949c |
| T3 | 12.87±0.521a | 13.53±1.267b | 13.20±0.723ab | 13.47±0.176bc | 13.20±0.2c | 13.33±0.176c | 15.73±0.533c | 12.13±0.706b | 13.93±0.481c |
| T4 | 10.87±0.371b | 10.67±0.176b | 10.77±0.12b | 10.80±0.503c | 13.87±0.24c | 12.33±0.338c | 13.27±0.176e | 13.73±0.57b | 13.50±0.305c |
| T5 | 12.93±0.467a | 16.53±1.235a | 14.73±0.835a | 14.27±0.57b | 15.93±0.353b | 15.10±0.458b | 17.13±0.24b | 15.80±0.416ab | 16.47±0.088b |
| T6 | 12.87±0.067a | 13.80±1.514ab | 13.33±0.788ab | 16.80±0.416a | 13.87±0.819c | 15.33±0.437b | 19.80±0.116a | 16.60±0.346ab | 18.20±0.115a |
| T7 | 11.93±0.267ab | 14.47±0.968ab | 13.20±0.569ab | 16.53±1.434a | 14.13±0.176c | 15.33±0.736b | 19.27±0.291a | 12.60±0.503b | 15.93±0.291b |
| SE (m) ± | 0.39 | 0.99 | 0.59 | 0.61 | 0.55 | 0.45 | 0.29 | 0.96 | 0.49 |
| CD (at 0.05) | 1.22 | 3.05 | 1.82 | 1.88 | 1.69 | 1.38 | 0.89 | 2.95 | 1.49 |
| CV% | 5.78 | 12.23 | 7.89 | 7.53 | 6.30 | 5.34 | 3.00 | 11.44 | 5.39 |
All values are mean±SEM values of three replications, T1: Fourth (top) level with only natural light (without artificial full spectrum light), T2: Third level with only natural light, T3: Second level with only natural light, T4: First (bottom) level with only natural light, T5: Third level with artificial full spectrum light (AFSL) of 2 h, T6: Second level with AFSL of 4 h, T7: First (bottom) level with artificial full spectrum light (AFSL) of 6 h. The mean values with different superscript letters in a column are significantly different (p<0.05).
3.3. Average Length of Petioles
The observations recorded for average petiole length [Table 3] were significantly affected by the level of verticals and additional hours of AFSL at all days of observations (30, 60, and 90 days after planting). The plants grown with the addition of full spectrum light at first, second, and third levels had greater average lengths of petiole when supplied with additional hours of AFSL as in T6 (4 h at L2) and T7 (6 h at L1) followed by T5 (2 h at L3) and the results were at par to T1 when plants were at the top level (L4) without additional supply of light. The longer petioles in the plants exposed to full spectrum light could be attributed to enhanced nutrient absorption and transport within the plants [24]. This supply of nutrients from roots is in coordination with photosynthetic activities in shoots through signaling molecules such as phytohormones, proteins, and sucrose and is probably linked to ion uptake [25]. Nhut et al. [20] reported elongated petioles in Fragaria x ananassa under red light; however, the leaves turned yellowish green with irregular in vitro growth which might be resolved by adding the blue light to the spectrum as advocated by Miao et al. [17]. The application of AFSL in the present study did not reflect such abnormalities which could be attributed to the presence of a broad spectrum of light including red light, blue light, and green light.
Table 3: Average petiole length (cm) of strawberry plants grown at different levels of verticals under different treatments.
| Treatments | At 30 days after planting | At 60 days after planting | At 90 days after planting | ||||||
|---|---|---|---|---|---|---|---|---|---|
| 2022 | 2023 | Pooled | 2022 | 2023 | Pooled | 2022 | 2023 | Pooled | |
| T1 | 12.96±0.255a | 12.57±0.215ab | 12.77±0.22a | 22.33±0.347a | 17.73±0.384b | 20.03±0.205a | 17.27±0.262b | 13.25±0.685b | 15.26±0.356cd |
| T2 | 12.83±0.207a | 13.30±0.38a | 13.06±0.183a | 18.11±0.184c | 15.34±0.305cd | 16.72±0.245c | 14.27±0.224d | 15.31±0.773ab | 14.79±0.276d |
| T3 | 11.45±0.122b | 11.95±0.055b | 11.70±0.038b | 17.15±0.406d | 16.25±0.129c | 16.70±0.157c | 15.23±0.082c | 14.25±0.387b | 14.74±0.191d |
| T4 | 11.81±0.013b | 11.87±0.532b | 11.84±0.265b | 16.85±0.047d | 15.23±0.122d | 16.04±0.054c | 14.41±0.262cd | 14.83±0.325ab | 14.62±0.28d |
| T5 | 12.84±0.295a | 12.85±0.177ab | 12.84±0.072a | 21.33±0.184b | 17.93±0.765b | 19.63±0.408ab | 17.70±0.472b | 13.85±0.218b | 15.78±0.262c |
| T6 | 12.71±0.188a | 12.69±0.347ab | 12.70±0.191a | 17.07±0.041d | 20.85±0.697a | 18.96±0.334b | 18.87±0.175a | 16.08±0.262a | 17.47±0.212a |
| T7 | 12.53±0.33ab | 13.27±0.312a | 12.90±0.303a | 16.30±0.219d | 20.17±0.299a | 18.24±0.117b | 19.13±0.238a | 14.07±0.349b | 16.60±0.278b |
| SE (m) ± | 0.24 | 0.30 | 0.19 | 0.25 | 0.32 | 0.25 | 0.28 | 0.47 | 0.26 |
| CD (at 0.05) | 0.73 | 0.91 | 0.57 | 0.78 | 0.99 | 0.76 | 0.87 | 1.44 | 0.81 |
| CV% | 3.28 | 4.07 | 2.58 | 2.38 | 2.87 | 2.36 | 2.93 | 4.58 | 2.93 |
All values are mean±SEM values of three replications, T1: Fourth (top) level with only natural light (without artificial full spectrum light), T2: Third level with only natural light, T3: Second level with only natural light, T4: First (bottom) level with only natural light, T5: Third level with artificial full spectrum light (AFSL) of 2 h, T6: Second level with AFSL of 4 h, T7: First (bottom) level with artificial full spectrum light (AFSL) of 6 h. The mean values with different superscript letters in a column are significantly different (p<0.05).
3.4. Average Spread of Strawberry Plants
The levels of verticals and the duration of artificial light significantly affected the plant spread [Table 4] on all observation days (30, 60, and 90 days after planting. Under NL supply, the plants have a wider spread at the fourth (top) level (L4) of verticals and were better in comparison to lower levels (T2, T3, and T4). However, when additional full spectrum light was given to strawberry plants grown at lower levels (the first, second, and third levels) of vertical structure, the plant spread was improved. Under supplementary AFSL for 6 h, 4 h, and 2 h in T7, T6, and T5, respectively, the plant spread (E-W and N-S) in strawberry was at par to the T1 and was 1.11, 1.10, and 1.23 times greater than the plant spread in T4, T3, and T2, respectively. The application of AFSL in vertical farming resulted in plants’ better growth of side branches and overall plant spread.
Table 4: Average plant spread (cm) of strawberry plants grown at different levels of verticals under different treatments.
| Treatments | At 30 days after planting | At 60 days after planting | At 90 days after planting | ||||||
|---|---|---|---|---|---|---|---|---|---|
| 2022 | 2023 | Pooled | 2022 | 2023 | Pooled | 2022 | 2023 | Pooled | |
| East-West direction | |||||||||
| T1 | 7.06±0.512ab | 8.21±0.097a | 7.63±0.294a | 15.19±0.098b | 17.32±0.311a | 16.26±0.189b | 16.83±0.274a | 20.99±0.635a | 18.91±0.293a |
| T2 | 6.83±0.394b | 8.26±0.326a | 7.55±0.191a | 11.53±0.478d | 13.31±0.911b | 12.42±0.307e | 11.85±0.344d | 17.91±0.268b | 14.88±0.161d |
| T3 | 7.17±0.474ab | 7.63±0.294ab | 7.40±0.365a | 12.93±0.408c | 13.87±0.291b | 13.40±0.081d | 13.52±0.261c | 17.31±1.1b | 15.41±0.507d |
| T4 | 5.60±0.3b | 6.75±0.074b | 6.18±0.149b | 12.45±0.326cd | 13.30±0.503b | 12.88±0.182de | 12.42±0.25d | 17.20±0.27b | 14.81±0.255d |
| T5 | 6.15±0.308b | 8.07±0.294ab | 7.11±0.299a | 14.89±0.358b | 18.01±0.396a | 16.45±0.11ab | 16.38±0.372ab | 19.14±0.269ab | 17.76±0.095b |
| T6 | 6.75±0.314b | 7.39±0.299b | 7.07±0.198ab | 17.68±0.405a | 16.83±0.667a | 17.25±0.428a | 15.11±0.14b | 18.25±0.375b | 16.68±0.213c |
| T7 | 8.13±0.415a | 7.04±0.266b | 7.58±0.327a | 14.26±0.31b | 14.41±0.701b | 14.33±0.402c | 15.70±0.099b | 17.75±1.373b | 16.72±0.638bc |
| SE (m) ± | 0.41 | 0.25 | 0.28 | 0.37 | 0.61 | 0.29 | 0.28 | 0.64 | 0.34 |
| CD (at 0.05) | 1.26 | 0.79 | 0.88 | 1.15 | 1.88 | 0.89 | 0.87 | 1.97 | 1.05 |
| CV% | 10.36 | 5.79 | 6.84 | 4.56 | 6.92 | 3.41 | 3.37 | 6.00 | 3.57 |
| North-South direction | |||||||||
| T1 | 7.42±0.332a | 6.45±0.255b | 6.94±0.287b | 13.27±0.301bc | 15.62±0.338ab | 14.44±0.131b | 11.21±0.318b | 22.22±1.084a | 16.71±0.54a |
| T2 | 7.38±0.07a | 4.53±0.185d | 5.95±0.099cd | 11.51±0.221d | 11.34±1.046c | 11.42±0.536c | 11.14±0.397b | 16.51±0.166b | 13.82±0.281b |
| T3 | 5.69±0.171bc | 5.38±0.07c | 5.54±0.088d | 12.07±0.341cd | 10.68±0.175c | 11.38±0.09c | 8.79±0.376c | 16.57±1.587b | 12.68±0.85b |
| T4 | 5.17±0.128c | 6.81±0.013ab | 5.99±0.07cd | 12.93±0.445c | 11.06±0.671c | 12.00±0.531c | 9.34±0.262c | 16.06±1.25b | 12.70±0.521b |
| T5 | 8.00±0.342a | 7.35±0.374a | 7.68±0.029a | 14.27±0.358b | 16.93±0.229a | 15.60±0.215ab | 13.15±0.467a | 21.67±0.453a | 17.41±0.457a |
| T6 | 5.95±0.357bc | 6.39±0.135b | 6.17±0.149c | 16.62±0.428a | 15.59±0.682ab | 16.11±0.497a | 12.18±0.456ab | 16.01±0.096b | 14.10±0.274b |
| T7 | 6.18±0.501b | 4.59±0.243d | 5.38±0.244d | 14.28±0.42b | 14.75±0.631b | 14.52±0.226b | 10.71±0.297bc | 16.93±0.54b | 13.82±0.254b |
| SE (m) ± | 0.29 | 0.22 | 0.17 | 0.36 | 0.63 | 0.39 | 0.40 | 0.86 | 0.47 |
| CD (at 0.05) | 0.90 | 0.69 | 0.51 | 1.12 | 1.95 | 1.20 | 1.24 | 2.65 | 1.46 |
| CV% | 7.72 | 6.55 | 4.63 | 4.62 | 8.00 | 4.93 | 6.39 | 8.29 | 5.68 |
All values are mean±SEM values of three replications, T1: Fourth (top) level with only natural light (without artificial full spectrum light), T2: Third level with only natural light, T3: Second level with only natural light, T4: First (bottom) level with only natural light, T5: Third level with artificial full spectrum light (AFSL) of 2 h, T6: Second level with AFSL of 4 h, T7: First (bottom) level with artificial full spectrum light (AFSL) of 6 h. The mean values with different superscript letters in a column are significantly different (p<0.05).
AFSLs consist of visible spectra predominantly consisting of blue light, green light, and red light. The red light stimulates the photosynthetic apparatus and phytochromes [26] which regulates the photosynthesis and biomass accumulation [27] whereas the blue component of LED light effectively stimulates phytochromes as well as cryptochromes and phototropins [26] which regulates photomorphogenesis, stomatal movement, biosynthesis of chlorophyll, and anthocyanin as well as biomass accumulation [27]. The presence of green light components in AFSL regulates leaf expansion, stem stretching, and stomatal conductance which could have played a significant role in the plant spread of strawberry. Thus, the simultaneous presence of blue and red light in AFSL compensated for their mutual effects on biomass production and a positive growth response [28,29]. The present finding implies that the improved light spectrum played a role in optimizing the physical structure of strawberry plants, potentially resulting in higher crop production and biomass accumulation [30]. The dependence of plant spread on light intensity at different levels of verticals could be associated with alteration in water use efficiency and stomatal conductance of strawberry plants [31] or the activation of phytochrome by different light duration resulting in regulation of activities of transcription factors [32]. Alteration of light environment can bring change in morphogenesis which could be associated with auxin homeostasis as it plays a crucial role in regulation of plant growth and development. Further, light stimulates auxin transport to roots resulting in light-induced elongation of primary roots for efficient nutrient uptake [33].
3.5. Flowering Parameter Analysis
The number of days required for bud formation and flower initiation was smaller with a greater number of flowers per plant at the top level of verticals (T1) due to the availability of sufficient light intensity [Table 5]. However, the delay in bud initiation and flowering with lesser flower count was noticed in strawberry plants at lower levels (T2, T3, and T4) of vertical structure which could be due to a reduction in the intensity of NL. When additional full spectrum light was given, the plants that were grown at the lower levels (T5, T6, and T7), namely, first, second, and third levels had improved performance in terms of earliness in flowering as well as the number of flowers per plant. They also performed at par to the fourth level in NL conditions (T1) for early bud formation which confirms the essentiality of AFSL for flower induction at lower levels of vertical structure.
Table 5: Flowering parameters of strawberry plants grown at different levels of verticals under different treatments.
| Treatments | Days to bud formation | Number of buds per plant | ||||
|---|---|---|---|---|---|---|
| 2022 | 2023 | Pooled | 2022 | 2023 | Pooled | |
| T1 | 60.83±0.167b | 61.33±0.167ab | 61.08±0.084ab | 23.00±0.764b | 25.56±0.483ab | 24.28±0.576b |
| T2 | 61.67±0.166ab | 60.83±0.167b | 61.25±0.144ab | 23.17±0.928b | 25.56±0.588ab | 24.36±0.459b |
| T3 | 62.17±0.166a | 60.83±0.441b | 61.50±0.289a | 24.83±0.928ab | 24.44±0.678b | 24.64±0.266b |
| T4 | 61.67±0.441ab | 61.33±0.167ab | 61.50±0.289a | 22.50±0.001b | 25.00±0.768b | 23.75±0.387b |
| T5 | 61.50±0.5ab | 60.17±0.441b | 60.83±0.167b | 25.33±0.726a | 26.78±0.447a | 26.06±0.556a |
| T6 | 61.33±0.167ab | 61.67±0.441a | 61.50±0.25a | 25.83±0.167a | 23.89±0.618b | 24.86±0.266ab |
| T7 | 61.33±0.167ab | 60.67±0.601b | 61.00±0.289ab | 26.67±0.167a | 23.89±0.22b | 25.28±0.102ab |
| SE (m) ± | 0.30 | 0.27 | 0.17 | 0.64 | 0.57 | 0.41 |
| CD (at 0.05) | 0.92 | 0.83 | 0.52 | 1.97 | 1.76 | 1.26 |
| CV% | 0.84 | 0.77 | 0.48 | 4.53 | 3.95 | 2.87 |
| Days to flowering | Number of flowers per plant | |||||
| T1 | 65.50±0.001b | 64.67±0.441b | 65.08±0.22b | 23.11±0.222a | 24.00±0.333ab | 23.56±0.241ab |
| T2 | 65.83±0.166b | 65.83±0.333ab | 65.83±0.082b | 22.67±0.333ab | 24.44±0.678ab | 23.56±0.199ab |
| T3 | 66.00±0.289b | 66.00±0.289ab | 66.00±0.001b | 23.33±0.667a | 22.44±0.948b | 22.89±0.388ab |
| T4 | 67.00±0.289a | 66.17±0.167a | 66.58±0.22a | 21.78±0.676b | 23.78±0.675b | 22.78±0.675b |
| T5 | 66.67±0.167ab | 65.17±0.334b | 65.92±0.221b | 22.00±0.333b | 25.67±0.193a | 23.83±0.095a |
| T6 | 67.00±0.5a | 65.50±0.289ab | 66.25±0.382ab | 21.22±0.484b | 22.56±0.483b | 21.89±0.443b |
| T7 | 66.50±0.289ab | 66.17±0.441a | 66.33±0.082ab | 21.89±0.401b | 22.33±0.333b | 22.11±0.339b |
| SE (m) ± | 0.26 | 0.32 | 0.16 | 0.30 | 0.58 | 0.33 |
| CD (at 0.05) | 0.80 | 0.99 | 0.50 | 0.93 | 1.77 | 1.01 |
| CV% | 0.67 | 0.84 | 0.43 | 2.35 | 4.23 | 2.46 |
All values are mean±SEM values of three replications, T1: Fourth (top) level with only natural light (without artificial full spectrum light), T2: Third level with only natural light, T3: Second level with only natural light, T4: First (bottom) level with only natural light, T5: Third level with artificial full spectrum light (AFSL) of 2 h, T6: Second level with AFSL of 4 h, T7: First (bottom) level with artificial full spectrum light (AFSL) of 6 h. The mean values with different superscript letters in a column are significantly different (p<0.05).
The control activity of light through AFSL under short days (winter months) solar radiation enhances the crop growth and development efficiency by optimizing the photosynthetic activities which results in changes in internal rhythms to bring morphological and reproductive changes such as flower bud differentiation or improve the biosynthesis and accumulation of plant metabolites necessary for defense against biotic and abiotic stresses [34]. The optimized light spectrum provided by full spectrum LEDs likely played a role in expediting physiological processes and initiating earlier bud development. In addition, the time required for bud formation to reach maturity was accelerated, resulting in faster fruit ripening and shorter maturation periods [35,36]. Longer durations of full spectrum light exposure, particularly during the flowering stage, can promote bud formation and potentially reduce the time it takes for buds to develop as flowers. Providing sufficient light during the appropriate growth stages is crucial for optimal bud development and flower production [37,38]. Extended exposure to full spectrum light to promote flower induction and increase the number of flowers is a time-dependent process and is influenced by multiple components of the daylight spectrum; however, for harnessing the full advantage of the application of LEDs in crop production it is necessary to know the diurnal impact of light quality on the whole process from floral evocation to anthesis including the involvement of photoreceptors and the flowering regulatory genes [39].
3.6. Fruiting of Strawberry
The various fruiting and yield-related parameters, namely, fruit count per plant, days to fruit maturity, fruit volume, and average berry weight were significantly influenced by levels of verticals and the duration of AFSL provided at different levels. The number of fruits per plant [Table 6] and fruit set percentage [Figure 2] was significantly reduced down to the levels in verticals from T1 to T4 due to reduced availability of light. However, the fruit count and fruit set were improved in the treatments with an additional supply of AFSL at lower levels of vertical structure where the highest fruit set and fruit count was noticed at T5 (L3 + AFSL for 2 h), T6 (L2 + AFSL for 4 h), and T7 (L1 + AFSL for 6 h) which were at par to T1 (L4 + only NL) in comparison to T2 (L3 + only NL), T3 (L2 + only NL), and T4 (L1 + only NL). The plants exposed to only NL matured earlier when plants were at the fourth level (T1) and were superior in comparison to T2, T3, and T4; however, the supply of additional duration of AFSL has not hastened the fruit maturity [Table 6]. The fruit volume and average berry weight [Table 6] of strawberry were greater in T1, i.e., plants grown at the top level of verticals under NL conditions. The fruit volume was further reduced down the levels of verticals (L4 to L1) due to the reduced intensity of NL. However, when additional duration of AFSL was provided at lower levels, the fruit volume was significantly increased at T5 (L3 + AFSL for 2 h), T6 (L2 + AFSL for 4 h), and T7 (L1 + AFSL for 6 h) in comparison to T2 (L3 + only NL), T3 (L2 + only NL), and T4 (L1 + only NL).
Table 6: Fruiting parameters of strawberry grown at different levels of verticals under different treatments.
| Treatments | Days to fruit maturity | Number of fruits per plant | ||||
|---|---|---|---|---|---|---|
| 2022 | 2023 | Pooled | 2022 | 2023 | Pooled | |
| T1 | 72.50±0.289c | 72.33±0.333b | 72.42±0.301e | 21.78±0.40a | 22.89±0.402b | 22.33±0.384ab |
| T2 | 73.50±0.5c | 73.33±0.441b | 73.42±0.363d | 21.00±0.51ab | 22.89±0.776b | 21.94±0.474ab |
| T3 | 72.83±0.441c | 74.50±0.001a | 73.67±0.221cd | 21.89±0.89a | 21.33±0.839bc | 21.61±0.39b |
| T4 | 75.50±0.5ab | 73.83±0.166ab | 74.67±0.167b | 19.56±0.48c | 22.56±0.588bc | 21.06±0.529bc |
| T5 | 74.67±0.441b | 73.33±0.333b | 74.00±0.144c | 20.67±0.33b | 24.78±0.294a | 22.72±0.11a |
| T6 | 75.00±0.289ab | 73.83±0.667ab | 74.42±0.221bc | 19.67±0.51bc | 21.33±0.384bc | 20.50±0.441c |
| T7 | 76.00±0.289a | 74.83±0.166a | 75.42±0.221a | 20.11±0.62bc | 21.22±0.294c | 20.67±0.419bc |
| SE (m) ± | 0.34 | 0.36 | 0.17 | 0.34 | 0.53 | 0.30 |
| CD (at 0.05) | 1.06 | 1.10 | 0.54 | 1.05 | 1.64 | 0.93 |
| CV% | 0.80 | 0.84 | 0.41 | 2.86 | 4.10 | 2.42 |
| Fruit volume (cc) | Average berry weight (g) | |||||
| T1 | 14.00±0.157a | 14.24±0.255a | 14.12±0.144a | 16.10±0.297ab | 16.43±0.536a | 16.26±0.388ab |
| T2 | 14.07±0.285a | 13.64±0.179ab | 13.86±0.058a | 16.01±0.365b | 15.12±0.597b | 15.57±0.336b |
| T3 | 12.74±0.204b | 13.57±0.125b | 13.16±0.039b | 15.02±0.542c | 15.35±0.227ab | 15.19±0.329b |
| T4 | 12.88±0.369b | 12.83±0.119c | 12.86±0.204b | 15.54±0.297bc | 14.21±0.609b | 14.88±0.449b |
| T5 | 14.40±0.051a | 13.89±0.123ab | 14.14±0.045a | 16.74±0.287ab | 15.38±0.064ab | 16.06±0.126ab |
| T6 | 13.90±0.285a | 13.74±0.4ab | 13.82±0.082a | 16.80±0.424a | 15.88±0.165ab | 16.34±0.28a |
| T7 | 12.91±0.371b | 12.94±0.172bc | 12.93±0.211b | 15.37±0.467bc | 15.37±0.298ab | 15.37±0.381b |
| SE (m) ± | 0.28 | 0.21 | 0.13 | 0.24 | 0.39 | 0.24 |
| CD (at 0.05) | 0.88 | 0.66 | 0.41 | 0.73 | 1.21 | 0.73 |
| CV% | 3.63 | 2.72 | 1.68 | 2.58 | 4.40 | 2.61 |
All values are mean±SEM values of three replications, T1: Fourth (top) level with only natural light (without artificial full spectrum light), T2: Third level with only natural light, T3: Second level with only natural light, T4: First (bottom) level with only natural light, T5: Third level with artificial full spectrum light (AFSL) of 2 h, T6: Second level with AFSL of 4 h, T7: First (bottom) level with artificial full spectrum light (AFSL) of 6 h. The mean values with different superscript letters in a column are significantly different (p<0.05).
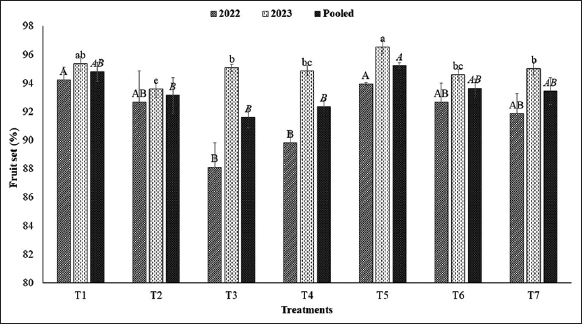 | Figure 2: Fruit set (%) of strawberry plants grown at different levels of verticals under different treatments. [Click here to view] |
Full spectrum light, which encompasses the necessary wavelengths for both photosynthesis and reproductive development, is essential for a successful fruit set in strawberries. Adequate light intensity and quality during the flowering stage positively impact pollination, fertilization, and subsequent fruit formation [40]. The improved light spectrum likely stimulated floral initiation and promoted greater flower production [41], leading to enhanced pollination efficiency and fruit set, ultimately resulting in higher fruit yield [42]. Optimal light quality and intensity are influential factors in determining fruit size and volume. Studies indicate that optimizing the light spectrum and intensity can contribute to increased fruit volume in strawberries cultivated under different levels of verticals [43].
3.7. Yield Attributes of Strawberry
It was observed that average fruit yield per plant [Figure 3] and estimated fruit yield (kg per 1000 sq.m.) [Figure 4] were significantly varied at different levels of verticals under NL as well as additional duration of AFSL. The average fruit yield per plant of strawberry was greater in T1, i.e., plants grown at the top level of verticals under NL conditions were further reduced down the levels of verticals (L4 to L1) due to reduced intensity of NL. However, when additional duration of AFSL was provided at lower levels, the average fruit yield per plant was significantly increased at T5 (L3 + AFSL for 2 h), T6 (L2 + AFSL for 4 h), and T7 (L1 + AFSL for 6 h) in comparison to T2 (L3 + only NL), T3 (L2 + only NL), and T4 (L1 + only NL). A similar trend was noticed for the estimated yield (kg per 1000 sq.m.) of strawberry under natural and supplementary doses of light. The correlation study of average light intensity available to the plants under different treatments with the various parameters [Figure 5] also confirms a strong and positive correlation with the fruit set (0.889**), average berry weight (0.820*), and yield of strawberry (0.976**) which confirms that the higher yield under T5, T6, and T7 could be associated to high available light intensity due to AFSL provided at the lower levels in these treatments. An increase in the yield of strawberry plants was observed in a somewhat similar study by Hanenberg et al. [44] and Hidaka et al. [45]. The weight of strawberries is influenced by multiple factors, such as genetic traits, nutrient availability, and environmental conditions. Full spectrum light has the potential to enhance photosynthesis and overall plant vitality, which could result in larger berry sizes [46]. -Full spectrum light, provided by technologies such as full spectrum LEDs, can optimize plant growth and development, potentially leading to increased yields in vertical farming systems. Research has demonstrated the beneficial impact of full spectrum light on plant yield in various crops including strawberries under greenhouse [47,48].
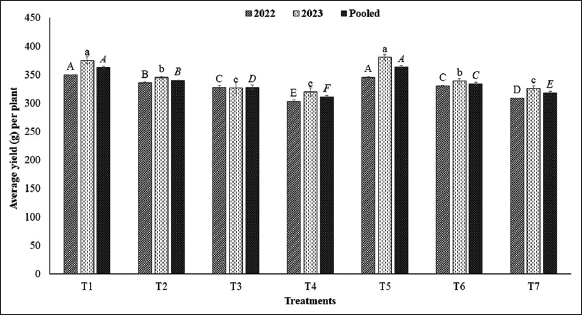 | Figure 3: Average yield (g/plant) of strawberry grown at different levels of verticals under different treatments. [Click here to view] |
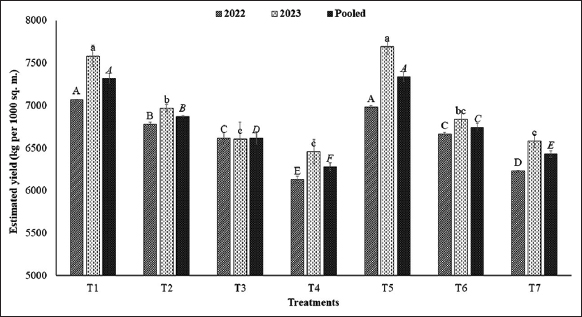 | Figure 4: Estimated yield (kg per 1000 sq.m.) of strawberry grown at different levels of verticals under different treatments. [Click here to view] |
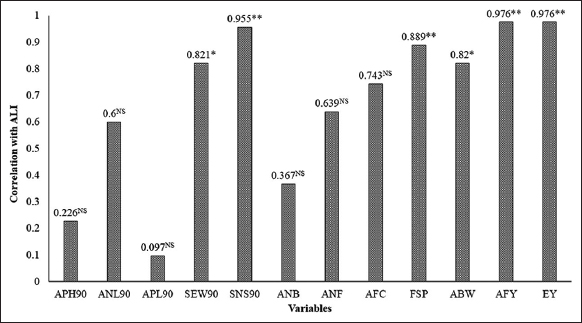 | Figure 5: Correlation between available light intensity through natural and artificial full spectrum light and various growth and yield parameters. [Click here to view] |
4. CONCLUSION
In the current study, the strawberry plants have resulted in the highest productivity when grown at the top level (L4) in the vertical farming system. At lower levels of the verticals, the additional supply of AFSL for a certain duration is essential to ensure greater plant height, number of leaves per plant, petiole length, plant spread, number of flowers per plant, number of fruits per plant, fruit set percentage, fruit size, average berry weight, and fruit yield of strawberry. The additional duration of AFSL resulted in higher average fruit yield per plant at lower levels, namely, T5 (L3 + AFSL for 2 h), T6 (L2 + AFSL for 4 h), and T7 (L1 + AFSL for 6 h) and was at par to T1 (top level of vertical + only NL) under outdoor cultivation of strawberry. Thus, under a vertical farming system, it is advised to provide an additional supply of light to maintain the available light intensity as high as 200 μmol s-1m-2 which seems to be a typical light intensity required for strawberry.
4.1. Potential Benefits of Vertical Farming System
The present study confirms that vertical farming of strawberry ensures optimization of various resources, namely, space, light, water, and nutrients so it embraces promising implications for future agriculture practices as it holds potential scope to solve the expected challenges of land availability, water scarcity and health issue of abiotic and biotic communities including human and soil. Thus, it can ensure increased food production in urban areas to enhance food security by reducing reliance on the traditional system of agriculture for a consistent supply of food. Further, its potential to reduce environmental impact may contribute to sustainable and resilient agricultural practices, offering a viable solution for the evolving challenges of global food production.
4.2. Potential Limitations of Present Study
One of the major challenges of the vertical farming system is the high initial investment cost for infrastructure which can be resolved through low-cost establishment as per the design given in the present study. Energy consumption as AFSL is a question of its sustainability which can be resolved after adding solar panels as an energy source. Further, it is investigated for a limited number of crops so there is a further need of investigation by including diverse group of crops. Further, the impact of different spectra of light is species-dependent and is based on a complex molecular mechanism that needs to be further explored. The waste generated through this experiment such as using nutrient solution is a matter of concern. These limitations need to be addressed through ongoing research as it is posing a potential obstacle to its scalability and sustainability.
5. ACKNOWLEDGMENT
The authors thank Lovely Professional University for providing the research facilities during the experiment.
6. AUTHORS’ CONTRIBUTION
All authors made significant contributions to the design of the research work, data collection, data analysis, and interpretation. They have also contributed to the draft of the present manuscript and have revised it critically to improve the concept. All are in agreement for submission of this manuscript to the current journal, have approved this for publication, and bear accountability for all aspects of this work. All the authors are eligible to be authors as per the International Committee of Medical Journal Editors (ICMJE) requirements/guidelines.
7. FUNDING
There is no funding to report.
8. CONFLICTS OF INTEREST
The authors report no financial or any other conflicts of interest in this work.
9. ETHICAL APPROVALS
This study does not involve experiments on animals or human subjects.
10. DATA AVAILABILITY
The data are available with the first and corresponding author as it is from the dissertation work of the first author. It will be made available on request.
11. USE OF ARTIFICIAL INTELLIGENCE (AI)-ASSISTED TECHNOLOGY
The authors declares that they have not used artificial intelligence (AI)-tools for writing and editing of the manuscript, and no images were manipulated using AI.
12. PUBLISHER’S NOTE
All claims expressed in this article are solely those of the authors and do not necessarily represent those of the publisher, the editors and the reviewers. This journal remains neutral with regard to jurisdictional claims in published institutional affiliation.
REFERENCES
1. Van Gerrewey T, Boon N, Geelen D. Vertical farming:The only way is up?Agronomy 2021;12:2. [CrossRef]
2. Sonawane MS. Status of vertical farming in India. Int J Appl Sci Technol 2018;9:122-5.
3. Benke K, Tomkins B. Future food-production systems:Vertical farming and controlled-environment agriculture. Sustain Sci Pract Policy 2017;13:13-26. [CrossRef]
4. Butturini M, Marcelis LF. Vertical farming in Europe:Present status and outlook. In:Plant Factory. United States:Academic Press;2020. 77-91. [CrossRef]
5. O'sullivan CA, Bonnett GD, McIntyre CL, Hochman Z, Wasson AP. Strategies to improve the productivity, product diversity and profitability of urban agriculture. Agric Syst 2019;174:133-44. [CrossRef]
6. Wong CE, Teo ZW, Shen L, Yu H. Seeing the lights for leafy greens in indoor vertical farming. Trends Food Sci Technol 2020;106:48-63. [CrossRef]
7. Sarkar A, Majumder M. Opportunities and challenges in sustainability of vertical eco-farming:A review. J Adv Agric Technol 2015;2:98-105. [CrossRef]
8. Mustafa MA, Rahman HA. A comparison of vertical and conventional cultivation, planting distances and growing medium in the growth and yield of three varieties of strawberry. IOP Conf Ser Earth Environ Sci 2021;904:012060. [CrossRef]
9. Gomez KA, Gomez AA. Statistical Procedures for Agricultural Research. United States:John Wiley &Sons;1984.
10. Panse VG, Sukhatme PV. Statistical Methods for Agricultural Workers. 2nd ed. New Delhi:Indian Council of Agricultural Research;1967.
11. Cervantes L, Ariza MT, Gómez-Mora JA, Miranda L, Medina JJ, Soria C, et al. Light exposure affects fruit quality in different strawberry cultivars under field conditions. Sci Hortic 2019;252:291-7. [CrossRef]
12. van Gelderen K, Kang C, Paalman R, Keuskamp D, Hayes S, Pierik R. Far-red light detection in the shoot regulates lateral root development through the HY5 transcription factor. Plant Cell 2018;30:101-16. [CrossRef]
13. Wang F, Zhang L, Chen X, Wu X, Xiang X, Zhou J, et al. SlHY5 integrates temperature, light, and hormone signaling to balance plant growth and cold tolerance. Plant Physiol 2019;179:749-60. [CrossRef]
14. Uddin AJ, Hoq MY, Rini SN, Urme FB, Ahmad H. Influence of supplement LED spectrum on growth and yield of Strawberry. J Biosci Agr Res 2018;16:1348-55. [CrossRef]
15. Hahn EJ, Kozai T, Paek KY. Blue and red light-emitting diodes with or without sucrose and ventilation affect in vitro growth of Rehmannia glutinosa plantlets. J Plant Biol 2000;43:247-50. [CrossRef]
16. Muleo R, Morini S, Casano S. Photoregulation of growth and branching of plum shoots:Physiological action of two photosystems. In VitroCell Dev Biol Plant 2001;37:609-17. [CrossRef]
17. Miao Y, Chen Q, Qu M, Gao L, Hou L. Blue light alleviates “red light syndrome”by regulating chloroplast ultrastructure, photosynthetic traits and nutrient accumulation in cucumber plants. Sci Hortic 2019;257:108680. [CrossRef]
18. Trouwborst G, Hogewoning SW, van Kooten O, Harbinson J, van Ieperen W. Plasticity of photosynthesis after the “red light syndrome”in cucumber. Environ Exp Bot 2016;121:75-82. [CrossRef]
19. Stefano M, Rosario M. Effects of light quality on micropropagation of woody species. In:Jain SM, Ishii K, editors. Micropropagation of Woody Trees and Fruits. Forestry Sciences. Vol. 75. Dordrecht:Springer;2003. 3-35. [CrossRef]
20. Nhut DT, Takamura T, Watanabe H, Okamoto K, Tanaka M. Responses of strawberry plantlets cultured in vitro under superbright red and blue light-emitting diodes (LEDs) Plant Cell Tissue Organ Cult 2003;73:43-52. [CrossRef]
21. Jao RC, Lai CC, Fang W, Chang SF. Effects of red light on the growth of Zantedeschia plantlets in vitro and tuber formation using light-emitting diodes. HortScience 2005;40:436-8. [CrossRef]
22. Cavallaro V, Pellegrino A, Muleo R, Forgione I. Light and plant growth regulators on in vitro proliferation. Plants 2022;11:844. [CrossRef]
23. Malekzadeh Shamsabad MR, Esmaeilizadeh M, Roosta HR, Dabrowski P, Telesinski A, Kalaji HM. Supplemental light application can improve the growth and development of strawberry plants under salinity and alkalinity stress conditions. Sci Rep 2022;12:9272. [CrossRef]
24. Peng X, Wang B, Wang X, Ni B, Zuo Z. Effects of different colored light-quality selective plastic films on growth, photosynthetic abilities, and fruit qualities of strawberry. Hortic Sci Technol 2020;38:462-73. [CrossRef]
25. Xu J, Guo Z, Jiang X, Ahammed GJ, Zhou Y. Light regulation of horticultural crop nutrient uptake and utilization. Hortic Plant J 2021;7:367-79. [CrossRef]
26. Kochetova GV, Belyaeva OB, Gorshkova DS, Vlasova TA, Bassarskaya EM, Zhigalova TV, et al. Long-term acclimation of barley photosynthetic apparatus to narrow-band red and blue light. Photosythetica 2018;56:851-60. [CrossRef]
27. Chen XL, Yang QC, Song WP, Wang LC, Guo WZ, Xue XZ. Growth and nutritional properties of lettuce affected by different alternating intervals of red and blue LED irradiation. Sci Hortic 2017;223:44-52. [CrossRef]
28. Camejo D, Frutos A, Mestre T, Carmen Pinero M, Rivero RM, Martinez V. Artifcial light impacts the physical and nutritional quality of lettuce plants. Hortic Environ Biotechnol 2020;61:69-82. [CrossRef]
29. Tarakanov IG, Tovstyko DA, Lomakin MP, Shmakov AS, Sleptsov NN, Shmarev AN, et al. Effects of light spectral quality on photosynthetic activity, biomass production, and carbon isotope fractionation in lettuce, Lactuca sativa L., plants. Plants 2022;11:441. [CrossRef]
30. Madhavi BG, Kim NE, Basak JK, Choi GM, Kim HT. Comparative study of strawberry growth and fruit quality parameters in horizontal and vertical production systems. Hortic Environ Biotechnol 2023;64:1-11. [CrossRef]
31. Pennisi G, Blasioli S, Cellini A, Maia L, Crepaldi A, Braschi I, et al. Unraveling the role of red:Blue LED lights on resource use efficiency and nutritional properties of indoor grown sweet basil. Front Plant Sci 2019;10:305. [CrossRef]
32. Helizon H, Rösler?Dalton J, Gasch P, von Horsten S, Essen LO, Zeidler M. Arabidopsis phytochrome a nuclear translocation is mediated by a far?red elongated hypocotyl 1-importin complex. Plant J 2018;96:1255-68. [CrossRef]
33. Lee HJ, Park YJ, Ha JH, Baldwin IT, Park CM. Multiple routes of light signaling during root photomorphogenesis. Trends Plant Sci 2017;22:803-12. [CrossRef]
34. Cavallaro V, Muleo R. The effects of LED light spectra and intensities on plant growth. Plants 2022;11:1911. [CrossRef]
35. Wai TS, Chaichana C, Maruyama N. Energy cost analysis of growing strawberries in a controlled environment chamber. Energy Rep 2023;9:677-87. [CrossRef]
36. Yoshida H, Mizuta D, Fukuda N, Hikosaka S, Goto E. Effects of varying light quality from single-peak blue and red light-emitting diodes during nursery period on flowering, photosynthesis, growth, and fruit yield of everbearing strawberry. Plant Biotechnol 2016;33:267-76. [CrossRef]
37. Al Murad M, Razi K, Jeong BR, Samy PM, Muneer S. Light emitting diodes (LEDs) as agricultural lighting:Impact and its potential on improving physiology, flowering, and secondary metabolites of crops. Sustainability 2021;13:1985. [CrossRef]
38. Sabzalian MR, Heydarizadeh P, Zahedi M, Boroomand A, Agharokh M, Sahba M, et al. High performance of vegetables, flowers, and medicinal plants in a red-blue LED incubator for indoor plant production. Agron Sustain Dev 2014;34:879-86. [CrossRef]
39. SharathKumar M, Heuvelink E, Marcelis LF, Van Ieperen W. Floral induction in the short-day plant Chrysanthemum under blue and red extended long-days. Front Plant Sci 2021;11:610041. [CrossRef]
40. Díaz-Galián MV, Torres M, Sanchez-Pagán JD, Navarro PJ, Weiss J, Egea-Cortines M. Enhancement of strawberry production and fruit quality by blue and red LED lights in research and commercial greenhouses. South Afr J Bot 2021;140:269-75. [CrossRef]
41. Nadalini S, Zucchi P, Andreotti C. Effects of blue and red LED lights on soilless cultivated strawberry growth performances and fruit quality. Eur J Hortic Sci 2017;82:12-20. [CrossRef]
42. Nguyen TK, Cho KM, Lee HY, Cho DY, Lee GO, Cho DY, et al. Effects of white LED lighting with specific shorter blue and/or green wavelength on the growth and quality of two lettuce cultivars in a vertical farming system. Agronomy 2021;11:2111. [CrossRef]
43. Samuoliene G, Brazaityte A, Urbonaviciete A, Šabajeviene G, Duchovskis P. The effect of red and blue light component on the growth and development of frigo strawberries. Zemdirbyste Agric 2010;97:99-104.
44. Hanenberg MA, Janse J, Verkerke W. LED Light to Improve Strawberry Flavour, Quality and Production. In:International Symposium on Innovation in Integrated and Organic Horticulture (INNOHORT) 1137;2015. p. 207-12. [CrossRef]
45. Hidaka K, Dan K, Imamura H, Miyoshi Y, Takayama T, Sameshima K, et al. Effect of supplemental lighting from different light sources on growth and yield of strawberry. Environ Control Biol 2013;51:41-7. [CrossRef]
46. Zheng J, He D, Ji F. Effects of light intensity and photoperiod on runner plant propagation of hydroponic strawberry transplants under LED lighting. Int J Agric Biol Eng 2019;12:26-31. [CrossRef]
47. Fangfang C, Hongwei L, Hui Y, Weibin L, Hao L, Rong L. Effect of supplementary lights on strawberry production in greenhouse. J Agric 2021;11:80.
48. Touliatos D, Dodd IC, McAinsh M. Vertical farming increases lettuce yield per unit area compared to conventional horizontal hydroponics. Food Energy Secur 2016;5:184-91. [CrossRef]