
1. INTRODUCTION
The evolutionary relationship within a set of protein sequences is usually drawn based on sequence similarity [17-20]. The phylogenetic tree of a sequence dataset is constructed as the schematic depiction of the mutual sequence similarities of the individual entries, and evolutionary distance/relatedness is assessed through several non-absolute scores including branch length, log-likelihood score, and topology to select the best solution.
Multiple sequence alignment (MSA) is usually constructed through several tools, such as MAFFT [21], MUSCLE [22], Kalign [23], Tcoffee [24], Clustal-Omega [25], and Promals3D [26], to draw the evolutionary relationships. Multiple sequence comparison by log-expectation (MUSCLE; https://www.ebi.ac.uk/Tools/msa/muscle/) and multiple alignments using fast Fourier transform (MAFFT; https://www.ebi.ac.uk/Tools/msa/mafft/) protocols outperform Clustal [21,22]. While MUSCLE aligns the sequences on basis of the log-expectation score and refines the phylogeny using the tree-guided restricted partitioning, MAFFT uses an iterative progressive alignment methodology to iteratively compute the guide tree for accurately assessing the evolutionary divergence. Kalign is also a very fast MSA tool that is applicable for large alignments. It uses the WU-Manber string-matching algorithm to quickly align the sequences [21,23]. Another tool, the PROfile Multiple Alignment with predicted Local Structures and 3D constraints (PROMALS3D), aligns sequences/structures on the basis of the sequence profile, predicted secondary structure, and topological restraints (http://prodata.swmed.edu/promals3d/promals3d.php). In contrast, Clustal-Omega (https://www.ebi.ac.uk/Tools/msa/clustalo/) is capable of quickly aligning numerous sequences on the basis of a guide tree [25] and the hidden Markov model (HMM) profiles [27].
The residue substitution model is the crucial factor leading to an accurate alignment, which summarizes the residue variations at the overlapping loci across a sequence dataset. Sequence phylogeny is routinely derived through nine different substitution matrices, namely Dayhoff [2], JJT [3], block substitution matrix (BLOSUM62) [4], WAG [5], probability matrix from blocks (PMB) [6], direct computation with mutability (DCMUT) [7], JTTDCmut [7], LG [8], and VT [9]. As the Dayhoff matrix is dependent on the global alignment of substantially similar sequences, it is meaningless to align a large functionally equivalent dataset that only shares a local similarity for functionally crucial substructures, making the BLOSUM a better choice in these cases. The resolvent algorithm or the VT matrix is computed from a large set of sequence alignments to extend applicability of generic BLOSUM matrix to highly divergent datasets [9]. Shalini et al. later integrated it with the evolutionary distance score to develop the PMB, to make it easily applicable for phylogenetic analysis [6]. Like Dayhoff, WAG [5] and LG [8] are derived from the profile of many protein sequences, using several approximations, making it feasible for large sequence datasets. While WAG ignores the commonly observed factor of rate heterogeneity across sites, LG increases the evolutionary likelihood of a dataset and considers this parameter with a discrete gamma distribution system [28]. Meanwhile, models based on the Dayhoff matrix have been developed. While the JTT model [3] is developed by recounting the observed variations within the sequence dataset, clustered at 85% sequence identity, the DCMUT is dependent on the mutability and the variations observed within the clustered dataset [7]. JTTDCmut model is also developed to implement the DCMUT strategy over the JTT matrix [7].
The evolutionary relationship is usually drawn through several tools including a tree and reticulogram reconstruction (T-REX), molecular evolutionary genetic analysis (MEGA), PhyML, randomized axelerated maximum likelihood (RAxML), NGPhylogeny.fr, and IQ-TREE. PhyML [11] uses the maximum likelihood (ML) method along with bootstrap and other scoring parameters. While T-REX uses ML/parsimony methods [12] and MEGA5 [13] offers a customizable platform, NGPhylogeny.fr provides a simple platform for allowing easy use of several tools, including MAFFT, MUSCLE, and PhyML [16]. However, the RAxML protocol uses the scoring parameters to quantify the incongruence among phylogenetic trees. As the number of conflicting bipartitions can be significantly higher in the phylogenetic trees of larger sequence datasets, it proves to be a promising phylogenetic algorithm [14]. In comparison to these strategies, IQ-TREE (http://iqtree.cibiv.univie.ac.at/) [15] offers a customizable protocol to build even the complex trees more accurately. The method uses the ultrafast bootstrap algorithm, saving the runtime through statistical scoring, and is significantly faster than RAxML and PhyML [29,30].
Almost all phylogenetic algorithms depend on a few parameters, namely number of sequences, alignment quality, and substitution model, and the impact of a biologically inaccurate sequence alignment and an incompatible residue substitution matrix is greatly disregarded. Most of these methods utilize a default substitution/alignment protocol for every sequence dataset [11-16]. Unfortunately, no substitution matrix consistently yields the most accurate and biologically reasonable alignments for all sequence datasets [10], and as an attempt to draw a more accurate evolutionary relationship, most of the phylogeny tools use the bootstrap methodology [31], or scoring measures like the approximate likelihood ratio, which performs faster than bootstrap [32].
Selecting the optimal alignment protocol and residue substitution matrix for any phylogenetic analysis can often prove to be a challenging task for researchers. Available servers do not consistently prioritize the most compatible options. To address this, the present study aims to assess the reliability of these algorithms by evaluating the topological accuracy of the resulting phylogenetic tree. Indeed, the present study stresses the limitations that may occur in phylogenetic analyses due to a lack of consideration for the different alignment procedures and substitution models. We benchmarked MSA tools and tree inference software for that purpose. By comprehensively assessing all the alignments and substitution models over an evolutionary tree, our study proves the importance of a well-trained substitution model and biologically correct alignment. It shows that we need a better algorithm for heuristic and iterative tailoring of input data. It would allow us to extract a more-accurate functional relationship among the candidate sequences and increase the credibility of downstream methodologies of various allied research fields, including computational systems biology.
2. MATERIALS AND METHODS
2.1. Building the Sequence Dataset and Evaluating the Sequence Identity
To rigorously perform the evolutionary analysis through several parameters and save computational time, we have prioritized families with <1000 sequences. As the accuracy of a phylogeny protocol is strongly dependent on the number of sequences and the sequence length, whereas computational time is heavily dependent on sample size, we have searched the Pfam database [33] (July 29, 2019) and have focused on three datasets encoding <1000 entries: Families IL4-i-Ig (interleukin-4 inducing immunoglobulin-binding domain; PF18258), ART-Polyval (ADP-ribosyltransferase in polyvalent proteins; PF18760), and the pancreatic ribonuclease (PF00074).
As simulating the sequence datasets on the basis of various constraints might lead to a biased estimation of sequence diversity within and across them, the three arbitrarily selected protein families with presumably similar residue compositions are selected for the study. Further, as the functional similarity of the datasets could lead to pre-defined biases in the phylogenetic scores, the three functionally different families are considered for the study. To avoid biases in the phylogeny, three non-redundant sets of 27, 105, and 419 entries are constructed through MMseqs2 [34] from the initially defined sets of 39, 129, and 724 sequences to lay down the methodology, as shown in Figure 1. Since sequence identity is an essential basis for evolutionarily clustering the sequences for estimating their divergence, the mutual identity matrix is scrutinized for each dataset through Clustal-Omega [25].
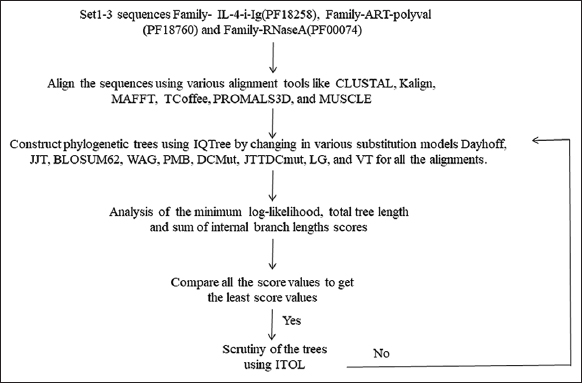 | Figure 1: Flowchart representation of the methodology for the construction of three diverse sequence datasets and the evolutionary analysis of their several alignments through diverse substitution models. [Click here to view] |
2.2. Construction of Phylogenetic Trees
The constructed sequence datasets are aligned using the default settings through Clustal-Omega, Kalign, MAFFT, MUSCLE, TCoffee, and Promals3D. Moreover, to assess the impact of HMM on the phylogenetic accuracy, the HMM-based Clustal-Omega (Clustal1), Kalign (Kalign 1), MAFFT (MAFFT1), MUSCLE (MUSCLE1), and TCoffee (TCoffee1) are also constructed through HHPred (https://toolkit.tuebingen.mpg.de/tools/hhpred) [35]. For the computational limit of 2500-character length of an input alignment, the TCoffee protocol for both EBI and HHPred servers could not be employed to align the set 2 and set 3 datasets. Likewise, the MUSCLE alignment of the EBI server, which accepts only up to 500 sequences, is excluded from set 3. The alignments are then fed to IQ-TREE for the downstream analysis because it has been recently shown to be the best-performing methodology among various empirical phylogenomic matrices [36].
For each alignment, a set of nine substitution models - namely Dayhoff [2], JJT [3], BLOSUM62 [4], WAG [5], PMB [6], DCMut [7,37], JTTDCmut [7,37], LG [8], and VT [9] - are used to find the most compatible substitution model for a given dataset.
To quickly construct the evolutionary tree through an ultrafast bootstrap methodology based on a customized protocol, the IQ-TREE server is used [15]. The ML-based phenetic analysis parametrically estimates the evolutionary tree through several features, including branch length, nucleotide composition bias, and corrected distances between taxa [38]. As the theoretical probability is dependent on the observed data and not the experimental results, the correlation coefficient is further evaluated to find more accurate phylogenetic solutions [39-41]. The evolutionary trees are subsequently derived at the correlation coefficient of 0.9 for each of the constructed sequence alignments. As bootstrapping evaluates the robustness of a phylogenetic solution, a fast 1000-bootstrap run is utilized for the alignments to create their evolutionary tree to identify the most correct substitution matrix and alignment procedure based on the phylogenetic accuracy [42].
2.3. Evolutionary Analysis
The ML-based trees are assessed through log-likelihood, total tree length, and the total internal branch length score to evaluate the phylogenetic relationships robustly. An evolutionarily closer sequence pair, often sharing a higher sequence identity, results in a smaller evolutionary divergence/branch length; it should strengthen the approximation of the log-likelihood metric [1]. Branch length reflects the sequence variation within the selected sequence dataset, and by excluding the terminal branches, the internal branch length score indicates the putative ancestral divergence [43]. When assessing the evolutionary trees, constructed through every alignment based on all the substitution models used herein, the most-accurate tree is defined as the one with the highest log-likelihood value. The mutually synchronous behavior of the other two scores is subsequently evaluated for a given set of alignment and substitution models, as an attempt to highlight the current pitfalls of these measures. Visualizing the evolutionary trees using IToL (https://itol.embl.de/), the topological differences across the trees are rationalized [44].
3. RESULTS AND DISCUSSION
3.1. Building the Sequence Dataset
To nullify the impact of sequence length on deriving the accurate phylogenetic trees, the protein families encoding less than 1000 entries are considered. These non-redundant sequence datasets 1–3 contain 27, 105, and 419 sequences with lengths of 100–484, 78–4427, and 38–754, respectively, and encode a total of 5612, 140131, and 69311 residues. Given the vast sequence space of these sets and the absence of a high-performance computing cluster machine, our methodology is drafted on the basis of only a few online alignment servers. While datasets 1, 2, and 3 show a sequence identity within the range of 2.5–91, 1.85–80.1, and 1.61–99.4 respectively, their average sequence identity is orderly found to be 28.260 ± 4.179, 16.916 ± 2.966, and 28.314 ± 4.476, suggesting a higher evolutionary divergence among the set 2 sequences.
3.2. Evolutionary Analysis for Three Datasets
For the sequence datasets, the ML-based phylogenetic tree is constructed through the ultrafast bootstrap methodology of IQTree to save computational resources and time [15]. For the three datasets 1–3, we orderly constructed 117, 81, and 72 trees and assessed these 270 trees using the log-likelihood score [1,45], total tree length [15], and the sum of the internal branch lengths [46]. These datasets and their assessment scoring files are available at our online repository (https://github.com/ashishr123/phylogenydatasets). Among the three available strategies, the server maximum parsimony (MP) attempts to estimate the tree with the fewest evolutionary changes to explain the available sequence data under the assumption that the genuine phylogeny reflects the tree produced through the fewest number of mutations [47,48]. Similarly, the neighborhood joining (NJ) method, which is computationally efficient for handling massive datasets, generates a phylogenetic tree from the distance matrix of the mutual dissimilarities among the sequences [49,50]. On the other hand, ML predicts the evolutionary tree with the highest likelihood score to explain the given sequence data, assuming a probabilistic model of sequence evolution [50-52]. Due to its simplicity, MP is only effective for smaller sequence datasets, evolving under a very simple evolutionary model, and does not consider the variance in substitution rates across different sites. Likewise, NJ relies on a distance matrix, which might not adequately depict the complexity of the evolutionary process, and as a result, NJ cannot estimate branch lengths inside a tree. Contrary to these strategies, ML is computationally demanding and needs more complex models for accurate estimation, making it more suitable for large datasets. Hence, ML is used for the current study as well.
As the objective of the study is to select the most optimal sequence alignment and its best-fitted residue substitution model based on the topological scores of the resultant evolutionary tree, algorithms like ProtTest [53] are not used to evaluate the likelihood under every candidate residue substitution model. Likewise, the PhyML is not used extensively to automatically prioritize a model selection parameter for any alignment.
The trees with the lowest internal branch length scores and highest log-likelihood values are selected as the most accurate. By correlating the maximum, minimum, average, and standard deviation scores for the 13 constructed alignments against the 9 substitution models for set 1, we have observed that the total tree length and total internal branch length follow a similar scoring pattern, as expected [Figure 2]. However, the scoring undulations for the log-likelihood score are found quite different, and it fell in line with the results of a recent publication [27]. A similar trend is also observed for the set 2 and set 3 datasets [Figures 3 and 4, respectively].
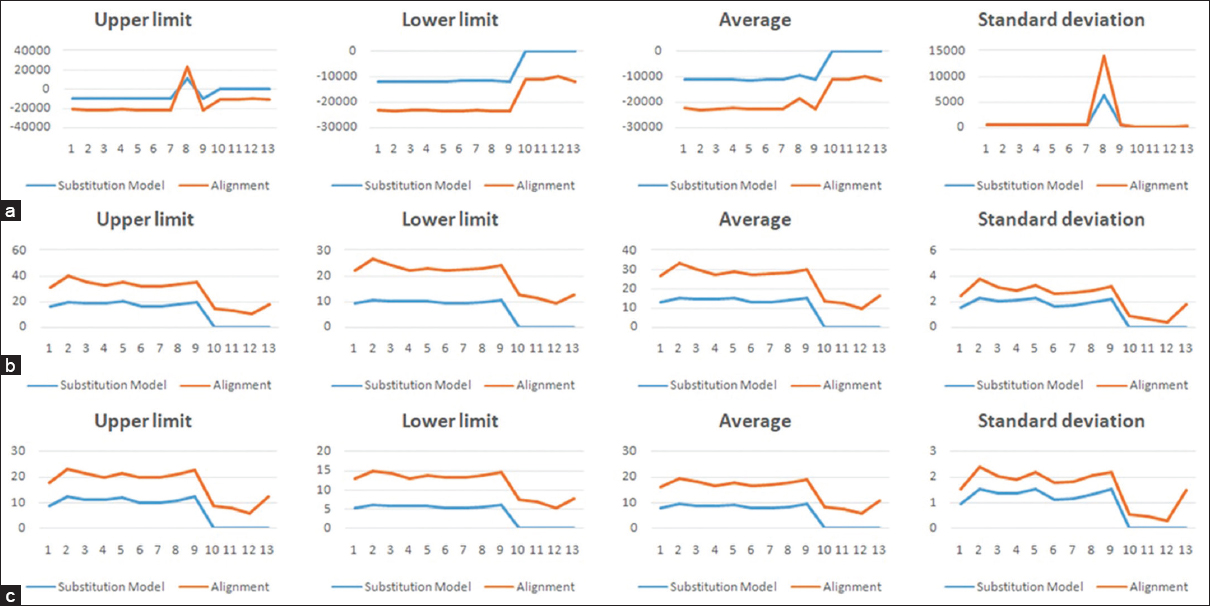 | Figure 2: Maximum, minimum, average, and standard deviation scoring undulations for (a) log-likelihood score, (b) total tree length, (c) total internal branch length for the deployed substitution models (blue) and alignments (red) for the 27-sequence set 1. [Click here to view] |
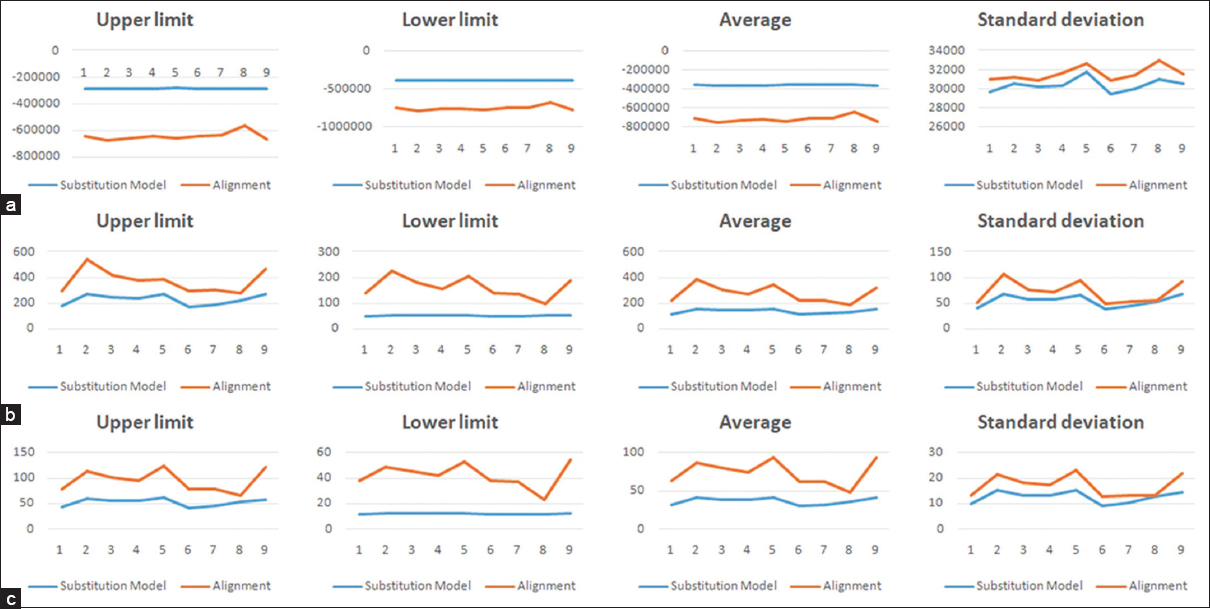 | Figure 3: Maximum, minimum, average, and standard deviation scoring undulations for (a) log-likelihood score, (b) total tree length, (c) total internal branch length for the deployed substitution models (blue) and alignments (red) for the 105-sequence set 2. [Click here to view] |
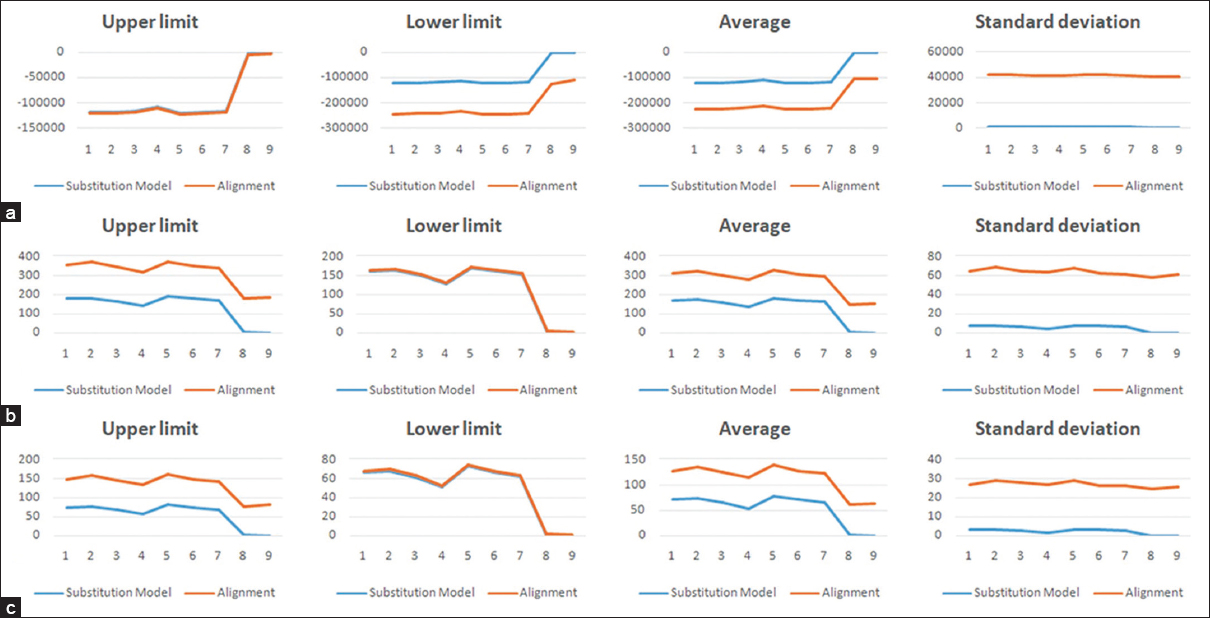 | Figure 4: Maximum, minimum, average, and standard deviation scoring undulations for (a) log-likelihood score, (b) total tree length, (c) total internal branch length for the deployed substitution models (blue) and alignments (red) for the 419-sequence set 3. [Click here to view] |
For all the set 1-set 3 trees, total internal branch length and total tree length scores overlap, as expected [Figure 5]. According to these scores, clustal alignment with the BLOSUM62 substitution matrix shows the most accurate phylogenetic tree. In contrast, PROMALS3D alignment for the DCMut matrix provides the least accurate result for all of the set 1-set 3 trees. It suggests that the structure-based sequence alignment should not be directly employed for a study unless explicitly evaluated for the selected dataset. Hence, the biologically correct sequence alignment and residue substitution model should be used to derive a more accurate evolutionary relationship, as also pinpointed earlier [54].
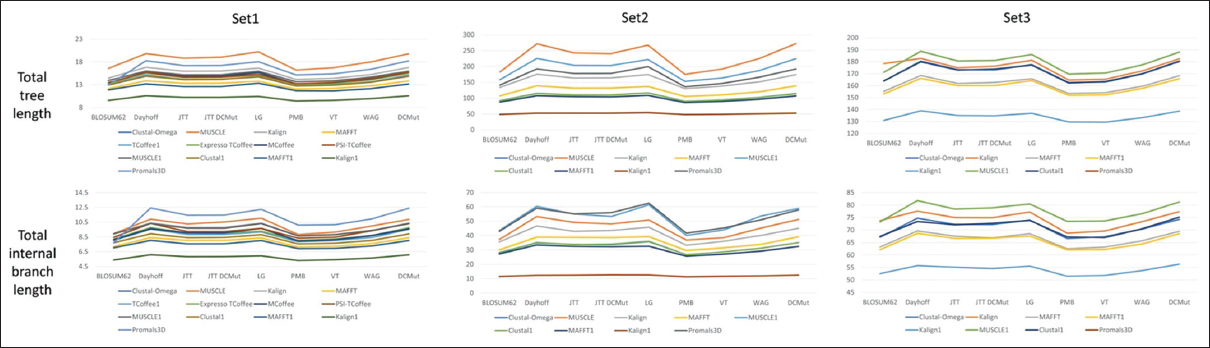 | Figure 5: Scoring alterations of the total tree length and internal branch length of the three sequence datasets set 1-set 3 for the phylogenetic trees constructed through the alignments on the basis of the selected substitution models. [Click here to view] |
3.3. Finding the Top-ranked Alignments and Substitution Models
The evolutionary likelihood of a phylogenetic tree is assessed through three scoring measures, i.e., log-likelihood, total tree length, and total internal tree length [55]. A set of 270 trees (117 for set 1, 81 for set 2, and 72 for set 3) are constructed for the three datasets, and assessing each of it using the three scores [Tables 1-3], it allowed us to conclude the following facts/figures. Among these trees, the top-ranked phylogenetic solutions, yielded by the best alignments and the more accurate substitution models, are summarized in Table 4. The lower and upper limits of these three scores and the most-accurate alignments and substitution models yielding these trees are orderly reported in Tables 5 and 6.
Table 1: Log-likelihood/total tree length/total internal branch length scores of phylogenetic trees with respect to various substitution matrices and alignments of set 1.
| Alignment | BLOSUM 62 | Dayhoff | JTT | JTT DCMut | LG | PMB | VT | WAG | DCMut | Minimum | Maximum | Average | Standard deviation |
|---|---|---|---|---|---|---|---|---|---|---|---|---|---|
| CLUSTAL- Omega | −11036.7 /12.939 /7.702 | −11139.7 /14.875 /8.937 | −11079.5 /14.131 /8.396 | −11082.2 /14.170 /8.419 | −11191.6 /14.795 /8.812 | −11015.6 /12.704 /7.547 | −11018.8 /12.893 /7.650 | −11029.9 /13.545 /8.024 | −11138.7 /14.845 /8.915 | −11191.6 /12.704 /7.547 | −11015.6 /14.875 /8.937 | −11081.4 /13.877 /8.267 | 62.979 /0.884 /0.556 |
| MUSCLE | −11772.8 /16.581 /8.947 | −11845.0 /19.847 /10.902 | −11793.9 /18.822 /10.251 | −11792.2 /19.05 /10.526 | −11898.2 /20.227 /11.039 | −11756.3 /16.216 /8.833 | −11748.8 /16.738 /9.146 | −11756.3 /18.016 /9.984 | −11844.0 /19.796 /10.872 | −11898.2 /16.216 /8.833 | −11748.8 /20.227 /11.039 | −11800.8 /18.366 /10.056 | 51.083 /1.539 /0.877 |
| Kalign | −11378.2 /14.45 /8.876 | −11470.2 /16.831 /10.388 | −11414.7 /15.965 /9.782 | −11416.0 /16.001 /9.795 | −11494.4 /16.644 /10.374 | −11358.9 /14.158 /8.691 | −11360.7 /14.416 /8.8464 | −11365.2 /15.229 /9.388 | −11469.2 /16.790 /10.360 | −11494.4 /14.158 /8.691 | −11358.9 /16.831 /10.388 | −11414.2 /15.610 /9.611 | 52.681 /1.075 /0.692 |
| MAFFT | −11073.4 /12.143 /7.195 | −11120.5 /13.856 /8.388 | −11092.6 /13.322 /8.020 | −11092.5 /13.338 /8.031 | −11165.3 /13.763 /8.346 | −11065.5 /12.042 /7.134 | −11055.3 /12.191 /7.220 | −11046.0 /12.738 /7.589 | −11120.1 /13.831 /8.368 | −11165.3 /12.042 /7.134 | −11046.0 /13.856 /8.388 | −11092.3 /13.025 /7.810 | 37.888 /0.758 /0.531 |
| TCoffee1 | −11421.2 /12.976 /7.997 | −11512.2 /15.173 /9.561 | −11443.6 /14.181 /8.832 | −11444.2 /14.201 /8.839 | −11556.2 /14.688 /9.172 | −11397.8 /12.742 /7.827 | −11400.5 /13.032 /8.033 | −11415.9 /13.611 /8.411 | −11511.0 /15.143 /9.538 | −11556.2 /12.742 /7.827 | −11397.8 /15.173 /9.561 | −11455.8 /13.972 /8.690 | 56.801 /0.931 /0.660 |
| EXPRESSO TCoffee | −11508.4 /13.281 /8.203 | −11622.3 /15.568 /9.777 | −11545.0 /14.601 /9.046 | −11545.5 /14.625 /9.055 | −11661.8 /15.122 /9.275 | −11483.8 /13.029 /8.021 | −11491.1 /13.316 /8.212 | −11513.8 /14.052 /8.701 | −11620.7 /15.536 /9.753 | −11661.8 /13.029 /8.021 | −11483.8 /15.568 /9.777 | −11554.7 /14.348 /8.894 | 64.694 /0.979 /0.657 |
| MCoffee | −11421.2 /13.452 /8.117 | −11503.1 /15.703 /9.620 | −11439.6 /14.839 /9.046 | −11439.2 /14.861 /9.046 | −11561.3 /15.657 /9.658 | −11403.8 /13.208 /7.950 | −11395.7 /13.466 /8.116 | −11409.9 /14.271 /8.679 | −11501.9 /15.671 /9.602 | −11561.3 /13.208 /7.950 | −11395.7 /15.703 /9.658 | −11452.8 /14.570 /8.870 | 56.548 /1.0153 /0.689 |
| PSI TCoffee | −11507.4 /13.460 /8.447 | −11592.7 /15.686 /10.333 | −11532.6 /14.648 /9.218 | −11534.6 /14.674 /9.221 | −11651.2 /15.250 /9.666 | −11481.5 /13.205 /8.320 | −11489.4 /13.491 /8.462 | −11506.7 /14.371 /9.349 | −11591.6 /15.653 /10.306 | −11651.2 /13.205 /8.320 | −11506.7 /15.686 /10.333 | −8986.0 /14.493 /9.258 | 7685.013 /0.945 /0.758 |
| MUSCLE1 | −11425.2 /13.933 /8.93 | −11467.9 /15.989 /10.298 | −11426.8 /15.151 /9.693 | −11427.9 /15.170 /9.687 | −11525.3 /15.951 /10.3 | −11406.7 /13.657 /8.639 | −11399.9 /13.842 /8.796 | −11399.5 /14.672 /9.391 | −11466.8 /15.951 /10.274 | −11525.3 /13.657 /8.639 | −11399.5 /15.989 /10.300 | −11438.4 /14.924 /9.556 | 41.291 /0.947 /0.660 |
| CLUSTAL1 | −11036.7 /12.939 /7.702 | −11139.7 /14.876 /8.938 | −11079.5 /14.131 /8.396 | −11082.2 /14.17 /8.42 | −11191.6 /14.795 /8.812 | −11015.6 /12.704 /7.547 | −11018.8 /12.893 /7.65 | −11029.9 /13.545 /8.025 | −11138.7 /14.846 /8.916 | −11191.6 /12.704 /7.547 | −11015.653 /14.876 /8.938 | −11081.4 /13.878 /8.267 | 62.979 /0.884 /0.557 |
| MAFFT1 | −11015.7 /11.863 /7.020 | −11062.2 /13.175 /8.027 | −11003.5 /12.593 /7.559 | −11004.4 /12.579 /7.571 | −11092.1 /13.334 /8.007 | −11002.1 /11.682 /6.900 | −10988.0 /11.658 /6.942 | −10976.2 /12.13 /7.27 | −11061.9 /13.153 /8.01 | −11092.1 /11.658 /6.9 | −10976.256 /13.334 /8.027 | −11022.9 /12.463 /7.479 | 39.449 /0.661 /0.468 |
| Kalign 1 | −10046.5 /9.578 /5.361 | −10048.5 /10.571 /6.079 | −10055.8 /10.223 /5.822 | −10053.5 /10.228 /5.82 | −10013.0 /10.429 /5.927 | −10053.7 /9.453 /5.289 | −10030.1 /9.6 /5.402 | −9982.5 /9.950 /5.636 | −10048.5 /10.556 /6.068 | −10055.8 /9.453 /5.289 | −9982.5 /10.571 /6.079 | −10036.9 /10.066 /5.712 | 24.639 /0.435 /0.303 |
| PROMALS3D | −11036.7 /12.939 /7.702 | −11832.6 /18.28 /12.423 | −11775.2 /17.192 /11.432 | −11775.4 /17.222 /11.448 | −11888.4 /18.053 /12.237 | −11732.1 /15.138 /10.093 | −11732.4 /15.366 /10.140 | −11747.9 /16.398 /10.946 | −11831.4 /18.23 /12.38 | −11888.4 /12.939 /7.702 | −11036.7 /18.28 /12.423 | −11705.8 /16.535 /10.978 | 256.342 /1.781 /1.51 |
| Minimum | −11772.8 /9.578 /5.361 | −11845.0 /10.571 /6.079 | −11793.9 /10.223 /5.82 | −11792.2 /10.228 /5.822 | −11898.2 /10.429 /5.927 | −11756.3 /9.453 /5.289 | −11748.8 /9.6 /5.402 | −11756.3 /9.95 /5.636 | −11844.0 /10.556 /6.068 | ||||
| Maximum | −10046.5 /16.581 /8.947 | −10048.5 /19.847 /12.423 | −10055.8 /18.822 /11.432 | −10053.5 /19.05 /11.448 | −10013.0 /20.227 /12.237 | −10053.7 /16.216 /10.093 | −10030.1 /16.738 /10.14 | 11506.7 /18.016 /10.946 | −10048.5 /19.796 /12.38 | ||||
| Average | −11206.2 /13.118 /7.861 | −11335.1 /15.418 /9.513 | −11283.2 /14.6 /8.884 | −11283.8 /14.638 /8.914 | −11376.2 /15.285 /9.356 | −11244.1 /13.072 /7.907 | −11240.7 /13.3 /8.047 | −9474.3 /14.041 /8.569 | −11334.2 /15.385 /9.489 | ||||
| Standard deviation | 424.059/ 1.57/ 0.973 | 465.843 /2.271 /1.54 | 449.615 /2.085 /1.364 | 449.917 /2.127 /1.389 | 487.047 /2.328 /1.54 | 439.223 /1.637 /1.143 | 444.995 /1.725 /1.162 | 6320.371 /1.958 /1.338 | 465.484 /2.261 /1.53 |
Table 2: Log-likelihood/total tree length/total internal branch length scores of phylogenetic trees with respect to various substitution matrices and alignments of set 2.
| Alignment | BLOSUM 62 | Dayhoff | JTT | JTT DCMut | LG | PMB | VT | WAG | DCMut | Minimum | Maximum | Average | Standard deviation |
|---|---|---|---|---|---|---|---|---|---|---|---|---|---|
| CLUSTAL - Omega | −352939.8 /92.163 /28.134 | −355655.9 /114.968 /34.905 | −355723.7 /109.971 /33.809 | −355660 /109.946 /33.693 | −355579.9 /116.608 /35.843 | −352643.3 /90.091 /26.624 | −353049.3 /94.353 /28.589 | −353502.2 /102.204 /31.186 | −355629.3 /114.197 /35.143 | −355723.7 /90.091 /26.624 | −352643.3 /116.608 /35.843 | −354487.0 /104.944 /31.992 | 1396.453 /10.464 /3.452 |
| MUSCLE | −389924.5 /182.637 /37.271 | −391294.2 /271.607 /53.235 | −391017.7 /242.83 /49.174 | −390984.4 /240.583 /48.096 | −391277.6 /267.359 /50.863 | −389736.4 /175.167 /36.864 | −390074.1 /191.754 /38.525 | −390566.1 /224.786 /45.256 | −391293 /272.449 /51.243 | −391294.2 /175.167 /36.864 | −389736.4 /272.449 /53.235 | −390685.3 /229.908 /45.614 | 628.278 /38.641 /6.449 |
| Kalign | −370841.3 /133.68 /35.568 | −371914.7 /175.436 /46.694 | −371798.1 /163.511 /43 | −371746.8 /164.071 /43.574 | −370790.5 /174.236 /45.866 | −370783.4 /130.037 /33.308 | −370454.5 /137.865 /36.013 | −370067.2 /151.208 /40.156 | −371905.3 /174.001 /45.119 | −371914.7 /130.037 /33.308 | −370067.2 /175.436 /46.694 | −371144.6 /156.005 /41.033 | 702.325 /18.303 /4.974 |
| MAFFT | −357701.7 /107.146 /30.045 | −361105.2 /138.879 /38.904 | −360086.3 /131.356 /38.722 | −360088.6 /131.575 /38.549 | −359272.5 /136.837 /39.254 | −357647.2 /105.16 /29.619 | −357917.9 /110.302 /31.451 | −358393.8 /119.773 /33.887 | −361092.8 /138.676 /39.158 | −361105.2 /105.160 /29.619 | −357647.2 /138.879 /39.254 | −359256.2 /124.41 /35.51 | 1401.538 /13.946 /4.214 |
| MUSCLE1 | −375031.8 /158.051 /43.569 | −376923.2 /225.427 /60.359 | −376366 /203.589 /54.963 | −376328.8 /202.943 /53.314 | −376471.9 /221.816 /61.421 | −374833.4 /153.04 /40.145 | −375067.9 /163.484 /43.97 | −375584.6 /186.847 /53.608 | −376893.1 /224.712 /58.924 | −376923.2 /153.04 /40.145 | −374833.4 /116.595 /61.421 | −375944.5 /193.323 /52.252 | 823.605 /29.207 /7.867 |
| CLUSTAL1 | −352919.6 /92.025 /27.717 | −355655.4 /114.658 /35.220 | −355723.9 /110.238 /33.717 | −355659.1 /110.107 /34.013 | −355592.1 /116.595 /36.028 | −352650.6 /90.14 /26.624 | −353035.8 /94.008 /28.588 | −353502 /102.142 /31.181 | −355631.6 /114.602 /35.141 | −355723.9 /90.14 /26.624 | −352650.6 /116.595 /36.028 | −354485.6 /104.946 /32.025 | 1401.13 /10.556 /3.58 |
| MAFFT1 | −348864.2 /87.74 /27.204 | −352306.7 /107.563 /33.457 | −351938 /104.69 /32.425 | −351868.4 /104.173 /32.218 | −350939.0 /108.65 /32.581 | −348958.8 /86.185 /25.666 | −349444.4 /89.666 /27.068 | −349606.9 /96.576 /29.197 | −352303.4 /107.039 /32.42 | −352306.7 /86.185 /25.6 | −348864.2 /108.65 /33.457 | −350692.2 /99.144 /30.249 | 1469.692 /9.179 /2.969 |
| Kalign 1 | −287222.3 /48.657 /11.513 | −285245.4 /52.637 /12.343 | −286145.5 /52.631 /12.43 | −285901.5 /52.646 /12.683 | −281093.7 /54.294 /12.603 | −287443.1 /48.066/ 11.301 | −286129.3 /48.832 /11.687 | −283006.7 /50.786 /11.93 | −285297.9 /52.735 /12.528 | −287443.1 /48.066 /11.301 | −281093.7 /54.294 /12.683 | −285276.2 /51.254 /12.113 | 2031.102 /2.240 /0.515 |
| PROMALS3D | −378489.1 /141.084 /42.953 | −380373.8 /192.276 /59.09 | −380181.2 /177.664 /55.09 | −380148.1 /177.841 /55.997 | −380867.6 /199.335 /62.593 | −378135.8 /135.850 /41.736 | −378779.9 /146.154 /45.34 | −379482.5 /165.896 /50.997 | −380362.2 /192.059 /57.896 | −380867.6 /135.85 /41.736 | −378135.8 /199.335 /62.593 | −379646.7 /169.796 /52.410 | 966.271 /23.851 /7.531 |
| Minimum | −389924.5 /48.657 /11.513 | −391294.2 /52.637 /12.343 | −391017.7 /52.631 /12.430 | −390984.4 /52.646 /12.683 | −391277.6 /54.294 /12.603 | −389736.4 /48.06 /11.301 | −390074.1 /48.832 /11.687 | −390566.1 /50.786 /11.93 | −391293 /52.735 /12.528 | ||||
| Maximum | −287222.3 /182.637 /43.569 | −285245.4 /271.607 /60.359 | −286145.5 /242.83 /55.09 | −285901.5 /240.583 /55.997 | −281093.7 /267.359 /62.593 | −287443.1 /175.16 /41.736 | −286129.3 /191.754 /45.34 | −283006.7 /224.786 /53.608 | −285297.9 /272.449 /58.924 | ||||
| Average | −357103.8 /115.909 /31.553 | −358941.6 /154.828 /41.579 | −358775.6 /144.0547 /39.259 | −358709.5 /143.765 /39.126 | −357987.2 /155.081 /41.895 | −356981.3 /112.637 /30.21 | −357105.9 /119.602 /32.359 | −357079.1 /133.358 /36.37 | −358934.3 /154.497 /40.841 | ||||
| Standard deviation | 29646.1 /41.390 /9.825 | 30616.7 /67.62 /15.141 | 30246.8 /58.29 /13.401 | 30310.9 /57.819 /13.17 | 31845 /66.137/ 15.526 | 29511.7 /39.248/ 9.284 | 29974 /43.951 /10.242 | 31032.8 /53.5 /12.81 | 30597.7 /67.738 /14.51 |
Table 3: Log-likelihood/total tree length/total internal branch length scores of phylogenetic trees with respect to various substitution matrices and alignments of set 3.
| Alignment | BLOSUM 62 | Dayhoff | JTT | JTT DCMut | LG | PMB | VT | WAG | DCMut | Minimum | Maximum | Average | Standard Deviation |
|---|---|---|---|---|---|---|---|---|---|---|---|---|---|
| CLUSTAL - Omega | −120572.0 /163.81 /67.1 | −120149.1 /180.51 /74.69 | −118665.7 /173.35 /72.24 | −118685.2 /173.183 /72.196 | −121371.8 /177.52 /73.998 | −120201.3 /162.613 /66.574 | −119386.7 /163.049 /67.293 | −119085.6 /169.882 /70.352 | −120134.3 /180.299 /74.229 | −121371.8 /162.613 /66.574 | −118665.7 /180.510 /74.69 | −119805.7 /171.58 /70.958 | 913.213 /7.186 /3.254 |
| Kalign | −121376.9 /178.446 /73.74 | −119597.0 /182.82 /77.539 | −118156.2 /174.95 /74.963 | −118209.2 /176.268 /74.901 | −120775.6 /181.271 /77.182 | −119879.8 /164.706 /68.751 | −118962.3 /165.346 /69.582 | −118648.8 /172.361 /73.3162 | −119575.2 /182.562 /77.337 | −121376.9 /164.706 /68.751 | −118156.2 /182.82 /77.539 | −119464.5 /175.414 /74.146 | 1105.85 /6.853 /3.219 |
| MAFFT1 | −118421 /153.148 /62.1 | −117766.0 /166.062 /68.662 | −116311.3 /160.046 /66.623 | −116335.7 /160.097 /66.694 | −118831.4 /164.258 /67.607 | −118111.7 /151.9 /62.046 | −117201.8 /152.298 /62.180 | −116858.3/ 157.673 /64.348 | −117813.7/ 165.838 /68.551 | −118831.4 /151.9 /62.046 | −116311.3 /166.062 /68.662 | −117516.8 /159.035 /65.425 | 896.585 /5.677 /2.787 |
| Kalign 1 | −110861.8 /130.808 /52.521 | −109692.9 /138.932 /55.753 | −108600.1 /134.905 /55.109 | −108586.7 /134.697 /54.538 | −110161.0 /136.833 /55.570 | −110791.4 /129.537 /51.488 | −109662.6 /129.367 /51.817 | −108861.1 /133.14 /53.709 | −109688.8 /138.692 /56.314 | −110861.8 /129.537 /51.48 | −108586.7 /138.932 /56.314 | −109656.3 /134.101 /54.091 | 858.103 /3.672 /1.791 |
| MUSCLE1 | −122204.0 /171.17 /73.244 | −121709.1 /188.806 /81.76 | −120287.5 /180.673 /78.378 | −120305.5 /181.099 /78.85 | −122949.8 /186.128 /80.417 | −121862 /169.651 /73.467 | −121035.6 /170.579 /73.605 | −120825.4 /177.425 /76.478 | −121682.6 /188.214 /81.216 | −122949.8 /169.651 /73.244 | −120287.5 /188.806 /81.76 | −121429.1 /179.305 /77.491 | 889.403 /7.585 /3.421 |
| CLUSTAL1 | −120555.5 /163.969 /67.456 | −120131.8 /179.979 /73.405 | −118662.5 /173.05 /72.061 | −118655.3 /173.878 /72.687 | −121346.6 /177.247 /73.819 | −120225.7 /162.195 /67.254 | −119392.7 /163.478 /66.948 | −119128.7 /169.992 /70.48 | −120128.8 /180.618 /75.1 | −121346.6 /162.195 /66.948 | −118655.3 /180.6 /75.1 | −119803.1 /171.601 /71.024 | 907.121 /7.123 /3.12 |
| MAFFT | −118360.3 /155.195 /63.194 | −117694.6 /168.449 /69.645 | −116268.3 /161.844 /67.53 | −116287.4 /162.643 /66.832 | −118733.5 /165.775 /68.54 | −118073.2 /153.464 /62.4 | −117097.8 /154.153 /63.124 | −116721.7 /159.505 /65.67 | −117707.7 /168.38 /69.48 | −118733.5 /153.464 /62.46 | −116268.3 /168.449 /69.645 | −117438.3 /161.045 /66.27 | 893.85 /5.871 /2.805 |
| PROMALS3D | −127711.3 /181.274 /76.23 | −127524.1 /202.405 /84.493 | −125981.4 /192.017 /81.075 | −125996.1 /192.294 /81.293 | −128789.1 /198.378 /83.657 | −127342 /178.924 /75.747 | −126564.7 /180.181 /76.202 | −126523.5 /188.355 /79.735 | −127469 /201.509 /84.51 | −128789.1 /178.924 /75.747 | −125981.4 /202.405 /84.51 | −127100.2 /190.593 /80.327 | 914.485 /9.087 /3.58 |
| Minimum | −127711.3 /130.808 /52.521 | −127524.1 /138.932 /55.753 | −125981.4 /134.905 /55.109 | −125996.1 /134.697 /54.53 | −122949.8 /136.833 /55.57 | −121862 /129.537 /51.48 | −121035.6 /129.367 /51.817 | −126523.5 /133.14 /53.709 | −109688.8 /138.692 /56.314 | ||||
| Maximum | −110861.8 /178.446 /73.744 | −109692.9 /202.405 /81.76 | −108600.1 /180.673 /78.378 | −108586.7 /181.099 /81.293 | −110161.0 /198.378 /80.417 | −110791.4 /178.924 /73.467 | −109662.6 /180.181 /73.605 | −108861.1 /177.425 /76.478 | −109688.8 /188.214 /81.216 | ||||
| Average | −120007.8 /162.227 /66.951 | −119283.1 /175.996 /73.243 | −117866.6 /168.854 /70.997 | −117882.6 /169.27 /70.992 | −120369.9 /173.426 /72.59 | −119560.9 /159.124 /65.974 | −118663 /159.806 /66.34 | −118331.6 /166.042 /69.262 | −119275 /175.764 /73.34 | ||||
| Standard Deviation | 4713.847 /16.17 /7.726 | 4959.347 /18.798 /8.94 | 4838.96 /17.031 /8.089 | 4846.178 /17.23 /8.39 | 5195.16 /18.355 /8.776 | 4598.335 /14.712 /7.549 | 4702.638 /15.122 /7.563 | 4914.754 /16.445 /8.104 | 4942.293 /18.653 /8.737 |
Table 4: Highest and lowest limits of the three scoring measures for the three datasets.
| Dataset | Log-likelihood alignment protocol (Substitution model) | Total tree length alignment protocol (Substitution model) | Total internal tree length alignment protocol (Substitution model) |
|---|---|---|---|
| Set 1 | |||
| Lowest | −11898.259 MUSCLE (LG) | 9.453 Kalign 1 (PMB) | 5.289 Kalign 1 (PMB) |
| Highest | −9982.515 Kalign 1 (WAG) | 20.227 MUSCLE (LG) | 12.423 PROMALS3D (Dayhoff) |
| Set 2 | |||
| Lowest | −391294.242 MUSCLE (Dayhoff) | 48.06 Kalign 1 (PMB) | 11.301 Kalign 1(PMB) |
| Highest | −281093.705 Kalign 1 (LG) | 272.449 MUSCLE (DCMut) | 62.593 PROMALS3D (LG) |
| Set 3 | |||
| Lowest | −128789.188 PROMALS3D (LG) | 129.367 Kalign 1 (VT) | 51.48 Kalign 1 (PMB) |
| Highest | −120287.5159 MUSCLE1 (JTT) | 202.405 PROMALS3D (Dayhoff) | 84.51 PROMALS3D (DCMut) |
Table 5: Lower and upper limits of the three scores for the phylogenetic trees, constructed using the most-accurate sequence alignments.
| Dataset | Log-likelihood alignment protocol | Total tree length alignment protocol | Total internal tree length alignment protocol |
|---|---|---|---|
| Set 1 | |||
| Lowest | −11800.865±51.083 MUSCLE | 10.066±0.435 Kalign 1 | 5.712±0.303 Kalign 1 |
| Highest | −8986.079±7685 013 PSI TCoffee | 18.366±1.539 MUSCLE | 10.978±1.511 PROMALS3D |
| Set 2 | |||
| Lowest | −390685.369±628.278 MUSCLE | 51.254±2.24 Kalign 1 | 12.113±0.515 Kalign 1 |
| Highest | −285276.218±2031.102 Kalign 1 | 229.908±38.641 MUSCLE | 52.41±7.867 PROMALS3D |
| Set 3 | |||
| Lowest | −127100.2±914.485 MUSCLE1 | 179.305±7.585 MUSCLE1 | 77.491±3.421 MUSCLE1 |
| Highest | −121429.103±1105.85 PROMALS3D | 190.593±9.087 PROMALS3D | 80.327±3.580 PROMALS3D |
Table 6: Lower and upper limits of the three scores for the phylogenetic trees, constructed using the most-accurate substitution models.
| Dataset | Log-likelihood Best substitution model | Total tree length best substitution model | Total internal tree length best substitution model |
|---|---|---|---|
| Set 1 | |||
| Lowest | -11376.241±487 047 LG | 13.072±1.637 PMB | 7.861±0.973 BLOSUM62 |
| Highest | −9474.36±6320.371 WAG | 15.418±2.271 Dayhoff | 9.513±1.54 Dayhoff |
| Set 2 | |||
| Lowest | −358941.659±29511.738 Dayhoff | 112.637±39.248 PMB | 30.21±9.284 PMB |
| Highest | −357079.167±31845.036 WAG | 155.0811±67.738 LG | 41.579±15.52 Dayhoff |
| Set 3 | |||
| Lowest | −120369.906±4838.96 LG | 159.124±14.712 PMB | 65.974±7.549 PMB |
| Highest | −117866.669±5195.16 JTT | 175.996±18.798 Dayhoff | 70.992±8.940 JTTDCMut |
Ranking the evolutionary trees finds the top-ranked alignment protocols for the three sets [Table 5]; it is observed that MUSCLE, MUSCLE, and MUSCLE1 show the lowest log-likelihood scores. Further, for all the sets, Kalign 1, Kalign 1, and MUSCLE1 are found to yield the most accurate phylogenetic solutions, with the lowest total tree length and total internal branch length scores, against the respective solutions of MUSCLE, MUSCLE and PROMALS3D, and PROMALS3D, PROMALS3D and PROMALS3D. Among these best-scoring alignment protocols, Kalign 1, MUSCLE1, and MUSCLE are orderly found to yield the best solutions for 4, 3, and 2 cases [26,56].
Evaluating the trees with log-likelihood and as per the substitution models, LG, Dayhoff, and BLOSUM62 are found to yield the most accurate solutions through MUSCLE, MUSCLE, and PROMALS3D alignments. In contrast, VT, LG, and JTT models yield the corresponding worst solutions for the Kalign 1 alignments [26]. For the lowest total tree length and total internal tree length scores for sets 1-3, Kalign 1 consistently yields the best trees through PMB, PMB, and BLOSUM62 matrices, against the respective worst trees produced by LG, DCMut, and Dayhoff and Dayhoff, DCMut, and Dayhoff substitution models through MUSCLE, MUSCLE, and PROMALS3D and PROMALS3D, MUSCLE, and MUSCLE1 alignments. However, screening the best nine trees based on the substitution models [Table 6], PMB, LG, BLOSUM62, and Dayhoff-based solutions are found the best for 4, 2, 1, and 1 cases, and 7 KAlign 1 and 2 MUSCLE alignments are only found to yield the more accurate solutions.
Among the 18 evolutionary trees constructed for the various sequence alignments and substitution models of the three sets, MUSCLE, MUSCLE1, Kalign 1, and PROMALS3D protocols consistently yield the best trees for 4, 1, 11, and 2 cases for various substitution models, namely LG, PMB, Dayhoff, JTT, and BLOSUM62. Hence, the alignment and substitution matrix protocols are statistically evaluated to find the consistently correct evaluation measure [26]. Screening the best alignment protocols based on the average statistics of the three measures, Kalign 1, MUSCLE1, and MUSCLE protocols are found to yield the best trees for the 4, 3, and 2 cases, and MUSCLE1 yields the consistently correct evolutionary relationships for set 3 for all scoring parameters. However, for sets 1 and 2, MUSCLE yields the best log-likelihood trees while Kalign 1 produces the trees with the lowest total tree length and internal tree length scores. The standard deviation score for these three protocols varies between 4.251 and 5.304. Conversely, the Kalign 1 alignment orderly shows the worst tree with the highest log-likelihood score for VT, LG, and BLOSUM62 matrices for sets 1–3, and likewise is the case for MUSCLE and PROMALS3D for the tree length-based scores.
A similar analysis of the substitution measures likewise reveals another complication. It is observed that PMB, LG, Dayhoff, and BLOSUM62 yield the best trees for 5, 2, 1, and 1 cases, respectively, with the PMB model consistently being more accurate for the tree length-based measure. As per the total tree length measure, the PMB matrix yields the best solutions for all the three datasets, as also proven earlier [6,57]. For the internal tree length, BLOSUM62 and PMB substitution models yield the best tree for set 1 and sets 2 and 3. For log-likelihood, LG and Dayhoff models orderly aided us to derive the most optimal evolutionary solution for sets 1 and 3 and set 2. Further, for set 3 and set 2, the standard deviation against the mean is found within the percentage range of 4.02-34.84 for the LG and PMB matrices for the log-likelihood and total tree length score.
The analysis proves that both alignment protocol and substitution matrix are equally responsible for the construction of a biologically meaningful evolutionary tree [58], and it strongly indicates that the accuracy of a phylogenetic algorithm is highly dependent on the correct combination of these two protocols [46]. Hence, the large set of phylogenetic trees is reanalyzed to identify the top-ranked pairs of sequence alignment and substitution models and to find their consistently correct algorithmic set [Table 7].
Table 7: Best sequence alignment-substitution model algorithm for the three datasets.
| Dataset | Parameters | Best substitution matrix and alignment (Frequency) | Frequency (%) |
|---|---|---|---|
| Set 1 | Log-likelihood | LG-MUSCLE (12/13) | 92.307 |
| Total tree length | PMB-Kalign 1 (10/13) | 76.923 | |
| Total internal branch length | PMB-Kalign 1 (10/13) | 76.923 | |
| Set 2 | Log-likelihood | Dayhoff-MUSCLE (5/9) | 55.556 |
| Total tree length | PMB-Kalign 1 (7/9) | 77.778 | |
| Total internal branch length | PMB-Kalign 1 (7/9) | 77.778 | |
| Set 3 | Log-likelihood | LG-MUSCLE1 (4/8) | 50 |
| Total tree length | PMB-PROMALS3D (4/8) | 50 | |
| Total internal branch length | PMB-MUSCLE1 (4/8) | 50 |
The analysis highlights several intriguing features. First, MUSCLE alignment is found successful only for the smaller sequence datasets 1 and 2 [59]. Along with the LG and Dayhoff matrices, it orderly yields the tree with the lowest log-likelihood score for 92.307% and 55.556% of the cases for sets 1 and 2. For 270 constructed trees, the MUSCLE alignment yields correct evolutionary trees for only the LG and Dayhoff substitution matrices for sequences shorter than 500 residues for the log-likelihood measure [60], although for the distance-based measure, the PMB matrix yields a more accurate tree through the Kalign 1 alignment [61]. Further, only the log-likelihood and not the other scores clearly support the accuracy of these trees-this is not acceptable for drawing a robustly accurate phylogenetic relationship given the rapidly growing amount of sequence data [62].
Second, Kalign 1 HMM alignment yields the top-ranked tree with the lowest tree length score with only the PMB matrix for 10 of the 13 set 1 trees (76.923%) and 7 of the 9 set 2 (77.778%) trees. However, for set 2 and set 3, PMB matrix yields the more accurate tree with the lowest tree length score. Hence, PMB substitution matrix produces more accurate trees with the lowest total tree length score for all the three functionally similar datasets, and it has already been proven to be robustly accurate in handling the diverse datasets with varying size and length [14].
Third, as reported earlier, the top-ranked tree topologies are found substantially different than the sub-optimal solutions [63]. It implies a specific biological threshold for each alignment protocol to derive the meaningful results of the overlapping residues, again in line with a previous study [64]. Evaluating the trees for the location of various branches, we realize that an accurate alignment is mandatory to draw the best possible evolutionary relationship, as shown earlier [65]. However, a significant disparity is found among all the trees for the scoring parameters [13], and selection of the best tree is difficult, especially for a very large dataset [15].
To build more accurate evolutionary trees, the protocols including RaxML iteratively construct the alignments based on a guide tree [14]. The “phylogeny-aware” tools such as PRANK [66] and PAGAN [67] presume such guide trees as the true trees to ensure that the constructed alignments are evolutionarily correct and are thus termed as the post-tree analysis methods. Although the interdependence of MSA and inference of a phylogeny tree has been described in these methods, the consistently accurate set of alignment method and substitution matrix has remained largely unexplored.
3.4. Required Strategic Improvement over the Existing Phylogenetic Protocols
The sequence alignments are usually constructed through several methodologies and are substantially different for the number and placement of gaps. As incorrectly placed gaps lead to an inaccurate evolutionary tree, the alignments have even been iteratively constructed to derive the more accurate alignment and an optimal phylogenetic solution [68-71]. Likewise, different substation models have been tested to construct more accurate trees [72-74]. While the current research appears to be in dire need of such a methodology, and such a methodology will be helpful for various biological studies, be it a sequence characterization or a proteomic study, the phylogeny servers never iteratively optimize the evolutionary tree for a sequence dataset to save their processing time and computational resource.
3.5. Strategic Steps to Assess and Achieve Biological Accuracy of Alignment and Phylogeny
Prior knowledge of protein functions is given little priority in most evolutionary studies. However, it should be one of the most important factors in judging the accuracy of phylogenetic clustering. This idea is illustrated by a recent evolutionary study that analyzes the transaminases in the so-called fold-type IV group with experimentally solved structures [75]. In this study, all the four functionally distinct subfamilies (namely, l-branched chain aminotransferases, d-amino acid aminotransferases, (R)-selective transaminases [RATAs], and 4-amino-4-deoxychorismate lyases [ADCLs]) are found clustered into different clades, as also shown earlier [76,77]. However, for the promiscuous nature of several transaminases [78] and unclear metabolic role of RATAs, the phylogenetic analysis failed to accurately classify two functionally characterized RATA sequences CpuTA1 and MgiTA1, sharing a 49% sequence identity and containing conserved amino acids for both RATAs and ADCLs [75]. This confirms that the initially constructed/prioritized sequence dataset should have a sufficiently higher number of entries, with ample phylogenetic diversity and minimal redundancy. Moreover, evolutionary biologists should construct the consensus tree, as implemented by IQ-TREE server [15] and investigate the chance of shrouded negative factors through iterative assessments. A phylogenetic meta-server is thus the need of the hour to classify the protein sequences reliably, and it would be significantly helpful in bridging the ever-increasing sequence gap between the UniProtKB and Swissprot entries.
4. CONCLUSION
Evolutionary trees have long been used for several research methodologies. Here, we have focused on constructing an improved phylogenetic tree for a sequence dataset. The constructed set of 270 phylogenetic trees for the three sequence datasets shows that the accuracy of an evolutionary study is significantly determined by the compatibility of the sequence alignment and the residue substitution model, and it is not simply governed by the usually parameterized bootstrap and minimum correlation coefficient features. As bootstrapping or building numerous phylogeny trees for a sequence alignment is not the correct way to derive its more accurate evolutionary solution, the best complementary set of biologically closest alignment and the substitution model should be rigorously constructed. This study streamlines the methodology and opens avenues to design a robustly accurate phylogeny protocol by assessing the phylogeny trees based on log-likelihood and total internal branch length.
5. ACKNOWLEDGMENT
The authors would like to acknowledge the Department of Biotechnology, Koneru Lakshmaiah Education Foundation for providing the required academic support, whenever required.
6. AUTHOR CONTRIBUTION
AR conceptualized this experiment and study and then drafted the article. SN rigorously retrieved and constructed the large number of phylogenetic trees. KS extensively analyzed the datasets. KS, KV, MA, and VR reviewed the final draft. MS analyzed the datasets for confirmatory tests.
7. FUNDING
There is no funding to report.
8. CONFLICTS OF INTEREST
The authors report no financial or any other conflicts of interest in this work.
9. ETHICAL APPROVALS
This study does not involve experiments on animals or human subjects.
10. DATA AVAILABILITY
All the data is available with the authors and shall be provided upon request.
11. PUBLISHER’S NOTE
This journal remains neutral with regard to jurisdictional claims in published institutional affiliation.
12. DISCLOSURES
This article is the revised version of the initial preprint manuscript, available at BioRxiv server (https://www.biorxiv.org/content/10.1101/2021.01.21.427545v1.full).
REFERENCES
1. Parks SL, Goldman N. Maximum likelihood inference of small trees in the presence of long branches. Syst Biol 2014;63:798-811. [CrossRef]
2. Barker WC, Ketcham LK, Dayhoff MO. A comprehensive examination of protein sequences for evidence of internal gene duplication. J Mol Evol 1978;10:265-81. [CrossRef]
3. Jones DT, Taylor WR, Thornton JM. The rapid generation of mutation data matrices from protein sequences. Comput Appl Biosci 1992;8:275-82. [CrossRef]
4. Henikoff S, Henikoff JG. Performance evaluation of amino acid substitution matrices. Proteins 1993;17:49-61. [CrossRef]
5. Whelan S, Goldman N. A general empirical model of protein evolution derived from multiple protein families using a maximum-likelihood approach. Mol Biol Evol 2001;18:691-9. [CrossRef]
6. Veerassamy S, Smith A, Tillier ER. A transition probability model for amino acid substitutions from blocks. J Comput Biol 2003;10:997-1010. [CrossRef]
7. Kosiol C, Goldman N. Different versions of the Dayhoff rate matrix. Mol Biol Evol 2005;22:193-9. [CrossRef]
8. Le SQ, Gascuel O. An improved general amino acid replacement matrix. Mol Biol Evol 2008;25:1307-20. [CrossRef]
9. Tobias M, Martin V. Modeling amino acid replacement. J Comput Biol 2000;7:16.
10. Kemena C, Notredame C. Upcoming challenges for multiple sequence alignment methods in the high-throughput era. Bioinformatics 2009;25:2455-65. [CrossRef]
11. Guindon S, Lethiec F, Duroux P, Gascuel O. PHYML online-a web server for fast maximum likelihood-based phylogenetic inference. Nucleic Acids Res 2005;33:W557-9. [CrossRef]
12. Boc A, Diallo AB, Makarenkov V. T-REX:A web server for inferring, validating and visualizing phylogenetic trees and networks. Nucleic Acids Res 2012;40:W573-9. [CrossRef]
13. Hall BG. Building phylogenetic trees from molecular data with MEGA. Mol Biol Evol 2013;30:1229-35. [CrossRef]
14. Stamatakis A. RAxML version 8:A tool for phylogenetic analysis and post-analysis of large phylogenies. Bioinformatics 2014;30:1312-3. [CrossRef]
15. Nguyen LT, Schmidt HA, von Haeseler A, Minh BQ. IQ-TREE:A fast and effective stochastic algorithm for estimating maximum-likelihood phylogenies. Mol Biol Evol 2015;32:268-74. [CrossRef]
16. Lemoine F, Correia D, Lefort V, Doppelt-Azeroual O, Mareuil F, Cohen-Boulakia S, et al. NGPhylogeny.fr:New generation phylogenetic services for non-specialists. Nucleic Acids Res 2019;47:W260-5. [CrossRef]
17. Chan L. The apolipoprotein multigene family:Structure, expression, evolution, and molecular genetics. Klin Wochenschr 1989;67:225-37. [CrossRef]
18. Keeling PJ, Fast NM, McFadden GI. Evolutionary relationship between translation initiation factor eIF-2gamma and selenocysteine-specific elongation factor SELB:Change of function in translation factors. J Mol Evol 1998;47:649-55. [CrossRef]
19. Rizner TL, Stojan J, Adamski J. 17b-hydroxysteroid dehydrogenase from the fungus Cochliobolus lunatus:Structural and functional aspects. Chem Biol Interact 2001;130-2:793-803. [CrossRef]
20. Sharma A, Rani S, Goel M. Navigating the structure-function-evolutionary relationship of CsaA chaperone in Archaea. Crit Rev Microbiol 2018;44:274-89. [CrossRef]
21. Katoh K, Misawa K, Kuma K, Miyata T. MAFFT:A novel method for rapid multiple sequence alignment based on fast Fourier transform. Nucleic Acids Res 2002;30:3059-66. [CrossRef]
22. Edgar RC. MUSCLE:Multiple sequence alignment with high accuracy and high throughput. Nucleic Acids Res 2004;32:1792-7. [CrossRef]
23. Lassmann T, Sonnhammer EL. Kalign-an accurate and fast multiple sequence alignment algorithm. BMC Bioinformatics 2005;6:298. [CrossRef]
24. Di Tommaso P, Moretti S, Xenarios I, Orobitg M, Montanyola A, Chang JM, et al. T-coffee:A web server for the multiple sequence alignment of protein and RNA sequences using structural information and homology extension. Nucleic Acids Res 2011;39:W13-7. [CrossRef]
25. Sievers F, Wilm A, Dineen D, Gibson TJ, Karplus K, Li W, et al. Fast, scalable generation of high-quality protein multiple sequence alignments using clustal omega. Mol Syst Biol 2011;7:539. [CrossRef]
26. Pei J, Grishin NV. PROMALS3D:Multiple protein sequence alignment enhanced with evolutionary and three-dimensional structural information. Methods Mol Biol 2014;1079:263-71. [CrossRef]
27. Sievers F, Higgins DG. Clustal omega for making accurate alignments of many protein sequences. Protein Sci 2018;27:135-45. [CrossRef]
28. Yang Z. Maximum likelihood phylogenetic estimation from DNA sequences with variable rates over sites:Approximate methods. J Mol Evol 1994;39:306-14. [CrossRef]
29. Minh BQ, Nguyen MA, von Haeseler A. Ultrafast approximation for phylogenetic bootstrap. Mol Biol Evol 2013;30:1188-95. [CrossRef]
30. Hoang DT, Chernomor O, von Haeseler A, Minh BQ, Vinh LS. UFBoot2:Improving the ultrafast bootstrap approximation. Mol Biol Evol 2018;35:518-22. [CrossRef]
31. Huson DH, Bryant D. Application of phylogenetic networks in evolutionary studies. Mol Biol Evol 2006;23:254-67. [CrossRef]
32. Anisimova M, Gascuel O. Approximate likelihood-ratio test for branches:A fast, accurate, and powerful alternative. Syst Biol 2006;55:539-52. [CrossRef]
33. Mistry J, Chuguransky S, Williams L, Qureshi M, Salazar GA, Sonnhammer EL, et al. Pfam:The protein families database in 2021. Nucleic Acids Res 2021;49:D412-9. [CrossRef]
34. Steinegger M, Söding J. MMseqs2 enables sensitive protein sequence searching for the analysis of massive data sets. Nat Biotechnol 2017;35:1026-8. [CrossRef]
35. Alva V, Nam SZ, Söding J, Lupas AN. The MPI bioinformatics toolkit as an integrative platform for advanced protein sequence and structure analysis. Nucleic Acids Res 2016;44:W410-5. [CrossRef]
36. Zhou X, Shen XX, Hittinger CT, Rokas A. Evaluating fast maximum likelihood-based phylogenetic programs using empirical phylogenomic data sets. Mol Biol Evol 2018;35:486-503. [CrossRef]
37. Kosiol C, Bofkin L, Whelan S. Phylogenetics by likelihood:Evolutionary modeling as a tool for understanding the genome. J Biomed Inform 2006;39:51-61. [CrossRef]
38. Nabhan AR, Sarkar IN. The impact of taxon sampling on phylogenetic inference:A review of two decades of controversy. Brief Bioinform 2012;13:122-34. [CrossRef]
39. Rannala B, Yang Z. Probability distribution of molecular evolutionary trees:A new method of phylogenetic inference. J Mol Evol 1996;43:304-11. [CrossRef]
40. Kensche PR, van Noort V, Dutilh BE, Huynen MA. Practical and theoretical advances in predicting the function of a protein by its phylogenetic distribution. J R Soc Interface 2008;5:151-70. [CrossRef]
41. Nunes LA, Turvey ST, Rosindell J. The price of conserving avian phylogenetic diversity:A global prioritization approach. Philos Trans R Soc Lond B Biol Sci 2015;370:20140004. [CrossRef]
42. Felsenstein J. Confidence limits on phylogenies:An approach using the bootstrap. Evolution 1985;39:783-91. [CrossRef]
43. Brown JM, Hedtke SM, Lemmon AR, Lemmon EM. When trees grow too long:Investigating the causes of highly inaccurate Bayesian branch-length estimates. Syst Biol 2010;59:145-61. [CrossRef]
44. Sagulenko P, Puller V, Neher RA. TreeTime:Maximum-likelihood phylodynamic analysis. Virus Evol 2018;4:vex042. [CrossRef]
45. Chatzou M, Magis C, Chang JM, Kemena C, Bussotti G, Erb I, et al. Multiple sequence alignment modeling:Methods and applications. Brief Bioinform 2016;17:1009-23. [CrossRef]
46. Chang JM, Di Tommaso P, Notredame C. TCS:A new multiple sequence alignment reliability measure to estimate alignment accuracy and improve phylogenetic tree reconstruction. Mol Biol Evol 2014;31:1625-37. [CrossRef]
47. Hill T, Lundgren A, Fredriksson R, Schioth HB. Genetic algorithm for large-scale maximum parsimony phylogenetic analysis of proteins. Biochim Biophys Acta 2005;1725:19-29. [CrossRef]
48. Schneider H. The current status of the new world monkey phylogeny. An Acad Bras Cienc 2000;72:165-72. [CrossRef]
49. Kim J, Rohlf FJ, Sokal RR. The accuracy of phylogenetic estimation using the neighbor-joining method. Evolution 1993;47:471-86. [CrossRef]
50. Hillis DM, Huelsenbeck JP, Cunningham CW. Application and accuracy of molecular phylogenies. Science 1994;264:671-7. [CrossRef]
51. Goodman M, Koop BF, Czelusniak J, Fitch DH, Tagle DA, Slightom JL. Molecular phylogeny of the family of apes and humans. Genome 1989;31:316-35. [CrossRef]
52. Rathnayaka AR, Chethana KW, Phillips AJ, Liu JK, Samarakoon MC, Jones EB, et al. Re-evaluating Botryosphaeriales:Ancestral state reconstructions of selected characters and evolution of nutritional modes. J Fungi (Basel) 2023;9:184. [CrossRef]
53. Abascal F, Zardoya R, Posada D. ProtTest:Selection of best-fit models of protein evolution. Bioinformatics 2005;21:2104-5. [CrossRef]
54. Pearson WR. An introduction to sequence similarity (“homology“) searching. Curr Protoc Bioinformatics 2013;Chapter 3:3.1.1-3.1.8.
55. Nikoh N, Hayase N, Iwabe N, Kuma K, Miyata T. Phylogenetic relationship of the kingdoms Animalia, Plantae, and Fungi, inferred from 23 different protein species. Mol Biol Evol 1994;11:762-8.
56. Arenas M. Trends in substitution models of molecular evolution. Front Genet 2015;6:319. [CrossRef]
57. Philippe H, Brinkmann H, Lavrov DV, Littlewood DT, Manuel M, Wörheide G, et al. Resolving difficult phylogenetic questions:Why more sequences are not enough. PLoS Biol 2011;9:e1000602. [CrossRef]
58. Jordan G, Goldman N. The effects of alignment error and alignment filtering on the sitewise detection of positive selection. Mol Biol Evol 2012;29:1125-39. [CrossRef]
59. Deorowicz S, Debudaj-Grabysz A, Gudy?A. FAMSA:Fast and accurate multiple sequence alignment of huge protein families. Sci Rep 2016;6:33964. [CrossRef]
60. Pearson WR. Selecting the right similarity-scoring matrix. Curr Protoc Bioinformatics 2013;43:3.5.1-3.5.9. [CrossRef]
61. Nuin PA, Wang Z, Tillier ER. The accuracy of several multiple sequence alignment programs for proteins. BMC Bioinformatics 2006;7:471. [CrossRef]
62. Salichos L, Stamatakis A, Rokas A. Novel information theory-based measures for quantifying incongruence among phylogenetic trees. Mol Biol Evol 2014;31:1261-71. [CrossRef]
63. Shukla AK, Tripathi D, Reddy BR, Chandramohan D. A study on metaheuristics approaches for gene selection in microarray data:Algorithms, applications and open challenges. Evol Intell 2019;13:309-29. [CrossRef]
64. Troy CS, MacHugh DE, Bailey JF, Magee DA, Loftus RT, Cunningham P, et al. Genetic evidence for Near-Eastern origins of European cattle. Nature 2001;410:1088-91. [CrossRef]
65. Pavlopoulos GA, Soldatos TG, Barbosa-Silva A, Schneider R. A reference guide for tree analysis and visualization. BioData Min 2010;3:1. [CrossRef]
66. Löytynoja A, Goldman N. An algorithm for progressive multiple alignment of sequences with insertions. Proc Natl Acad Sci U S A 2005;102:10557-62. [CrossRef]
67. Löytynoja A, Vilella AJ, Goldman N. Accurate extension of multiple sequence alignments using a phylogeny-aware graph algorithm. Bioinformatics 2012;28:1684-91. [CrossRef]
68. Ogden TH, Rosenberg MS. Multiple sequence alignment accuracy and phylogenetic inference. Syst Biol 2006;55:314-28. [CrossRef]
69. Landan G, Graur D. Heads or tails:A simple reliability check for multiple sequence alignments. Mol Biol Evol 2007;24:1380-3. [CrossRef]
70. Blackburne BP, Whelan S. Class of multiple sequence alignment algorithm affects genomic analysis. Mol Biol Evol 2013;30:642-53. [CrossRef]
71. Sievers F, Dineen D, Wilm A, Higgins DG. Making automated multiple alignments of very large numbers of protein sequences. Bioinformatics 2013;29:989-95. [CrossRef]
72. Duchêne S, Di Giallonardo F, Holmes EC. Substitution model adequacy and assessing the reliability of estimates of virus evolutionary rates and time scales. Mol Biol Evol 2016;33:255-67. [CrossRef]
73. Hoff M, Orf S, Riehm B, Darriba D, Stamatakis A. Does the choice of nucleotide substitution models matter topologically?BMC Bioinformatics 2016;17:143. [CrossRef]
74. Shapiro B, Rambaut A, Drummond AJ. Choosing appropriate substitution models for the phylogenetic analysis of protein-coding sequences. Mol Biol Evol 2006;23:7-9. [CrossRef]
75. Pavkov-Keller T, Strohmeier GA, Diepold M, Peeters W, Smeets N, Schürmann M, et al. Discovery and structural characterisation of new fold type IV-transaminases exemplify the diversity of this enzyme fold. Sci Rep 2016;6:38183. [CrossRef]
76. Percudani R, Peracchi A. The B6 database:A tool for the description and classification of vitamin B6-dependent enzymatic activities and of the corresponding protein families. BMC Bioinformatics 2009;10:273. [CrossRef]
77. Mutti FG, Fuchs CS, Pressnitz D, Sattler JH, Kroutil W. Stereoselectivity of four ®-selective transaminases for the asymmetric amination of ketones. Adv Synth Catal 2011;353:7. [CrossRef]
78. Magnani G, Lomazzi M, Peracchi A. Completing the folate biosynthesis pathway in Plasmodium falciparum:P-aminobenzoate is produced by a highly divergent promiscuous aminodeoxychorismate lyase. Biochem J 2013;455:149-55. [CrossRef]