
1. INTRODUCTION
Enzymes, which are biomolecules that are found in all living organisms, are used for countless different biotechnological purposes. Among the many enzymes, the microbial β-D-fructofuranosidases (EC 3.2.1.26), members of the glycosyl hydrolase family (GH32), can be used in food, beverage, and pharmaceutical industries. They catalyze the hydrolysis of the β2-1 linkage found in the sucrose molecule, yielding an equimolar mixture of D-glucose and D-fructose, which is commonly known as inverted sugar. This can be a substitute for sucrose, presents a high sweetening power, and eliminates the problem of crystallization [1].
Some β-D-fructofuranosidases are also able to catalyze the transfructosylation reaction that produces fructooligosaccharides (FOSs), with the general formula GFn, where n is the number of fructosyl residues [2]. FOSs are prebiotic molecules that can be produced through the enzymatic activity of the inulinase that hydrolyzes the inulin from different sources, such as chicory, yacon, and agave, among others, or through the action of β-fructofuranosidase, which synthesizes FOSs through fructosyltransferase activity. Fructose units are linked through (2-1) β-glycosidic bonds and present a glucose unit at the non-reducing end. The main short FOSs are 1-kestose (DP3), nystose (DP4), and fructofuranosylnystose (DP5) [3]. The mechanism of production of FOS using fructofuranosidases is complex, with reactions occurring in series and parallel, which can be exemplified by the enzymes with both hydrolytic and transfructosylating activities [3]. The fructosyl residue can be donated by either sucrose or FOS molecules [4], and these can also be the acceptors for this residue. The benefits of the use of FOSs for human health, such as the stimulation of probiotic bacteria in the intestine, which prevent problems with infections, the non-cariogenic property, and the improvement of salt absorption, have already been described [5]. In addition, FOSs can be safely used by diabetic people, since they are not metabolized, thus reducing glycemic peaks [6]. Furthermore, the application of microbial invertases in food industries has been authorized by regulatory agencies in various countries [7].
The production of β-D-fructofuranosidases by filamentous fungi using both submerged fermentation (SbmF) and solid-state fermentation (SSF) has been reported. For example, the fungus Aspergillus niveus produced β-fructofuranosidase when cultured in SSF using cassava peels as substrate [8]. Enzyme production using SSF was also reported for Aspergillus tamarii URM4634 with different agro-industrial by-products as the substrate. This enzyme presented both hydrolytic and transfructosylation activities [9]. In contrast, the β-fructofuranosidases from Aspergillus phoenicis [10], Aspergillus versicolor [11], and Aspergillus carbonarius PC-4 [12] were produced using SbmF. Regardless of the fermentation technology used, the selection of the best culture conditions in terms of pH, temperature, carbon, and nitrogen sources, among others, is fundamental for fungal growth and, consequently, for enzyme production. Other fungal β-fructofuranosidases presenting transfructosylation activity were described as Aspergillus oryzae strains KB [13] and S719 [14], Aspergillus fijiensis [15] and Penicillium oxalicum [2]. Despite this, the potential of the production of biotechnologically relevant enzymes by fungal strains remains limited to a reduced number of species. Revealing such potential of other fungal species is important for the discovery of new sources of enzymes.
The fungus Aspergillus labruscus ITAL 28.255, which belongs to the section Nigri, was isolated from the Vitis labruscas L. in Brazil. It showed potential as a producer of enzymes with biotechnological interest, such as tannase and protease [16]. However, this species was analyzed for the 1st time considering the production of β-fructofuranosidase with transfructosylation activity. The aim was to evaluate the influence of different culture parameters on enzyme production, followed by purification, biochemical characterization, and analysis of its transfructosylation activity.
2. MATERIALS AND METHODS
2.1. Microorganism and Culture Conditions
The filamentous fungus A. labruscus ITAL 28.255 was kindly provided by the Institute of Food Technology of Campinas. The strain was maintained in potato dextrose agar (PDA) slants previously sterilized at 120°C, 1.5 atm for 30 min. The cultures were obtained through inoculums of spore suspension in PDA slants and incubation for 5 days at 30°C. The cultures were stored at 4°C until the use.
Initially, the fungus was cultured in 125 mL Erlenmeyer flasks containing 25 mL of Khanna [17], SR [18], Czapeck [19], YPD [20], Adams [21], and M5 [22] media, separately, with 1% (m/v) sucrose as the carbon source, initial pH of 6.0 and was sterilized at 120°C for 30 min at 1.5 atm. Thereafter, each flask was inoculated with 106 spores mL-1. The cultures were maintained at 30°C for different periods (24–120 h) under orbital agitation (100 rpm).
2.2. Influence of the Carbon and Nitrogen Sources in the Production of β-fructofuranosidase
The influence of the use of 2% (m/v) monosaccharides (glucose and fructose), sucrose, polysaccharides, and complex carbon sources, such as rye flour, barley, sugarcane bagasse, oat, and starch, was evaluated. The impact of the different concentrations (5–25 g L-1) of the selected carbon source on the enzyme production was also evaluated. Aiming at an increase in enzyme production, mixtures of carbon sources were used.
Since glucose and fructose were products of the hydrolysis of the sucrose molecule, these saccharides can repress enzyme production by the fungus. To confirm whether or not this phenomenon occurred, culture media containing 2% (m/v) sucrose as the main carbon source were supplemented with different concentrations (0–2% m/v) of both glucose and fructose, separately.
2.3. Acquisition of the Enzymatic Extracts
After cultivation, the culture media containing the fungal growth were harvested by vacuum using a Buchner funnel and Whatman No. 1 filter paper. The cell-free filtrate was named the crude filtrate. The mycelia were washed with distilled water, dried between paper filters and disrupted using a mortar with sea sand previously prepared with HCl in an ice bath, suspended with 100 mmol L-1 of sodium acetate buffer, pH 5.0, and submitted to centrifugation at 4°C, 23,000 xg, for 10 min. The pellet was discarded and the solution was named the intracellular crude extract. Both the filtrate and the intracellular crude extract were dialyzed against distilled water for 24 h at 4°C and were subsequently used for the determination of enzyme activity and the purification process.
2.4. Determination of the β-D-fructofuranosidase Activity
The enzyme activity was determined using the reducing sugar methodology according to Miller [23] with 3,5-dinitrosalicylic acid (DNS). To summarize, the reaction mixture was constituted by 500 μL of 100 mmol L-1 of sodium acetate buffer, pH 5.0 containing 1% (m/v) sucrose as the substrate and 500 μL of the enzymatic extract, reaching a final concentration of 15 mmol L-1 of the substrate in the reaction, as described by Fernandes et al. [8]. The reaction was performed at 55°C and pH 5.5 for 10 min. After incubation, the reaction was stopped by the addition of 1 mL DNS, boiled for 5 min at 100°C, cooled, and added with 5 mL distilled water. The absorbance was obtained at 540 nm and one unit of enzyme activity was expressed as the amount of enzyme required to produce 1 μmol of reducing sugar per minute under the assay conditions.
2.5. Quantification of the Protein and Carbohydrate Contents
The protein concentration was estimated using the Bradford methodology [24] with bovine serum albumin as the standard, at 595 nm, and expressed as mg of protein per mL of sample.
The estimation of the carbohydrate concentration was performed according to Dubois et al. [25] using mannose as the standard, at 490 nm. The carbohydrate content was expressed as mg per mL of sample.
2.6. Purification
The extracellular filtrate was submitted to the purification procedure in a DEAE-cellulose chromatography column (1 × 11.5 cm) equilibrated with 10 mmol L-1 Tris-HCl buffer, pH 7.0. The elution was performed at 4°C using a linear gradient of NaCl (0–1 mol L-1) in the same buffer. Fractions of 3 mL were collected at a flow rate of 1 mL min-1. The fractions with enzyme activity were pooled, dialyzed against distilled water at 4°C for 24 h, and then, lyophilized. The content was suspended with 50 mmol L-1 Tris-HCl with the addition of 50 mmol L-1 NaCl and loaded in the Sephacryl S-200 chromatography column (1 × 80 cm) equilibrated with the same buffer. Fractions of 1 mL were collected at a flow rate of 0.5 mL min-1. The fractions with enzyme activity were pooled, dialyzed against distilled water at 4°C for 24 h, and used for the electrophoresis procedure and for the determination of the physical-chemical properties.
2.7. Electrophoresis Analysis
The purified sample was loaded in 10% SDS-PAGE [26] at 120 V and 40 mA using a PowerPac source (BioRad). After the run, the gel was removed from the glass plates, stained with Coomassie Brilliant Blue R250 [27] for 30 min, and destained with the methanol: acetic acid: ultrapure water (4.5:1:4.5 v/v) solution. The Precision Plus Protein KaleidoscopeTM standard (BioRad) was used as a standard molecular mass marker (10–250 kDa).
2.8. Influence of the Temperature and pH on Enzyme Activity
The enzymatic reaction was performed from 25 to 80°C, separately, and pH from 3.0 to 9.0 using McIlvaine buffer. The temperature (50–90°C) and pH (3.0–9.0) stability were evaluated by maintaining the enzymatic samples at each temperature for different periods (5–60 min). After incubation as described, the samples were maintained in an ice bath for 5 min and used for the determination of enzyme activity. For the pH stability analysis, the enzyme samples were maintained in a pH range from 3.0 to 9.0 for different periods (5–60 min) in an ice bath. Thereafter, the enzyme activity was determined as previously described.
2.9 Influence of Different Compounds on Enzyme Activity
The influence of different salts (1 mmol L-1: AgNO3, BaCl2, CaCl2, CoCl2, CuCl2, KCl, MgCl2, MnCl2, MnSO4, NaCl, NH4Cl), 1 mmol L-1 EDTA and 1 mmol L-1 β-mercaptoethanol on enzyme activity was analyzed by adding these compounds to the reaction mixture. The enzyme activity was expressed as relative activity (%) considering the reaction without the addition of compounds as 100%.
2.10. Circular Dichroism
Far UV circular dichroism spectra (190–250 nm) were measured with a JASCO 810 spectropolarimeter (JASCO Inc., Tokyo, Japan) using 1 mm pathlength cuvettes and a protein concentration of 300 μg mL-1. All measurements were performed in 20 mM phosphate/citrate buffer (pH 5.5) at 25°C. Four spectra were collected and the spectrum of the buffer was used as the control (blank).
2.11. Hydrolysis of Different Substrates and Determination of the Kinetic Parameters
The catalytic activity of the purified fructofuranosidase was evaluated using 1% (w/v) of sucrose, raffinose, and inulin as substrates, separately, in 100 mmol L-1 sodium acetate buffer, pH 5.0, as described in the item 2.4.
The kinetic parameters maximal velocity (Vmax), Michaellis–Menten constant (KM), and catalytic efficiency (Vmax/KM) were determined using sucrose as the substrate (1–20 mM) with the aid of the software SigrafW® [28].
2.12. Production of FOSs
The transfructosylation activity of the extracellular A. labruscus fructofuranosidase was evaluated using 0.5–30% (w/v) sucrose as the substrate in 100 mmol L-1 sodium acetate buffer, pH 5.0. The reaction was performed for different periods as defined for each assay and ended by heating at 100°C for 5 min. Thereafter, the products obtained were analyzed through high-performance liquid chromatography (Shimadzu, Kyoto, Japan), with an EC 250/4.6 Nucleosil 100-NH2 (30 × 0.75 cm) column maintained at 60°C and using the refraction index as the detection system. The mobile phase was 82% (v/v) acetonitrile and ultrapure water. The 1% (w/v) sucrose, fructose, glucose, kestose, and nystose solution was used as the standard.
2.13. Reproducibility
All experiments were made in triplicate and the values represent the mean ± standard deviation.
3. RESULTS AND DISCUSSION
3.1. Production of the Fructofuranosidase
Among the culture media evaluated for enzyme production, the best levels of extracellular fructofuranosidase activity were obtained using the YPD medium (0.47 U mL-1) followed by the M5 medium (0.21 U mL-1) [Table S1]. The YPD medium contains the highest peptone concentration when compared to the other media, which can contribute positively to enzyme production since the nitrogen source is an important factor to be considered. This fact is reinforced by observing the results obtained with the Khanna and Czapeck media, which have no peptones in their composition. M5 and SR media have a low peptone concentration and the enzyme production was intermediary. The composition of the culture medium affected both the growth and the enzyme production by A. labruscus.
With regards to the best results obtained using YPD and M5 media for the production of the extracellular enzyme, the influence of the cultivation time was evaluated. The highest enzyme activity was obtained at 48 h and 120 h using the YPD and M5 media, respectively. The activity obtained with the M5 medium was two-fold higher than that with the YDP medium and, consequently, it was selected for the evaluation of other culture parameters on enzyme production [Figure S1]. The best production of the extracellular fructofuranosidase by the fungi Aspergillus thermomutatus [29] and Chrysonilia sitophila PSSF84 [30] was also obtained with 120 h of cultivation.
The extracellular fructofuranosidase was produced in the presence of all the additional carbon sources that were used and the presence of the sucrose in the M5 medium promoted the best enzyme production (0.475 U mL-1), in this case, six-fold higher than the value obtained in the absence of an additional carbon source [Table 1]. A similar result was obtained by Todero et al. [29] for the fungus A. thermomutatus. The production obtained with rye flour was similar (0.441 U mL-1) to that obtained with sucrose. The composition of rye flour is 12.5% protein, 73.3% carbohydrate, 1.7% lipids, fibers, and salts such as magnesium, calcium, and potassium. Sucrose is the second most-found carbohydrate in the composition of rye flour [31], which explains the good results obtained with this agro-industrial product as an additional carbon source. In the presence of glucose and fructose, the extracellular enzyme was also produced, indicating a constitutive synthesis.
Table 1: Influence of the carbon source (1% m/v) on the production of both intracellular and extracellular β-fructofuranosidase by -fructofuranosidase by A. labruscus ITAL 28.255.
| Carbon Source | Enzyme activity (U mL-1) | Intracellular protein (mg mL-1) | |
|---|---|---|---|
| Extracellular | Intracellular | ||
| Starch | 0.158±0.001 | 0.004±0.001 | 0.61±0.01 |
| Oatmeal | 0.318±0.002 | 0.003±0.001 | 0.94±0.02 |
| Sugarcane bagasse | 0.268±0.002 | 0.006±0.002 | 0.60±0.01 |
| Rye flour | 0.441±0.003 | 0.074±0.001 | 5.09±0.03 |
| Barley | 0.282±0.005 | 0.017±0.001 | 3.96±0.01 |
| Fructose | 0.206±0.006 | 0.024±0.001 | 9.37±0.01 |
| Glucose | 0.216±0.008 | 0.019±0.001 | 12.7±0.1 |
| Sucrose | 0.475±0.004 | 0.103±0.002 | 11.6±0.2 |
| No carbon source | 0.078±0.008 | 0.004±0.001 | 0.58±0.01 |
The cultures were performed using M5 medium, with an initial pH of 6.0, at 30°C for 120 h and under agitation (100 rpm).
Since a positive influence of the sucrose and rye flour was observed, the impact of the addition of different concentrations of these carbon sources on β-fructofuranosidase production was evaluated [Figure 1]. The increase in the carbon source concentration corresponded to the increase in the extracellular enzyme production as well, especially in the case of sucrose. However, for the intracellular form, it was observed that the presence of rye flour stimulated an accumulation beginning at 0.5% (m/v); while, with sucrose, the intracellular levels of the enzyme were reduced. These results indicate that the enzyme secretion is predominant in the presence of sucrose.
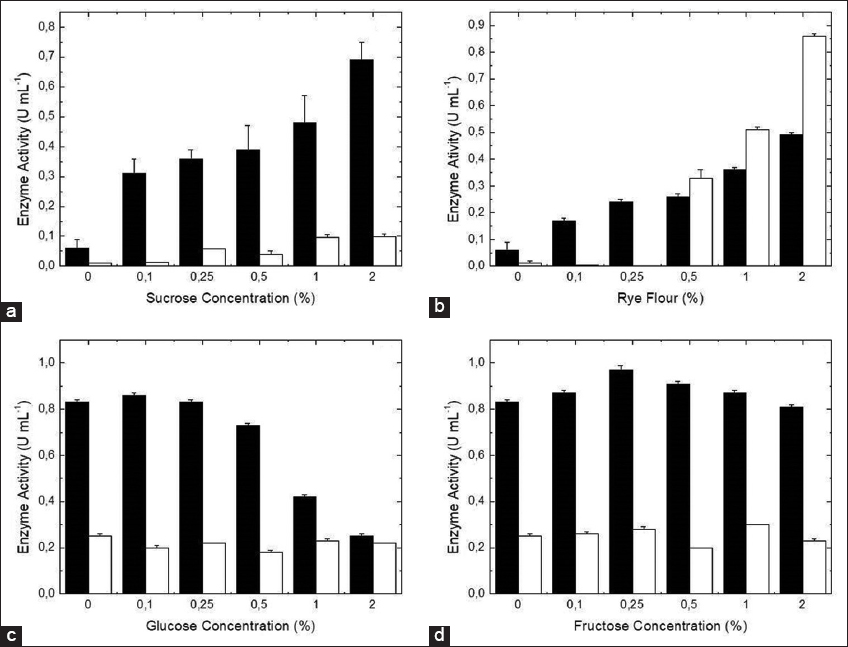 | Figure 1: Influence of different concentrations of sucrose (a) and rye flour (b) added to the culture medium as carbon sources, and influence of glucose (c) and fructose (d) added as secondary carbon sources in the culture medium, containing sucrose as the main carbon source in the production of β-fructofuranosidase by A. labruscus ITAL 28.255. Intracellular (white columns) and extracellular (black columns) enzymes. [Click here to view] |
With regards to the use of sucrose as a carbon source, the catabolic repression in the presence of their products as a result of the hydrolysis (glucose and fructose) was analyzed. According to Figure 1, the addition of glucose reduced the production of the extracellular enzyme, especially when 1% (m/v) of glucose was added. The same effect was not observed, however, for the addition of fructose. For the intracellular form, significant modifications were not observed (data not shown). Not only is glucose a nutrient, but it also presents regulatory effects on the gene expression involved in metabolic pathways for the alternative carbon sources and membrane transporters of sugars. The CreA regulator, which is responsive to glucose, is essential for the metabolism of carbon. At a high glucose concentration, CreA inhibits the gene expression of enzymes that are important for the metabolism of secondary carbon sources [32,33].
As mentioned above, sucrose and rye flour were the best carbon sources for the production of β-fructofuranosidase by A. labruscus. Hence, the question was now whether the consortium between these carbon sources could improve enzyme production. The response was positive. The best enzymatic level was obtained using a mixture of 1.5% rye flour and 0.5% sucrose, surpassing the levels obtained using sucrose and rye flour separately by 2.6 times and 3.5 times, respectively [Table 2]. An increase in the sucrose concentration and a reduction in the rye flour in the mixture reduced the enzyme production. The extracellular specific activity was higher than that observed for the intracellular form for all conditions analyzed, except when 2% rye flour (extra = 104 U mg prot-1 and intra = 138.3 U mg prot-1) was used. The best extracellular specific activity was obtained using the mixture of sucrose and rye flour (1.5:0.5) with 226.2 U mg prot-1. The intracellular-specific activity observed in the presence of sucrose was reduced (16.2 U mg prot-1), indicating that the majority of the enzyme is secreted to the extracellular medium. At a high concentration of sucrose, more glucose can be released, what can inhibit the production of the extracellular enzyme as demonstrated above. The equilibrium between sucrose and rye flour provides the best conditions for fungal growth and enzymatic production, considering the nutritional factors, and minimized catabolic repression by the glucose.
Table 2: Influence of sucrose, rye flour, and the mixture of these carbon sources on the production of β-fructofuranosidase by A. labruscus ITAL 28.255.
| Carbon source | Proportion (%; m/v) | Enzyme Activity (U mL-1) | Protein (μg μL-1) | ||
|---|---|---|---|---|---|
| Extra | Intra | Extra | Intra | ||
| Sucrose | 2 | 0.71±0.01 | 0.26±0.01 | 5±0.1 | 16±0.2 |
| Rye flour | 2 | 0.52±0.01 | 0.83±0.01 | 5±0.2 | 6±0.1 |
| Sucrose + Rye flour | 1.5:0.5 | 1.81±0.01 | 1.76±0.01 | 8±0.2 | 13±0.2 |
| 1:1 | 1.13±0.1 | 1.24±0.01 | 9±0.1 | 11±0.2 | |
| 0.5:1.5 | 0.78±0.1 | 0.42±0.01 | 7±0.1 | 5±0.1 | |
The fungus was cultured in M5 medium, with an initial pH of 6.0, for 120 h, at 30°C and 100 rpm.
Table 3: Effect of the salts, EDTA, and β-mercaptoethanol on the enzymatic activity of the extracellular β-fructofuranosidase produced by A. labruscus ITAL 28.255.
| Compound (1 mmol L-1) | Relative activity (%) | Compound (1 mmol L-1) | Relative activity (%) |
|---|---|---|---|
| None added | 100 | MgCl2 | 106 |
| AgNO3 | 122 | MnCl2 | 149.2 |
| BaCl2 | 112 | MnSO4 | 134.1 |
| CaCl2 | 109.8 | NaCl | 106.8 |
| CoCl2 | 107.6 | NH4Cl | 110.6 |
| CuCl2 | 106.8 | EDTA | 107.6 |
| KCl | 109 | β-mercaptoethanol | 125 |
The values correspond to the means of three replicates. The 100% activity corresponds to 1.32 U mL-1.
3.2. Purification and Determination of Molecular Mass
The extracellular fructofuranosidase was purified 16-fold, with 9% recovery, through two sequential chromatographic steps: DEAE-cellulose, which was eluted with 0.4 mol L-1 NaCl, and Sephacryl S-200, as a single peak for both procedures [Table S2]. The Fusarium graminearum fructofuranosidase was also purified in two steps, with an 8-fold purification factor and 14% recovery [34]. A single protein band of 67 kDa was obtained in the SDS-PAGE electrophoresis, indicating homogeneity [
The secondary structure invertase, purified from A. lambruscus, was analyzed using circular dichroism [
3.3. Influence of the Temperature and pH on Enzyme Activity
The best extracellular fructofuranosidase activity was achieved at 55°C [Fig
In terms of the influence of pH, the best enzyme activity was observed at pH 5.5 [
3.4. Influence of Different Compounds on the Enzyme Activity
According to Table
Since Mn2+ was the best for the increase in enzyme activity, the influence of different concentrations of MnCl2 on the enzyme activity from A. labruscus was evaluated [
3.5. Hydrolysis of Different Substrates and Kinetic Parameters
The extracellular β-fructofuranosidase from A. labruscus ITAL 28.255 hydrolyzed both sucrose and inulin as substrates [Figure 3], while the hydrolysis of raffinose was not significant. In addition, the hydrolysis of the mixture between sucrose and insulin presented intermediary values when compared to the values obtained for the substrates separately, indicating that the same catalytic site is used for the hydrolysis of both substrates. In the case of two different active sites, hydrolysis values similar to the sum of values obtained for each single substrate are expected.
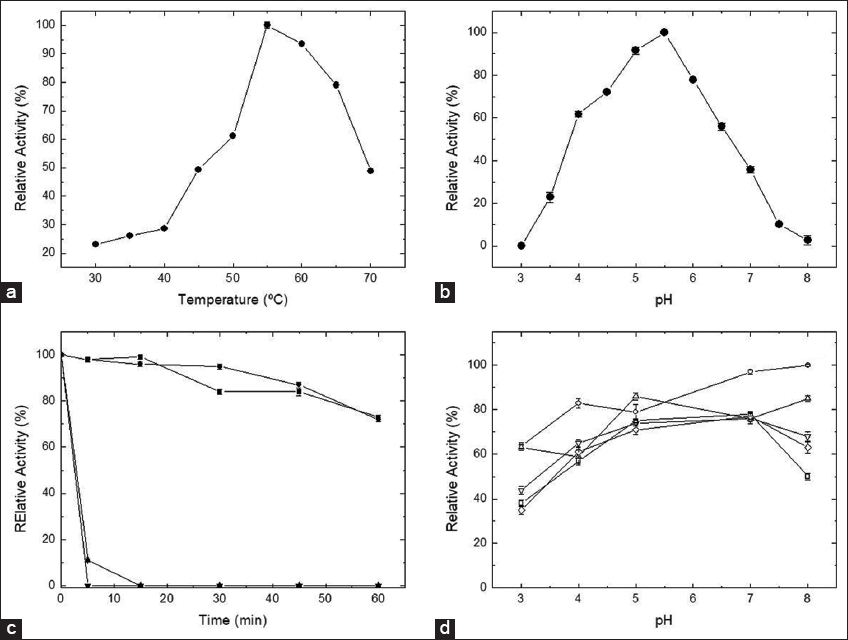 | Figure 2: Influence of the temperature (a) and pH (b) on the extracellular β-fructofuranosidase activity, and thermal stability (c) at 40°C (?), 50°C (•), 60°C (Δ), and 70°C (?), and pH stability (d) at 5 (O), 15 (Δ), 30 (v), 45 (◊), and 60 (?) min. 100% relative activity was reaction using the enzymatic sample without previous incubation in the buffer solutions. [Click here to view] |
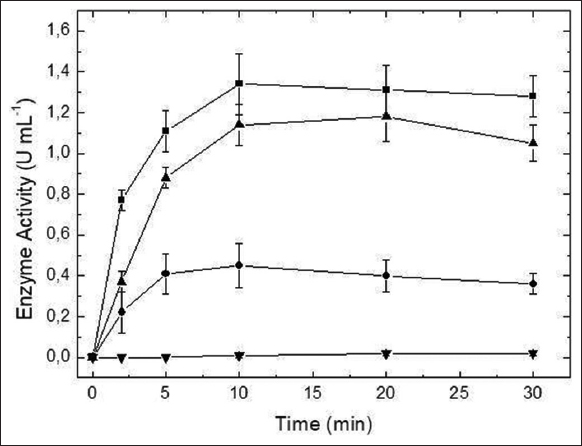 | Figure 3: Hydrolysis of the sucrose (?), inulin (•), raffinose (?), and sucrose + inulin (?) by the extracellular β-fructofuranosidase from A. labruscus ITAL 28.255. [Click here to view] |
Considering the preference for sucrose as the substrate, the kinetic parameters KM, Vmax, and KM/Vmax were evaluated in the presence and absence of Mn2+, since this ion increased the enzyme activity. According to Table S3, the KM, and the Vmax, in the absence of Mn2+ were 4.74 mM and 140.3 U/mg, respectively; while, in the presence of Mn2+, the KM was 2.17 mM and the Vmax was 292.9 U/mg. Both values of KM that were obtained were lower than the value obtained for the A. tamarii URM4634 enzyme immobilized using chitosan (78.81 mM) [9], and for the enzymes produced by Penicillium aurantiogriseum (65.28 mM), Rhizopus stolonifer (119.3 mM) [42] and A. versicolor (25 mM) [11]. The Vmax for the latter was 55.7 U/mg, which is lower than that found in the present work. In the presence of Mn2+, the Vmax/KM relation was 4.5-fold higher than that observed in the absence of Mn2+, indicating that the presence of this ion improved the efficiency of the enzyme to hydrolyze sucrose as a substrate. A similar result was observed by Fernandes et al. [8]; the Vmax/KM for the A. niveus fructofuranosidase was 10-fold higher in the presence of Mn2+ than what was obtained in the absence of this ion.
3.6. Production of FOSs
Figure 4 shows the production of FOSs using the β-fructofuranosidase produced by A. labruscus. As can be observed, the increase in the concentration of sucrose as a substrate allowed the production of 15.33 mg/mL FOS using 30% (m/v) sucrose, in which 14.8 mg/mL corresponds to the 1-kestose and 0.53 mg/mL to the nystose [Figure 4a]. Two possibilities can explain the low level of nystose: (i) First, 1-kestose is produced by the addition of one fructose unit to the sucrose molecule by the enzyme and, after that, the 1-kestose is used for the production of nystose, adding another fructose unit. Because of this, the reaction time was not sufficient for the pronounced production of nystose; (ii) the main reaction catalyzed by the enzyme is for the production of 1-kestose and not for nystose, which can be explained by the reduced affinity of 1-kestose as an acceptor of the fructosyl group.
 | Figure 4: Production of FOS according to the sucrose concentration as the substrate (a) and as a function of the reaction time (b). Symbols: (?) 1-kestose, (?) nystose, (Δ) total FOSs, and (•) sucrose. [Click here to view] |
With the increase in the reaction time [Figure 4b], the sucrose concentration was reduced, indicating both hydrolytic and transfructosylating activities of the A. labruscus β-fructofuranosidase, while the concentration of FOS increased, reaching 150 mg/mL with 1 h of reaction. It can be noted at this time that the sucrose concentration was reduced by 65% and that the maximal level of FOS can be obtained with more than 1 h of reaction. Similar results were reported by Xie et al. [43] for the enzyme produced by Aspergillus tubingensis. The concentration of FOSs was increased as a function of the increase in both the sucrose concentration and the period of reaction. The β-fructofuranosidase from F. graminearum also presented transfructosylation activity in the presence of 20% (m/v) sucrose, obtaining 1-kestose, and nystose [44]. Linde et al. [45] observed a gradual increase in the FOS concentration as a function of reaction time using an extracellular fructofuranosidase from X. dendrorhous, with a maximal level between 2–3 h (127 g/L of FOS). The same was reported when using the enzyme produced by P. oxalicum [2].