
1. INTRODUCTION
Orthosiphon stamineus (OS) or cat’s whiskers (Lamiaceae) is broadly used in traditional medicine by people in Southeast Asia, including Indonesia, Thailand, Vietnam, Malaysia, and Myanmar. Various Indonesian tribes have empirically demonstrated its use in treating rheumatism, diabetes, hypertension, tonsillitis, epilepsy, menstrual disorders, gonorrhea, syphilis, kidney stones, nephritis, and gout [1]. Furthermore, different pharmacological tests have confirmed its antioxidant, antidiabetic, antihypertensive, anti-inflammatory, antimicrobial, anti-obesity, diuretic, nephroprotective, hepatoprotective, cytotoxic actions, and activities in the cardiovascular system [2,3]. OS exhibits diverse biological activities due to its various chemical contents, ranging from essential oil, terpenoids, sterols, saponins, and flavonoids to organic acids [2-5].
OS can grow abundantly across phytogeographical regions [6-8]. This ensures a continuous supply of raw ingredients for traditional remedies, both for industrial purposes and self-medication. However, this can be perceived as possible variations in quality, which may create challenges in utilization with standardized requirements. Furthermore, plant quality, which is regulated by chemical compounds, varies according to the geographical conditions of the plant growth site (soil characteristics, climate) and adopted harvesting and post-production systems [9,10]. For these reasons, a straightforward and precise analytical method is required to identify the phytogeographical zone from which an OS sample is collected and assess if its quality is similar or different from other OS samples.
Herbal quality can be evaluated using two analytical approaches: chemical marker identification and compound fingerprinting. A group of markers, i.e., rosmarinic acid, 3′-hydroxy-5,6,7,4′-tetramethoxyflavone, sinensetin, and eupatorin, have been identified using high-performance liquid chromatography [5,11], thin layer chromatography (TLC) [7], and high-performance thin layer chromatography [12-14]. These markers can be used to evaluate OS crude drugs from different locations and OS extracts derived from using varying extraction methods and solvents. Compared to these markers, compound fingerprinting offers more advantages. A sample’s fingerprint shows a distinctive molecular profile or pattern that reflects and thus provides information on its chemical composition [15,16]. Therefore, in fingerprint analysis, nearly all compounds in a plant sample are considered, allowing a more objective evaluation of its chemical quality than only relying on single or multiple predefined compounds. Several fingerprint-based approaches have been used to detect variations in OS samples collected from different regions, including TLC fingerprinting combined with chemometrics [6], fast gas chromatography-based virtual chemical sensor [8], and FTIR spectroscopy combined with canonical variate analysis [17]. Fourier-transform infrared (FTIR) is a spectroscopic method that efficiently screens medicinal herbs for different chemical compounds. It produces an FTIR spectrum to express the typical chemical bonds of a plant sample. When the peaks in the spectrum change in position and intensity, these shifts correspond to changes in the sample’s chemical composition. Therefore, although the chemical makeup of plant samples from the same or closely related species is unknown, FTIR spectra can be used to determine their phytogeographical origins [18,19]. However, visually discriminating chemical compounds from an FTIR spectrum is challenging because the only differentiating factor is the signal intensity. Therefore, it is necessary to combine the fingerprinting process with chemometrics [15].
This research was intended to classify OS leaves harvested from 14 different phytogeographical zones in Indonesia with FTIR fingerprinting followed by two chemometrics, principal component analysis (PCA) and cluster analysis (CA). The observed analytical method is expected to complement previously developed discriminant techniques for more straightforward and flexible quality control of OS leaves as raw materials and in herbal products. Ultimately, a more secure and effective use of OS can be achieved.
2. MATERIALS AND METHODS
2.1. Plant Materials
OS leaves were collected from 14 Indonesian regions in July-October 2020. Details on their phytogeographical origins are shown in Table 1. Samples were the first eight leaves from the top of the shoot picked manually and were verified by the Center for Information and Development of Traditional Medicines, University of Surabaya. On harvesting, the leaves were washed with running water, drained, air-dried, and examined for moisture content using a moisture content balance (Moisture Analyzer HB43, Mettler-Toledo GmbH, Laboratory and Weighing Technologies, Switzerland). Dried leaves were later reduced to powder in a blender (Philips HR 2222, Amsterdam, the Netherlands) and passed through a 45-mesh sieve.
Table 1: Moisture contents of crude drugs from Orthosiphon stamineus leaves of different phytogeographical origins.
| S. No. | Phytogeographical origins | Latitude, longitude | Elevation (masl) | Moisture content (%)* |
|---|---|---|---|---|
| 1. | Tawangmangu | 7°39’50”S and 111°08’04”E | 1200 | 5.66±2.60 |
| 2. | South Jakarta | 6°15’25”S and 106°46’45”E | 7 | 4.34±1.61 |
| 3. | Surabaya | 7°16’11”S and 112°44’48”E | 7 | 6.33±1.27 |
| 4. | Lamongan | 7°06’25”S and 112°20’08”E | 7.7 | 4.86±1.14 |
| 5. | Gresik | 7°09’58’’S and 113°18’07”E | <200 | 4.76±1.62 |
| 6. | Batu | 7°51’52”S and 112°31’12”E | 897 | 3.88±0.31 |
| 7. | Ngawi | 7°33’27”S and 111°17’38”E | 331 | 4.76±1.62 |
| 8. | Jombang | 7°36’52”S and 112°22’10”E | 62 | 3.44±0.69 |
| 9. | Sampang | 7°03’54”S and 113°15’04”E | 63 | 6.46±1.28 |
| 10. | Mojokerto | 7°38’37”S and 112°36’10”E | 650 | 5.86±2.26 |
| 11. | Madiun | 7°39’44”S and 111°36’17”E | 62 | 7.67±0.83 |
| 12. | Kediri | 7°46’07”S and 111°54’36”E | 78 | 3.44±0.40 |
| 13. | Badung | 8°35’53”S and 115°11’52”E | 350 | 5.16±2.29 |
| 14. | Kotabaru | 3°17’32”S and 116°13’05’’E | 212 | 4.74±0.55 |
* mean±SD (n=3)
Moisture contents of crude drugs from Orthosiphon stamineus leaves of different phytogeographical origins.
2.2. FTIR Spectroscopy
OS fingerprint profiles were analyzed using an Agilent Cary 630 FTIR Spectrometer equipped with a diamond Attenuated Total Reflectance (ATR) sampling accessory (Agilent Technologies, Inc., CA, USA) and MicroLab software. For each OS sample, the FTIR was read in the wavenumber range of 4000–650 cm-1. Then, the percent transmittance (%T) of each spectral peak at each wavenumber was tabulated, selected, and analyzed using chemometrics.
2.3. Chemometrics Analysis
FTIR fingerprint profiles of 14 OS samples from different phytogeographical regions were analyzed using chemometrics, i.e., PCA and CA, in the Minitab v.16 program (Minitab Inc., USA). In this case, PCA was used to group chemically similar samples by reducing the original variables and replacing them with a number of n new variables. PCA was also used to reduce the amount of the inputted data (i.e., FTIR spectra), provided a correlation existed between them. The number of new variables, termed principal components (PC), was determined depending on whether or not the resulting correlation coefficient was significant. Principal component one (PC1) represents the variable with the greatest variation and describes the original variable, while principal component two (PC2) accounts for the next largest variation. If there is a significant correlation between the data, then the number of PCs used will be smaller than the original variables [20].
CA helped group samples according to their similarities into the same group (cluster), starting with considering original variables as the foundation for constructing same-size clusters and then followed by inter-cluster comparisons. Sequential comparison between cluster distances was used to group nearby samples to each other into a new cluster because a shorter separation distance means more similar variables are shared. Then, variables were compared again, and if two other clusters were found to share similarities, they would be categorized into a cluster, and so on, until all clusters became a large one. The derived clusters manifest any similarities and differences between samples.
3. RESULTS AND DISCUSSION
3.1. Physical Characteristics of OS Leaf Crude Drugs
Physical characteristics of leaf crude drugs (i.e., color and moisture content) are commonly examined as initial parameters in quality evaluation. Figure 1 shows the visual appearances of crude drugs from 14 samples of OS leaves, with their respective moisture contents written in Table 1. All samples had a similar color, dark green. However, a much darker green shade was found in four samples: sample number 4 (from Lamongan), 5 (Gresik), 7 (Ngawi), and 9 (Sampang). Previous research found that methanol extract of OS leaves having a weak green color showed a TLC profile with small chlorophyll bands [6]. In addition, the moisture content of all samples was less than 10%. Moisture content is an important parameter because, in a crude drug, water is a good medium for the growth of microorganisms and insects that can damage the contained chemical compounds [21]. Moreover, the Indonesian Herbal Pharmacopoeia Edition II requires the loss on drying value of OS leaves to be no more than 10% [22].
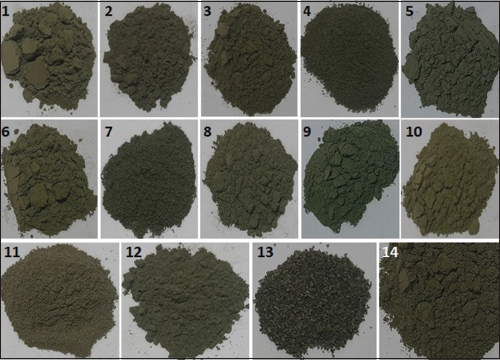 | Figure 1: Visual characteristics of Orthosiphon stamineus leaf powder. [Click here to view] |
All samples went through the same harvesting and post-harvesting procedures, so any differences in color and moisture content of the leaf powder can be attributed to their different origins. Samples were also divided into three groups based on elevation: samples from highlands (> 600 masl; consisting of Tawangmangu, Batu, and Mojokerto samples), from lowlands (<200 masl; South Jakarta, Surabaya, Lamongan, Gresik, Jombang, Sampang, Madiun, and Kediri), and medium land, with elevation range lower than highlands but higher than lowlands (200–600 masl; Kotabaru, Badung, and Ngawi). However, when linked to elevation, there seemed to be no direct correlation with the physical characteristics of the leaves; hence, it is predicted that other geographical factors are responsible for the variations.
3.2. FTIR Spectra of OS Leaves
FTIR spectra of the OS leaf powder were observed directly in the wavenumber range of 4000–650 cm-1. This range can be segmented into the functional group region from 4000 to 1500 cm-1 and the fingerprint region from 1500 to 650 cm-1. Observation of the FTIR spectra in the functional group region was intended to find differences of functional group vibrations of OS leaf samples. However, in that region, FTIR spectra did not show any significant differences in the location and shape of the peaks, indicating a qualitatively similar chemical composition shared by the 14 OS leaf samples. An example is provided in Figure 2. Here, the FTIR spectrum of the Tawangmangu sample shows a broad absorption band at 3278.2 cm-1 (the stretching frequency of an O-H bond), the C-H equivalent at 2919.4 and 2851.4 cm-1, and the C=C stretching vibration at 1617.7 cm-1; all are markers of flavonoids and phenylpropanoids [2,17]. The functional groups identified from the 14 OS leaf samples are presented in detail in Table 2.
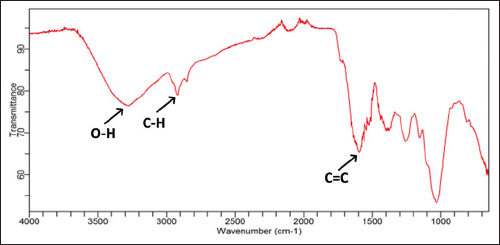 | Figure 2: Sample FTIR spectrum of the Orthosiphon stamineus leaf from Tawangmangu. [Click here to view] |
Table 2: Functional groups interpreted from FTIR spectra of Orthosiphon stamineus leaves harvested from 14 phytogeographical regions.
| S. No | Phytogeographical origins | Wavenumbers (cm-1) | ||
|---|---|---|---|---|
| O-H (Alcohol) | C-H (Alkane) | C=C (Alkene) | ||
| 1 | Tawangmangu | 3278.2 | 2919.4 and 2851.4 | 1617.7 |
| 2 | South Jakarta | 3284.7 | 2918.5 and 2851.4 | 1626.9 |
| 3 | Surabaya | 3277.3 | 2922.2 and 2849.5 | 1617.7 |
| 4 | Lamongan | 3273.5 | 2917.6 and 2850.5 | 1617.7 |
| 5 | Gresik | 3269.8 | 2918.5 and 2851.4 | 1601.8 |
| 6 | Batu | 3274.5 | 2920.4 and 2850.5 | 1595.3 |
| 7 | Ngawi | 3281.9 | 2920.4 and 2849.5 | 1610.2 |
| 8 | Jombang | 3278.2 | 2920.4 and 2851.4 | 1602.8 |
| 9 | Sampang | 3276.3 | 2918.5 and 2849.5 | 1617.7 |
| 10 | Mojokerto | 3274.5 | 2917.6 and 2851.4 | 1625.1 |
| 11 | Madiun | 3273.5 | 2918.5 and 2850.5 | 1617.7 |
| 12 | Kediri | 3277.3 | 2917.6 and 2849.5 | 1617.7 |
| 13 | Badung | 3270.7 | 2918.5 and 2850.5 | 1598.1 |
| 14 | Kotabaru | 3334.1 | 2916.6 and 2849.5 | 1608.3 |
Functional groups interpreted from FTIR spectra of Orthosiphon stamineus leaves harvested from 14 phytogeographical regions.
Afterward, FTIR profiles of 14 OS samples were analyzed using chemometrics. The first step was overlaying the 14 FTIR spectra (Figure 3). Results showed that all spectra had a similar pattern with only a slight difference in the transmittance value of each major or minor peak, indicating identical chemical compounds across the samples. The second step was tabulating wavenumbers against percent transmittances (%T). From these data, 13 peaks in the 4000–650 cm-1 wavenumber region were further analyzed using PCA and CA. The data matrix pairing the plant origin with %T at each selected wavenumber of each peak is presented in Table 3.
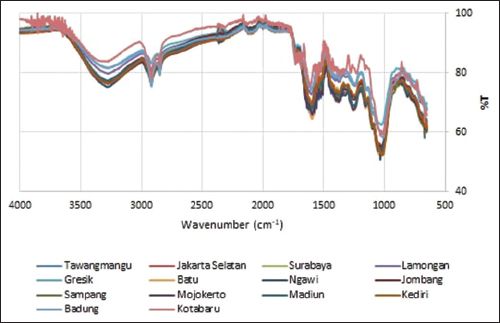 | Figure 3: FTIR spectra overlay of the 14 Orthosiphon stamineus leaf samples. [Click here to view] |
Table 3: Matrix of the samples’ phytogeographical origins versus %T at chosen wavenumber.
| Phytogeographical origin | %T value at the selected wavenumber (cm-1) | ||||||||||||
|---|---|---|---|---|---|---|---|---|---|---|---|---|---|
| 3278 | 2919 | 2851 | 2300 | 2100 | 1900 | 1701 | 1618 | 1401 | 1258 | 1154 | 1100 | 1034 | |
| Tawangmangu | 76.57 | 78.96 | 82.14 | 92.88 | 95.05 | 95.11 | 86.01 | 66.65 | 70.60 | 68.26 | 69.05 | 62.86 | 54.02 |
| South Jakarta | 77.03 | 79.15 | 82.28 | 92.93 | 94.50 | 94.78 | 87.94 | 68.50 | 72.73 | 72.31 | 70.85 | 61.94 | 55.72 |
| Surabaya | 76.39 | 78.33 | 82.12 | 92.83 | 94.85 | 95.15 | 87.53 | 69.92 | 74.16 | 72.36 | 71.56 | 62.96 | 53.01 |
| Lamongan | 79.87 | 80.78 | 83.46 | 93.10 | 94.34 | 94.62 | 88.86 | 73.39 | 77.37 | 75.99 | 74.84 | 66.99 | 60.09 |
| Gresik | 81.51 | 83.24 | 85.61 | 94.26 | 95.29 | 95.76 | 89.15 | 75.34 | 78.31 | 76.30 | 75.00 | 68.24 | 62.72 |
| Batu | 76.95 | 78.33 | 81.60 | 93.49 | 95.15 | 95.25 | 86.95 | 67.05 | 70.49 | 67.37 | 68.03 | 61.04 | 51.90 |
| Ngawi | 75.28 | 76.79 | 80.84 | 92.05 | 94.24 | 94.62 | 88.42 | 67.60 | 71.36 | 72.43 | 70.60 | 61.41 | 51.97 |
| Jombang | 77.16 | 78.91 | 82.86 | 93.42 | 94.91 | 95.32 | 86.56 | 68.45 | 72.84 | 71.12 | 70.73 | 62.55 | 54.67 |
| Sampang | 76.52 | 76.08 | 79.48 | 92.11 | 94.03 | 94.48 | 85.44 | 68.83 | 71.66 | 68.99 | 69.23 | 61.79 | 52.99 |
| Mojokerto | 76.46 | 78.05 | 80.99 | 92.01 | 93.88 | 94.35 | 85.57 | 68.38 | 70.84 | 67.62 | 68.70 | 62.66 | 53.88 |
| Madiun | 77.50 | 77.42 | 80.83 | 93.08 | 94.64 | 94.82 | 86.70 | 70.20 | 73.29 | 68.96 | 69.31 | 62.97 | 53.84 |
| Kediri | 76.35 | 78.34 | 81.18 | 91.60 | 93.62 | 93.85 | 87.04 | 70.38 | 73.63 | 72.69 | 70.79 | 62.92 | 53.43 |
| Badung | 81.71 | 75.48 | 79.37 | 92.53 | 94.02 | 94.35 | 86.39 | 75.66 | 78.95 | 76.98 | 74.39 | 66.31 | 60.16 |
| Kotabaru | 84.02 | 78.18 | 82.94 | 95.84 | 97.37 | 96.74 | 85.89 | 76.76 | 81.94 | 82.05 | 82.35 | 72.01 | 59.03 |
3.3. FTIR Fingerprinting with PCA
PCA is a multivariate analysis used to simplify analysis by reducing the number of intercorrelated variables [20]. In this study, two variables were used: the first principal component (PC1) and the second principal component (PC2). Using two PCs, about 91% variation are described. PC1 accounted for 83.3% of the variation, while PC2 described 7.7% of the variation. This percentage means only 9% of information is lost or, in other words, a significant correlation exists between variables. The proportion and cumulative value of each PC are shown in Table 4, and the scree plot for each PC is presented in Figure 4.
Table 4: Correlation matrix showing eigenvalues, proportions, and cumulative proportions derived from PCA.
| Eigenvalue | 79.705 | 7.328 | 4.099 | 2.830 | 0.728 | 0.569 | 0.198 | 0.077 | 0.051 | 0.037 | 0.013 | 0.005 | 0.000 |
| Proportion | 0.833 | 0.077 | 0.043 | 0.030 | 0.008 | 0.006 | 0.002 | 0.001 | 0.001 | 0.000 | 0.000 | 0.000 | 0.000 |
| Cumulative | 0.833 | 0.910 | 0.953 | 0.982 | 0.990 | 0.996 | 0.998 | 0.999 | 0.999 | 1.000 | 1.000 | 1.000 | 1.000 |
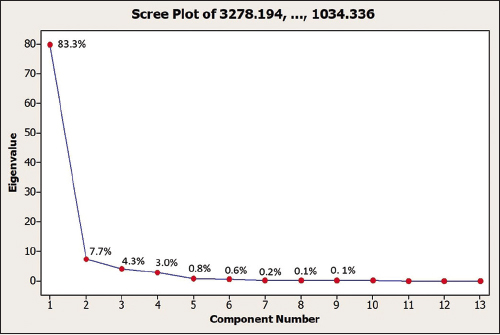 | Figure 4: Scree plot of the thirteen principal components obtained from PCA. [Click here to view] |
A scree plot displays the relationship between PCs and eigenvalues to demonstrate the amount of variation that each PC collects from the data. The y-axis is eigenvalues, which basically mean the amount of variation, the x-axis is the principal component (PC), and the dots are the proportions shown in Table 4. An ideal curve is steep and then bends at the “elbow” before flattening out. Therefore, two PCs (PC1 and PC2) are sufficient to describe the variance of data in this research.
A loading plot (Figure 5) shows the degree of correlation between each variable and how strongly each characteristic can affect PC. The narrower the angle formed between two vectors, the stronger the positive influence a variable has on a PC, whereas an angle closer to 180° indicates a stronger negative correlation. In contrast, an angle closer to 90° means it is more likely that the two are not related. For example, as seen in Figure 5, the peaks at the wavenumbers 2919.437 cm-1 and 1257.977 cm-1 show no correlation between the two, whereas those at 2919.437 cm-1 and 1700.598 cm-1 have a positive correlation.
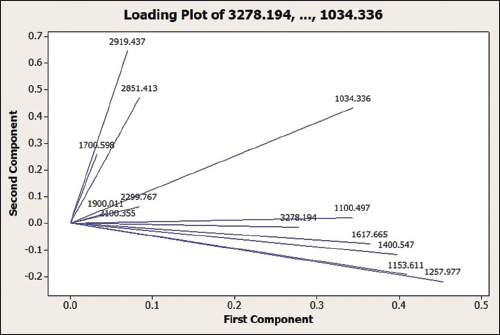 | Figure 5: Loading plot of PC1 dan PC2 for the 14 Orthosiphon stamineus leaf samples collected from different phytogeographical zones. [Click here to view] |
Table 5 shows the eigenvectors used to calculate the first component (PC1) and second component (PC2) values. These values were then inputted into a score plot (Figure 6). The plot’s Euclidean distance was calculated to describe the closeness between samples. Figure 6 shows that OS samples number 13 and 14 have a far Euclidean distance from other samples, while OS samples number 4 and 5 are close together, and other samples (in blue circles) are also close to each other. Therefore, OS samples from 14 locations were grouped into four groups: group 1 containing samples from Tawangmangu, Mojokerto, Batu, Sampang, Madiun, South Jakarta, Jombang, Surabaya, Kediri, and Ngawi; group 2 from Lamongan and Gresik; group 3 from Badung; and group 4 from Kotabaru. This grouping does not appear to be directly related to the elevation of the plant’s growing sites. Other factors such as soil type and cultivation process also play a vital role in shaping the quality of medicinal herbs. The results of the current study are consistent with Royani et al. (2014), stating that the andrographolide content of Andrographis paniculata varies according to its origin and is not related to elevation [23]. Similarly, variations in sinensetin levels of cat’s whisker leaves are unrelated to their elevation [7].
Table 5: Eigenvectors derived from PCA of 14 Orthosiphon stamineus leaf samples with different origins.
| Variable | PC1 | PC2 | PC3 | PC4 | PC5 | PC6 | PC7 | PC 8 | PC9 | PC10 | PC11 | PC12 | PC13 |
|---|---|---|---|---|---|---|---|---|---|---|---|---|---|
| 3278.194 | 0.278 | −0.015 | 0.136 | −0.383 | 0.192 | 0.334 | −0.136 | 0.623 | 0.208 | −0.073 | −0.265 | −0.289 | 0.011 |
| 2919.437 | 0.070 | 0.645 | −0.193 | 0.042 | −0.248 | −0.193 | 0.149 | 0.388 | 0.145 | 0.117 | 0.435 | −0.066 | −0.199 |
| 2851.413 | 0.084 | 0.470 | −0.322 | 0.000 | −0.102 | 0.013 | 0.272 | −0.138 | −0.145 | −0.134 | −0.656 | −0.030 | 0.306 |
| 2299.767 | 0.083 | 0.062 | −0.239 | −0.285 | 0.065 | 0.421 | 0.037 | −0.047 | 0.060 | 0.221 | −0.013 | 0.742 | −0.250 |
| 2100.355 | 0.058 | 0.001 | −0.285 | −0.260 | 0.060 | 0.272 | −0.030 | −0.089 | −0.140 | −0.270 | 0.529 | −0.052 | 0.622 |
| 1900.011 | 0.043 | 0.037 | −0.209 | −0.193 | 0.061 | 0.262 | 0.036 | −0.253 | −0.496 | −0.027 | 0.073 | −0.460 | −0.560 |
| 1700.598 | 0.032 | 0.258 | −0.052 | 0.476 | −0.121 | 0.416 | −0.691 | −0.128 | 0.121 | 0.021 | −0.040 | −0.070 | 0.014 |
| 1617.665 | 0.364 | −0.077 | 0.368 | −0.010 | −0.581 | 0.092 | −0.002 | 0.128 | −0.510 | 0.255 | 0.008 | 0.107 | 0.164 |
| 1400.547 | 0.397 | −0.116 | 0.111 | 0.030 | −0.339 | 0.232 | 0.356 | −0.374 | 0.552 | −0.189 | 0.070 | −0.155 | −0.109 |
| 1257.977 | 0.453 | −0.219 | −0.243 | 0.563 | 0.253 | −0.000 | 0.178 | 0.288 | −0.208 | −0.324 | 0.050 | 0.171 | −0.108 |
| 1153.611 | 0.409 | −0.192 | −0.407 | −0.020 | 0.144 | −0.238 | −0.114 | −0.124 | 0.128 | 0.666 | −0.019 | −0.206 | 0.150 |
| 1100.497 | 0.343 | 0.022 | −0.093 | −0.347 | −0.152 | −0.487 | −0.480 | −0.131 | 0.003 | −0.431 | −0.049 | 0.173 | −0.164 |
| 1034.336 | 0.344 | 0.432 | 0.524 | −0.002 | 0.552 | −0.050 | 0.040 | −0.283 | −0.080 | 0.074 | 0.113 | 0.060 | 0.060 |
Eigenvectors derived from PCA of 14 Orthosiphon stamineus leaf samples with different origins.
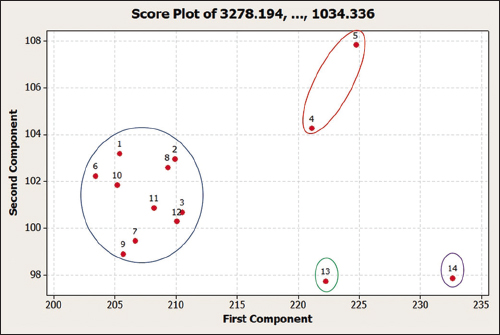 | Figure 6: Score plot of PC1 and PC2 from 14 samples of Orthosiphon stamineus leaves harvested from different locations. Number 1-14 denotes the sample origin: Tawangmangu, South Jakarta, Surabaya, Lamongan, Gresik, Batu, Ngawi, Jombang, Sampang, Mojokerto, Madiun, Kediri, Badung, and Kotabaru. [Click here to view] |
3.4. FTIR Fingerprinting with CA
CA was conducted after PCA to divide objects into clusters, such that objects with similarities are assigned to the same cluster [24]. It was also to anticipate any failure in PCA’s sample grouping. Moreover, CA can provide numerical values of similarity among the objects evaluated. The principle of CA is to combine two closest data points to form a new cluster [20]. The results of the amalgamation step in CA are shown in Table 6.
Table 6: Results of the amalgamation steps in the cluster analysis of 14 Orthosiphon stamineus leaf samples with different origins.
| Step | Number of clusters | Similarity level | Distance level | Clusters joined | New cluster | Number of obs. in new cluster | |
|---|---|---|---|---|---|---|---|
| 1 | 13 | 91.7907 | 2.4387 | 2 | 8 | 2 | 2 |
| 2 | 12 | 90.9583 | 2.6860 | 3 | 12 | 3 | 2 |
| 3 | 11 | 90.0501 | 2.9558 | 1 | 10 | 1 | 2 |
| 4 | 10 | 87.2971 | 3.7736 | 9 | 11 | 9 | 2 |
| 5 | 9 | 86.4609 | 4.0220 | 1 | 6 | 1 | 3 |
| 6 | 8 | 85.0851 | 4.4307 | 2 | 3 | 2 | 4 |
| 7 | 7 | 81.4683 | 5.5051 | 4 | 5 | 4 | 2 |
| 8 | 6 | 81.0799 | 5.6205 | 2 | 7 | 2 | 5 |
| 9 | 5 | 80.9868 | 5.648 | 1 | 9 | 1 | 5 |
| 10 | 4 | 71.6058 | 8.4349 | 1 | 2 | 1 | 10 |
| 11 | 3 | 62.3782 | 11.1761 | 4 | 13 | 4 | 3 |
| 12 | 2 | 51.6905 | 14.3511 | 4 | 14 | 4 | 4 |
| 13 | 1 | 0.0000 | 29.7066 | 1 | 4 | 1 | 14 |
Results of the amalgamation steps in the cluster analysis of 14 Orthosiphon stamineus leaf samples with different origins.
CA is a method used to group objects based on similarities between variables. It considers original variables as the foundation for constructing a same-size “cluster” and then compares distances between clusters. In the analysis, samples with the same variables are brought together to form a new cluster; then, if further comparison finds two clusters with similarities, they will be merged into one cluster, and so on. As shown in Table 6, the first step was to merge samples from South Jakarta (2) and Jombang (8) with a separation distance of 2.4387 to form one cluster that shared 91.79% similarity. In the second step, samples from Surabaya (3) and Kediri (12) were grouped to form a cluster with a separation distance of 2.6860 and 90.96% similarity. This process continued until the thirteenth step, which combined samples from Tawangmangu (1) and Lamongan (4) into a cluster with a separation distance of 29.7066 and 0.00% similarity. The final results divided samples into four major clusters according to their similarities and differences.
As shown in Figure 7, the dendrogram grouped the 14 OS samples (x-axis) into four clusters by considering the separation distance (y-axis). The first cluster comprised OS samples from Tawangmangu, Mojokerto, Batu, Sampang, Madiun, South Jakarta, Jombang, Surabaya, Kediri, and Ngawi. The second cluster included samples from Lamongan and Gresik, while the third and fourth contained samples from Badung and Kotabaru, respectively. Sample grouping with CA corresponds to the one generated with PCA. The cluster division is related to similarity in the contained chemical compounds, as observed from the peaks in the FTIR spectra. When associated with elevation, both PCA and CA resulted in random clustering. This can be attributed to many variables related to the conditions of the growing site that cannot be controlled, such as soil type, environmental humidity, rainfall, sunlight intensity, plant habitat, and plant age.
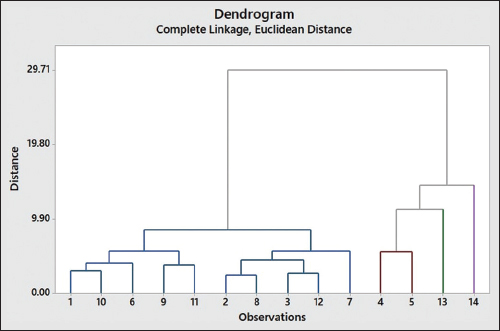 | Figure 7: Dendrogram obtained from cluster analysis with complete linkage. Number 1–14 denotes the sample origin: Tawangmangu, South Jakarta, Surabaya, Lamongan, Gresik, Batu, Ngawi, Jombang, Sampang, Mojokerto, Madiun, Kediri, Badung, and Kotabaru. [Click here to view] |
From the study results, it can be concluded that fingerprint profiles obtained using FTIR with the help of PCA and CA (chemometrics) can identify OS samples from different locations and group them into one cluster based on similarities in their chemical compositions. Therefore, fingerprints provide crucial information for when there is a shortage of OS supplies in an area at a particular time or condition. In this situation, OS with the same fingerprint profile grown in other phytogeographical zones can be used. Therefore, based on the PCA and CA results, OS samples of different origins that are assigned to the same cluster can be used as an alternative. This study, however, has some limitations in that the number of samples used was only 14. This widely opens the opportunity for further research to increase the sample size. In addition, it is imperative that other geographical attributes be entirely identified to help determine variables responsible for sample grouping.
The results of this research will also further strengthen previous researches involving FTIR fingerprinting for OS quality evaluation. For example, Heryanto et al. evaluated OS collected from 5 locations on Java Island (Indonesia) using transmission spectroscopy techniques, and then the FTIR spectra of the samples were analyzed using PCA and PLSDA [25]. Meanwhile, Yuliantini et al. used transmission spectroscopy to make FTIR-fingerprinting of OS and its adulterant namely Eupatorium riparium, then used PCA to differentiate between the two [26]. Furthermore, Ahda et al. used FTIR with reflectance spectroscopy technique (ATR FTIR) to differentiate OS extracted with ethanol at various concentrations (20,40, 60, 80, and 80%) [27].
4. CONCLUSIONS
The FTIR spectra of 14 OS leaves samples show the stretching frequencies of O-H, C-H, and C=C bonds, all are markers of flavonoids and phenylpropanoids. FTIR-fingerprinting combined with chemometrics (PCA and CA) proves to be effective in discriminating between crude drugs of OS leaves harvested from different phytogeographical regions. The first two PCs were used to show the grouping of 14 samples with cumulative variance at 91%. Using this method, OS samples from 14 locations in Indonesia were classified into four groups: group 1 containing samples from Tawangmangu, Mojokerto, Batu, Sampang, Madiun, South Jakarta, Jombang, Surabaya, Kediri, and Ngawi; group 2 from Lamongan and Gresik; group 3 from Badung; and group 4 from Kotabaru. Introducing diverse analytical methods to analyze OS is expected to promote the flexibility and ease of quality control of this herbal ingredient, which, in the long run, will ensure the safety and efficacy of herbal medicinal products.
5. ACKNOWLEDGMENTS
The authors extend their appreciation to the Indonesian Ministry of Education, Culture, Research, and Technology for funding this work through the fundamental research scheme, grant number 011/SP-Lit/LPPM-01/KemendikbudRistek/FF/V/2023.
6. AUTHORS’ CONTRIBUTIONS
Kartini Kartini conducted the research design, data and statistical analysis, drafting manuscript, critical revision of manuscript, funding the research, supervision, as well as final approval. Khusnul Khotimah conducted the data acquisition, data analysis, and technical support. Nikmatul Ikhrom Eka Jayani and Finna Setiawan conducted the data acquisition, data analysis, critical revision of manuscript, as well as final approval. Nina Dewi Oktaviyanti and Mochammad Arbi Hadiyat conducted data analysis, critical revision of manuscript, as well as final approval.
7. CONFLICT OF INTEREST
The authors report no financial or any other conflicts of interest in this work.
8. ETHICAL APPROVALS
This study does not involve experiments on animals or human subjects.
9. DATA AVAILABILITY
All data generated and analyzed are included within this research article.
10. PUBLISHER’S NOTE
This journal remains neutral with regard to jurisdictional claims in published institutional affiliation.
REFERENCES
1. Adnyana IK, Setiawan F, Insanu M. From ethnopharmacology to clinical study of Orthosiphon stamineus Benth. Int J Pharm Pharm Sci 2013;5:66-73.
2. Ameer OZ, Salman IM, Asmawi MZ, Ibraheem ZO, Yam MF. Orthosiphon stamineus:Traditional uses, phytochemistry, pharmacology, and toxicology. J Med Food 2012;15:678-90. [CrossRef]
3. Ashraf K, Sultan S, Adam A. Orthosiphon stamineus Benth. is an outstanding food medicine:Review of phytochemical and pharmacological activities. J Pharm Bioallied Sci 2018;10:109-18. [CrossRef]
4. Guo Z, Liang X, Xie Y. Qualitative and quantitative analysis on the chemical constituents in Orthosiphon stamineus Benth. using ultra high-performance liquid chromatography coupled with electrospray ionization tandem mass spectrometry. J Pharm Biomed Anal 2019;164:135-47. [CrossRef]
5. Akowuah GA, Zhari I, Norhayati I, Sadikun A, Khamsah SM. Sinensetin, eupatorin, 3'-hydroxy-5, 6, 7, 4'-tetramethoxyflavone and rosmarinic acid contents and antioxidative effect of Orthosiphon stamineus from Malaysia. Food Chem 2004;87:559-66. [CrossRef]
6. Kartini K, Dewi ER, Achmad F, Jayani NI, Hadiyat MA, Avanti C. Thin layer chromatography fingerprinting and clustering of Orthosiphon stamineus Benth. from different origins. Pharmacogn J 2020;12:1683-91. [CrossRef]
7. Kartini K, Putri RE, Budiono R. Quantification of sinensetin in Orthosiphon stamineus from various phytogeographical zones in Indonesia. J Appl Pharm Sci 2023;13:183-91. [CrossRef]
8. Sim CO, Ahmad MN, Ismail Z, Othman AR, Noor NA, Zaihidee EM. Chemometric classification of herb-Orthosiphon stamineus according to its geographical origin using virtual chemical sensor based upon fast GC. Sensors 2003;3:458-71. [CrossRef]
9. Srivastava S, Tiwari S, Srivastava N, Verma S, Rawat AK. Chemotaxonomic studies on Centella asiatica (L.) urb. from varied phytogeographical conditions of India for its industrial prospection. Proc Natl Acad Sci India Sect B Biol Sci 2019;89:1057-66. [CrossRef]
10. Bensoussan A, Lee S, Murray C, Bourchier S, Van Der Kooy F, Pearson JL, et al. Choosing chemical markers for quality assurance of complex herbal medicines:Development and application of the herb MaRS criteria. Clin Pharmacol Ther 2015;97:628-40. [CrossRef]
11. Akowuah GA, Ismail Z, Norhayati I, Sadikun A. The effects of different extraction solvents of varying polarities on polyphenols of Orthosiphon stamineus and evaluation of the free radical-scavenging activity. Food Chem 2005;93:311-7. [CrossRef]
12. Akowuah G, Zhari I, Sadikun A, Norhayati I. HPTLC densitometric analysis of Orthosiphon stamineus. leaf extracts and inhibitory effect on xanthine oxidase activity. Pharm Biol 2006;44:65-70. [CrossRef]
13. Hossain MA, Ismail Z. Quantification and enrichment of sinensetin in the leaves of Orthosiphon stamineus. Arab J Chem 2016;9:S1338-41. [CrossRef]
14. Shehzadi N, Zahid F, Naheed S, Javed R, Qamar S, Sher R, et al. Quantification of sinensetin in extracts of Orthosiphon stamineus using high performance thin-layer chromatography. Pak J Pharm 2018;29:12-9.
15. Gad HA, El-Ahmady SH, Abou-Shoer MI, Al-Azizi MM. Application of chemometrics in authentication of herbal medicines:A review. Phytochem Anal 2013;24:1-24. [CrossRef]
16. Tistaert C, Dejaegher B, Heyden YV. Chromatographic separation techniques and data handling methods for herbal fingerprints:A review. Anal Chim Acta 2011;690:148-61. [CrossRef]
17. Rafi M, Purwakusumah ED, Ridwan T, Barus B, Sutandi A, Darusman LK. Geographical classification of java tea (Orthosiphon stamineus) from Java island by FTIR spectroscopy combined with canonical variate analysis. J Sains Mat 2015;23:25-31.
18. Sun S, Chen J, Zhou Q, Lu G, Chan K. Application of mid-infrared spectroscopy in the quality control of traditional Chinese medicines. Planta Med 2010;76:1987-96. [CrossRef]
19. Angeline E, Susidarti RA, Rohman A. Rapid authentication of turmeric powder adulterated with Curcuma zedoaria and Curcuma xanthorrhiza using FTIR-ATR spectroscopy and chemometrics. Int J Appl Pharm 2019;11:216-21. [CrossRef]
20. Rohman A, Putri AR. The chemometrics techniques in combination with instrumental analytical methods applied in halal authentication analysis. Indones J Chem 2019;19:262-72. [CrossRef]
21. World Health Organization. Quality Control Methods for Medicinal Plant Materials. Geneva:World Health Organization;1998.
22. IMO Health. Indonesian Herbal Pharmacopoeia Edition II (in Bahasa). Jakarta:Departemen Kesehatan Republik Indonesia;2017.
23. Royani JI, Hardianto D, Wahyuni S. Analysis of andrographolide contents on sambiloto plants (Andrographis paniculata) derived from 12 locations in Java island (in Bahasa). J Biotecknol Biosains Indones 2014;1:15-20. [CrossRef]
24. Che Man YB, Rohman A, Mansor TS. Differentiation of lard from other edible fats and oils by means of Fourier transform infrared spectroscopy and chemometrics. J Am Oil Chem Soc 2011;88:187-92. [CrossRef]
25. Heryanto R, Pradono DI, Marlina E, Darusman LK. Classification of Java tea (Orthosiphon aristatus) quality using FTIR spectroscopy and chemometrics. J Phys Conf Ser 2017;835:012012. [CrossRef]
26. Yuliantini A, Rizkiya A, Muttaqin FZ. Fingerprint Analysis of Adulterant in Traditional Medicine of Orthosiphon aristatus Leaves using FTIR Method. In:The Proceedings of the 2nd Bakti Tunas Husada-health Science International Conference (BTH-HSIC 2019). Amsterdam:Atlantis Press;2020. [CrossRef]
27. Ahda M, Jaswir I, Khatib A, Ahmed QU, Mahfudh N, Ardini YD, et al. FTIR fingerprinting profiling, antioxidant activity, and α-glucosidase inhibitory activity of Orthosiphon stamineus leaf ethanolic extracts. Int J Food Prop 2023;26:2025-38. [CrossRef]