
ARTICLE HIGHLIGHTS
The key objective of the research was to identify ethnic cereal-based recipes and evaluate them in terms of their nutritional content, since there has not been much work done on assessing the nutritional value of ethnic dishes.
According to the findings, maize flour had the highest moisture content (14.11%), whereas raw sheera had the highest protein content (13.38). Maize flour had the highest crude fat and crude fiber contents (4.14 and 2.26%, respectively). Wheat flour had the highest ash content (3.26%). Basmati rice had the highest total carbohydrate content (89.94%), whereas maize flour had the lowest (79.29%). Wheat flour had the highest phytic acid content (222.47 mg/100 g), whereas maize had the highest total phenol content (14.72 mg TAE/100 mg).
Meethe chawal had the highest crude fat content (22.19%), Gulgule had the highest crude protein content (12.33%), followed by Tali roti (12.25%) and Akhri roti (12.24%), whereas Chawal roti had the lowest (6.83%). Mithdu (2.84%) and Gulgule (2.82%) had the highest ash contents. Chawal roti had the highest percentage of total carbohydrates, followed by Rice, Akhri roti, Babroo, Bedvin roti, Tali roti, Gulgule, Mithdu, Meethe chawal, and Sheera, with corresponding values of (82.53%), (76.27%), (71.74%), (64.46%), (61.37%), (55.10%), (53.44%), (49.94%), and (49.45%), respectively.
These traditional recipes are nutrient dense and an excellent substitute for fast food. Contrary to fast food, the majority of dishes made from cereals were fermented, making them easier to digest.
In addition, providing these traditional foods in schools, including pre-schools and anganwadis, in the near future will undoubtedly alter young children’s attitudes toward fast food, which is more detrimental to one’s health and exacerbates the problem of childhood malnutrition.
In addition, a wide variety of ingredients and additives are used in traditional cereal based foods. This might eventually assist in creating more beneficial healthcare routines through dietary changes. Owing to the rising demand for traditional meals as well as the growing conviction that ethnic meals are the most sustainable alternatives to offer nutritious food to the world’s population in the future, ethnic food research has consistently expanded globally.
This study, in our opinion, is a novel attempt that eloquently demonstrates the importance of developing a new scientific perspective to comprehend the field of food. If we bring back old traditional ethnic foods that are a source of probiotics and surely have the capacity to produce positive changes in one’s health, the insight would become a holistic approach.
Further research can be done on the bioavailability of nutrients from these food products.
1. INTRODUCTION
Many distinct dishes defined as indigenous or traditional to the Indian subcontinent are included in Indian cuisines, which take the form of different foods. Traditional foods have been consumed for a very long time, and they are based on a firm understanding of culture, tradition, and our surroundings. The usage of functional foods is expanding worldwide as consumer knowledge of health and nutrition has grown because of their health-promoting qualities [1] and capacity to prevent or alleviate diseases in addition to offering satiety [2]. As a result, there has been a rise in consumer demand for functional meals that have positive health effects, which has created new markets for a variety of processed food products with specific health attributes [3].
Food symbolizes community culture by providing information and reflection on their eating habits, food preferences and consumption patterns, nutritional security and community health, agricultural and livestock systems, as well as socioeconomic, ethnic, and religious taboos [4]. It also helps to strengthen social bonds. Traditional foods were created over years and are continually invented, modified, used, and evolved to combat food dissatisfaction [5]. Traditional production processes, procedures, and technologies have been enacted through the generations. Since there are differences in raw material accessibility and environmental conditions, as well as time-tested traditional knowledge, people in various parts of hill states have created, developed, and continued to consume several different traditional meals and beverages peculiar to their regions for centuries.
Traditional food and beverage preparations are mostly limited to the household level, so processes and technologies for food preparation are passed down from generation to generation with little variation and greater adaptability to ethnic values. Food is a part of an ethnic community’s cultural traits. India’s vast subcontinent has cuisines as diverse as its cultures. Every corner of this sprawling nation has gradually developed its own cooking method, as well as its own selection of ingredients and flavor combinations, resulting in a fascinating repository of ideas, techniques, and recipes. Eating habits and preparatory recipes vary by location. Due to traditional methods of preparation, the taste, color, texture, and appearance of the same delicacy vary greatly from place to place [6].
Cereals play an important role in human diets because they provide essential nutrients either directly or indirectly through the production of meat, which is dependent on livestock feed [7]. Traditional dietary habits possess many positive effects on health, including reducing the likelihood of certain aging-related disorders, stroke, arteriosclerosis, and so on [8]. For decades, people in the state have prepared and consumed a variety of traditional foods, which have become a crucial component of the sociocultural life of the hill people. Various technological methods to produce traditional foods from ingredients that are available locally have been developed, with ethnic preferences, agro-climatic conditions, sociocultural ethics, and religion heavily influencing [9]. Some cereal-based traditional foods particular to Himachal Pradesh’s tribal and rural regions include bhatooru, chilra, sidu, manna, sepubari, aenkadlu, baari, babroo, patande, madrah, bedvin roti, chukh, sura, chhang, angoori, churpa, and lugdi [10].
It is vital to sustain the old traditions through tourism, current gastronomic styles and cultures, or exquisite food. Even additional environmental benefits will result from the planned development of regional cuisine employing environmentally sustainable methods. This approach ought to be considered a practical tool for fostering regional integration and conserving resources [11]. Humans are experiencing a variety of health issues as a result of numerous factors, including a lack of understanding about ethnic food composition, technology, changing dietary patterns, and societal beliefs about specific foods [12]. Cereals are the main source of vitamins, minerals, and phytochemicals such as flavones, phytic acid, phenolic acids, terpenes, coumarins, and flavonoids, which have potent antibacterial and antioxidant activities. Consuming cereal grains also lowers the incidence of dietary problems and other diseases associated with oxidative damage [13].
The current investigation was conducted to assess the techniques and nutritional values of the traditional cereal-based foods of Palampur Tehsil, Himachal Pradesh, to include these foods in nutritional programs in the near future.
2. METHODOLOGY
The Palampur Tehsil of Himachal Pradesh’s Kangra district was selected as the main study area for traditional cereal-based foods. A total of three blocks in Palampur Tehsil, namely, Panchrukhi, Bhawarna, and Baijnath, were selected. For the study, three villages from each block were chosen. A two-stage stratified random sampling design was employed to select the households. A total of 120 households were chosen to gather relevant information, thirty from each of the Panchrukhi, Bhawarna, and Baijnath blocks, along with 30 from Palampur. Indigenous knowledge about these recipes was documented using the Participatory Rural Appraisal technique, which included discussions using primary sources as well as conversations in groups drawn at random from various residential areas.
2.1. Study Area
The research investigation was conducted on three blocks of Palampur Tehsil in Kangra district, Himachal Pradesh, namely, Panchrukhi, Bhawarna, and Baijnath. The study included three villages from each of the blocks. The research was focused on the Palampur Tehsil in particular. It embodies the state’s cosmopolitan population.
2.2. Sampling Design
A stratified random sample strategy with two stages was used to choose the households. Similar to cluster sampling, the two-stage sampling strategy divides the population into groups; however, new samples are taken from each cluster sampled. When cluster sizes are large enough, two-stage sampling is used, making it difficult to understand all of the units that make up the cluster. A total of 120 homes from the Palampur Tehsil’s Panchrukhi, Baijnath, and Bhawarna blocks, as well as 30 houses from Palampur in Himachal Pradesh’s Kangra district, were selected to collect relevant data.
To accomplish the goals of the study and arrive at acceptable conclusions, a number of mathematical and statistical instruments, including average, mean, percentage, standard deviation, and variance, were used in the examination.
3. DOCUMENTATION OF TRADITIONAL RECIPES
Various traditional food recipes were collected during the study. The data were acquired in accordance with the protocol, which was divided into various heads and subheads. In addition, the formulations used in the preparation of various food recipes are commonly consumed in the study areas.
Traditional foods in Palampur are rich and varied, with a heavy reliance on local ingredients. These foods are suitable for a healthy and balanced diet. Some food recipes are described further below [Figure 1].
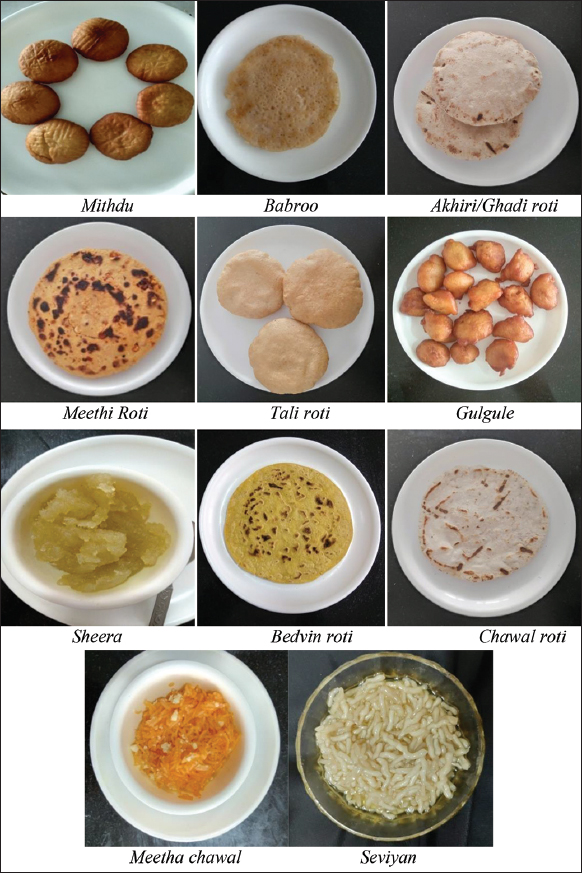 | Figure 1: Traditional cereal based recipes. [Click here to view] |
3.1. Mithadu
In a container, water and sugar were combined; they were then boiled to a syrup consistency for dough preparation. After sieving the flour, add the malera/yeast, dry fruits, and ghee. Knead thoroughly with the sugar syrup/water. The soft dough should be kneaded. The dough was then covered with a cloth/blanket and left to ferment. In the summer, the fermentation process takes about 3–4 h, whereas in the winter, it takes about 5–6 h. After fermentation, the volume of the dough nearly doubled. Small balls were formed and placed in a sancha (a wooden Mithdu maker) to be pressed to the desired thickness. Then, they are deep fried in hot oil.
3.2. Babroo
Rice flour was combined with water to form a thick paste-like consistency. Allowed it to ferment for 3–4 h after adding bread masala or yeast. Salt and sugar were added to taste. In a katori, make a thin layer of the paste on a nonstick pan/griddle with a small amount of the above mixture. Cooked until golden brown on both sides.
3.3. Aakhiri Roti/or Ghadiyan Roti
The dough was made with wheat flour, 5 g of yeast, or malera, and ajwain. Allowed 3–4 h for the dough to ferment. A small amount of dough (25–30 g) was used to make small rotis. Cooked it on a griddle until golden brown.
3.4. Mithi Roti
It was made with sieved maize flour; a small amount of the dough (25–30 g) was rolled into round balls. In a mixing bowl, combine the jaggery and dry fruits. This mixture was filled into the balls, which were then rolled into rotis. On a griddle, cook it until golden brown. Ghee can be consumed with roti or used in cooking.
3.5. Tali Roti
Made dough with sieved wheat flour, 5 g yeast or malera (starter culture), and ajwain. Allowed the dough to ferment for 3–4 h. A small portion of the dough, approximately 25–30 g, was used to make small-sized rotis. Deep-fry the roti until golden brown in hot oil.
3.6. Gulgule
Sieve the wheat flour and mix it into a thick paste with water. Then, I added the yeast and let it ferment for about an hour. After fermentation, stir well again and take a small amount in katori before deep frying in hot oil.
3.7. Sheera
The raw Sheera powder was mixed into a thick paste-like consistency. Melted 4–5 tablespoons of ghee in a frying pan (add more ghee if necessary) and added the paste. Cooked until it starts to leave the side of the pan, then seasoned with sugar to taste and served hot.
3.8. Seviyan
With the sieved wheat flour, make a dough. Took small balls in the extruder. Dried the Seviyaan in the sun for 3–4 days. Dry Seviyaan was stored in airtight containers for future use. Then boiled 50 g of seviyan until soft, and drained the excess water. Ghee was melted in a pan, then added to boiled seviyan and milk. Depending on the desired consistency, it was cooked for 5–10 min. Added sugar and dried fruits of your choice. It must be served hot.
3.9. Bedvin Roti
Boiled Kachalu (colocasia) was peeled and mashed, then green chilies and chopped coriander were added to it and seasoned with salt to taste. Made 30–40 g balls of sieved maize flour, then filled them with mashed stuffing, and rolled out the roti with soft hands. On a griddle, cook it until golden brown on both sides. It goes well with curd, chutney, or hot ghee.
3.10. Chawal Roti (Rice Roti)
Made dough with the sieved rice flour. Took 25 g of dough and formed it into small balls. Made the roti with a gentle hand. It could be cooked on a griddle or deep-fried.
3.11. Meethe Chawal (Sweet Rice)
The rice was cooked in a pressure cooker. Set aside the cooked rice to cool. 100 mL of water, sugar, and 3–5 drops of food coloring were combined to make syrup. Cook the rice for 5 min after adding the sugar syrup. Before serving, add khoya and dry fruits to it.
4. ASSESSMENT OF RAW MATERIALS AS WELL AS PREPARED FOOD RECIPES
The raw materials employed, as well as various food recipes, were examined for the following parameters.
4.1. Chemical and Nutritional Characteristics
4.1.1. Moisture levels [14]
The method of oven drying was used to estimate the moisture content of the sample. A five-gram sample was put in an already weighed, dried moisture box, and baked for 1 h at 105°C in a hot air oven with a partially uncovered lid. To achieve a uniform weight, the moisture boxes were removed from the oven and placed in desiccators for 30 min. After cooling, samples were weighed with moisture boxes. The moisture content of the sample was determined by the weight loss.
 |
4.1.2. Crude protein [14]
The protein content was estimated using the micro-Kjeldahl method, and the nitrogen content was converted into crude protein using a factor of 6.25.
4.1.2.1. Reagents used
Digestion mixture: Copper sulfate: Potassium Sulfate (1:10)
Boric acid solution: 4.0%
Sodium Hydroxide: 40.0%
Standard H2SO4: 0.1 N
Mixed Indicator: 0.1 g Methyl Red and 0.5 g Bromocresol Green in 100 mL of 95.0% ethanol.
4.1.2.2. Procedure
In a Kjeldahl digestion flask with concentrated sulfuric acid (25 mL) and digestion mixture (5 g), a weighted sample (2 g) was broken down. The liquid was then chilled and poured into a 250 mL volumetric flask. Distilled water was combined to create the volume. A condenser was used to collect the ammonium borate into a flask with 10 mL of a 4.0% boric acid solution after a measured aliquot (5 mL) was added to a distillation flask along with 40.0% sodium hydroxide. On the distillate, titration with 0.1 N sulfuric acids was carried out. A blank sample was also taken and ran along with the sample.
 |
Crude protein (%) = Nitrogen (%) × 6.25.
4.1.3. Crude fat reagent [14]
Petroleum ether (B.P. 40–60°C).
4.1.3.1. Procedure
Weighed samples (5.0 g) were extracted in triplets with petroleum ether using a Soxhlet extraction apparatus over a period of 18 h. The ether extract was filtered through a sintered funnel in a pre-weighed beaker and washed 2–3 times with a small quantity of petroleum ether. The petroleum ether must be thoroughly evaporated before weighing the beakers.
 |
4.1.4. Crude fibre reagents [14]
Sulfuric Acid: 1.25%.
Sodium Hydroxide: 1.25%.
4.1.4.1. Procedure
Weighed defatted samples (5.0 g) were digested in triplicate with 200 mL of 1.25% sulfuric acid by gentle boiling for 30 min. The contents were filtered, and the residue was washed with hot distilled water to remove any remaining acid. After transferring the acid-free residue to the same flask, 200 mL of 1.25% sodium hydroxide were added. The contents were digested for an additional 30 min before being passed through filters and washed free of alkali with hot distilled water. The residue was dried overnight in an oven at 105°C, weighed, and then placed in a muffle furnace at 600 ± 5°C for a period of 4 h. The reduction in weight after ignition represented the crude fiber in the sample.
 |
4.1.5. Total ash content [14]
Weighed samples (5.0 g) were placed in silica crucibles and incinerated on a hot plate before being placed in a muffle-furnace at 600°C for 4 h to obtain light-gray ash, and the percentage of ash content was determined as follows:
 |
4.1.6. Total carbohydrates [15]
The percent available carbohydrate content was calculated by subtracting from 100 the sum of the percentage values of moisture, crude protein, crude fat, crude ash, and crude fiber. The values in the samples were expressed as total carbohydrates (%).
Total carbohydrates (%) = 100-(moisture% + protein% + fat% + fiber% + ash%)
4.1.7. Tannins [16]
4.1.7.1. Reagents
20% Na2CO3.
1N Folin ciocalteu reagent (FCR).
4.1.7.2. Extraction
A beaker containing 10 mL of 70% acetone and 0.2 g of finely ground material was used. The extraction process took place for 2 h at 370°C in a shaking water bath. To avoid evaporation, the beaker was densely packed. After the extraction process, the mixture was centrifuged at 3000 rpm for 20 min, and the resulting filtrate was utilized to identify phenols.
4.1.7.3. Estimation
Took a 0.1 mL aliquot of the filtrate and made a final volume of 1.0 mL with distilled water. Now, add 2.5 mL of 20% Na2CO3, followed by 0.5 mL of FCR (1N). The solution was incubated at room temperature for 40 min. A spectrophotometer was used to measure the absorbance of blue at 725 nm, and total phenols were calculated in g/100 g using a standard curve as the basis.
4.1.8. Phytic acid [17]
4.1.8.1. Reagents
Phytate reference solution: 100 mL of 0.2 N HCl were combined with 30.54 mg of sodium phytate to produce a solution that had 200 mL of phytic acid per milliliter.
Ferric ammonium sulfate: 0.2 g of ferric ammonium sulfate was dissolved in 100 mL of 2N HCl and diluted to 1000 mL with distilled water.
Bipyridine solution: 10 g of 2’,2’ bipyridine and 10 mL of thioglycolic acid were dissolved in distilled water to make a 1 L solution. This solution is stable at room temperature for several months.
4.1.8.2. Extraction
A finely ground sample (1 g) was extracted in a shaker with 25 mL of 0.2 N HCl after 3 h of continuous shaking. After vigorous shaking, it was filtered using Whatman No. 1 filter paper, and 0.2 N HCl was used to increase the volume to 25 mL.
4.1.8.3. Estimation
0.5 mL of the aforementioned extract should be pipetted into a test tube with a glass stopper. A solution of ferric ammonium sulfate in 1 mL was added to the test tube. The tube was heated before being centrifuged for 30 min at 3,000 rpm. Now, 1.5 mL of the bipyridine solution and 1 mL of supernatant were added to a different test tube. The absorbance at 519 nm was calculated and compared with that of distilled water. For the standard curve, various concentrations of a standard sodium phytate solution were obtained and distilled to 1.4 mL with water. This solution included 40–200 g of phytic acid. 120 g of phytic acid was represented by a value of 0.5 OD.
 |
4.1.9. Oxalates [18]
4.1.9.1. Reagents
Sulfuric acid (H2SO4): 15 N
Potassium permanganate (KMnO4): 00.1 N.
75 mL of 15 N H2SO4 was added to 1 g of sample. The solution was stirred periodically with a magnetic stirrer for 1 h before being filtered through Whatman No. 1 filter paper. After that, 25 mL of the filtrate was obtained and titrated against a 0.1 N KMnO4 solution for 30 s, until a faint pink color emerged.
 |
5. RESULTS AND DISCUSSION
The nutritional value of raw ingredients and cooked recipes is as follows:
5.1. Moisture Content
The relative moisture content of various crops differed considerably [Figure 2]. The highest moisture content was found in maize flour (14.11%). Begum et al. [19] observed a moisture content of 12.15% in maize flour, which is consistent with the current findings. It was followed by wheat flour (11.93%), basmati rice (9.57%), rice (9.21%), and sheera (7.70%), which had lower moisture content. David et al. [20] determined the moisture content of soft wheat flour to be 3.33%, whereas Begum et al. [19] determined the moisture content of wheat flour to be 13.09%. According to Devi et al. [21], the moisture content of rice ranged from 7.1% to 11.6%. Rice variety PUSA-3 had the lowest moisture content of 11.85%, as reported by Salim et al. [22]. The information in the table relates to the nutritional properties of raw ingredients used in cereal-based recipes.
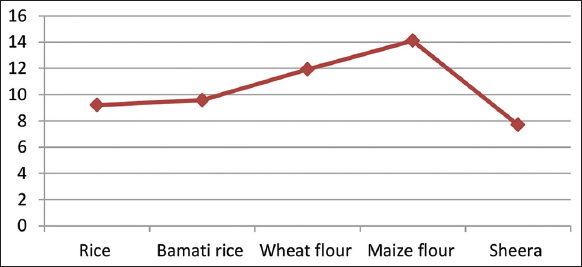 | Figure 2: Moisture content of raw ingredients used in the preparation of cereal based recipes. [Click here to view] |
5.2. Crude Protein
According to Table 1, sheera had the highest crude protein content (13.38%), followed by wheat flour (13.31%), maize flour (12.14%), rice (8.17%), and basmati rice (8.00%). Surve and Dushing [23] reported that the protein content of fermented wheat ranged from 10.13 to 10.81%, which is consistent with the current results for the fermented wheat product sheera. Begum et al. [19] reported the protein content of wheat and maize flour as 9.08% and 12.56%, respectively, which is consistent with the current findings. According to David et al. [20], the protein content of wheat flour is 10.23%. Salim et al. [22] reported protein content for three rice cultivars ranging from 6.35% to 8.13%, which is consistent with the current study.
Table 1: Nutritional characteristics of traditional cereal-based raw ingredients used in recipe preparation.
| Parameters | Rice | Basmati rice | Wheat flour | Maize flour | Sheera | CD (P≤0.05) |
|---|---|---|---|---|---|---|
| Crude protein (%) | 8.17 | 8.00 | 13.31 | 12.41 | 13.38 | 0.49 |
| Crude fat (%) | 0.73 | 0.75 | 1.65 | 4.14 | 1.71 | 0.59 |
| Crude fibre (%) | 0.31 | 0.29 | 1.78 | 2.26 | 0.81 | 0.46 |
| Total ash (%) | 1.10 | 1.03 | 3.26 | 2.17 | 0.86 | 0.37 |
| Total carbohydrates (%) | 89.69 | 89.94 | 80.00 | 79.29 | 83.24 | 0.66 |
5.3. Crude Fat
The crude fat content of various cereals varied significantly, with maize flour having the highest (4.14%). It was followed by sheera (1.71%), wheat flour (1.65%), and rice (0.73%), which had the lowest fat content. Sule et al. [24] found that fat content ranged from 2.17 to 4.43% in maize and maize products, whereas Ullah et al. [25] discovered that fat content ranged from 3.21 to 7.71% in maize varieties, which is consistent with the current findings. David et al. [20] discovered 1.33% crude fat in soft wheat flour. Salim et al. [22] reported that fat content ranged from 0.43 to 0.51% for different rice cultivars, which is consistent with the current study.
5.4. Crude Fiber
Crude fiber levels varied significantly across all five crops, with maize flour (2.26%) having the highest level, followed by wheat flour (1.78%), sheera (0.81%), rice (0.31%), and basmati rice (0.29%). Begum et al. [19] obtained 0.68 and 1.25% fiber content in maize and wheat flour, respectively. According to David et al. [20], soft wheat flour contains 0.51% crude fiber. Devi et al. [21] found that two rice varieties, MTU 3626 and MTU 1010, had the highest crude fiber content of 0.99%.
5.5. Total Ash Content
The total ash content of various crops varied significantly. Wheat flour (3.26%) had the highest percentage, followed by maize flour (2.17%), rice (1.10%), basmati rice (1.03%), and sheera (0.86%). David et al. [20] discovered a 1.00% ash content in soft wheat flour. Begum et al. [19] identified an ash content of 1.60% in maize flour, which is consistent with the current study. Devi et al. [21] discovered total ash content in rice genotypes ranging from 0.43 to 2.34%, which is consistent with the current study.
5.6. Total Carbohydrates
The total carbohydrate content of cereal-based raw ingredients is shown in Table 1. The highest value (89.94%) was found in basmati rice, followed by rice (89.69%), sheera (83.24%), wheat flour (80.00%), and maize flour (79.29%). Devi et al. [21] found total carbohydrate content in different rice genotypes ranging from 78.2 to 85.2%, which is similar to the current study. Ullah et al. [25] reported carbohydrate content in ten different maize varieties ranging from 69.66 to 74.54%, which is consistent with the current findings.
5.7. Phytic Acid
The results for the phytic acid content of various cereal-based ingredients are shown in Table 2. Rice, basmati rice, wheat flour, maize flour, and sheera had phytic acid values of 35.89, 25.96, 222.47, 75.31, and 43.09 mg/100 g, respectively. Rasul et al. [26] discovered 379.9 mg/100 g phytic acid content in wheat. According to Uchechukwu et al. [27], the phytic acid content of maize was 90.23 mg/100 g. Olukemi et al. [28] found the phytic acid content to be 82.81 mg/100 g in maize flour and 121.76 mg/100 g in wheat flour, which is in accordance with the current investigation.
Table 2: Anti-nutritional factors present in raw ingredients used for Traditional cereal-based recipes.
| Parameters | Rice | Basmati rice | Wheat flour | Maize flour | Sheera | CD (P≤0.05) |
|---|---|---|---|---|---|---|
| Phytic acid (mg/100 g) | 35.89 | 25.96 | 222.47 | 75.31 | 43.09 | 29.75 |
| Total phenols (mgTAE/100 g) | 9.22 | 6.20 | 5.30 | 14.72 | 1.49 | 4.07 |
| Oxalates (mg/100 g) | 0.65 | 0.44 | 1.75 | 3.63 | 0.20 | 0.58 |
5.8. Total Phenols
The results of the total phenols content of various cereal-based ingredients are shown in Table 2. Rice, basmati rice, wheat flour, maize flour, and sheera had total phenols of 9.22, 6.20, 5.30, 14.72, and 1.49 mg TAE/100 g respectively. Tannin content in wheat flour was reported to be 8.65 mg/100 g by Gunashree et al. [29]. Uchechukwu et al. [27] found 13.15 mg/100 g of tannins in maize, which is comparable to the present study.
5.9. Oxalates
The oxalate content of cereal-based ingredients was shown in Table 2. Maize flour contained the most oxalates (3.63 mg/100 g), followed by wheat flour (1.75 mg/100 g), rice (0.65 mg/100 g), basmati rice (0.44 mg/100 g), and sheera (0.20 mg/100 g). Oyarekua et al. [30] observed 1.60 mg/100 g oxalate content in wheat, which is on par with the findings of this research. Olukemi et al. [28] found 1.76 mg/100 g of oxalate content in rice and 3.71 mg/100 g in maize, which is comparable to the current study.
5.10. Nutritional Analysis of Traditional Cereal-Based Food Recipes
The nutritional value of cereal-based traditional foods is shown in Table 3. Sheera (25.30%) had the highest moisture content, followed by Bedvin roti (16.91%), Meethe chawal (16.30%), Babroo (14.82%), Rice (12.93%), Gulgule (12.44%), Mithdu (12.42%), Chawal roti (9.18%), and Akhri roti (4.84%). Sheera possessed the highest percentage of crude fiber content (2.45%), which was followed by Bedvin roti (2.14%), Mithdu and Gulgule 2.07%, Akhri roti 2.04%, Tali roti 1.93%, Babroo 0.25%), Meethe rice (0.20%), and rice (0.18%).
Table 3: Anti-nutritional factors present in raw ingredients used for Traditional cereal-based recipes.
| Parameters | Rice | Meethe chawal | Akhri roti | Chawal roti | Tali roti | Bedvin roti | Babroo | Mithdu | Gulgule | Sheera | CD (P≤0.05) |
|---|---|---|---|---|---|---|---|---|---|---|---|
| Moisture (%) | 12.93 | 16.30 | 4.84 | 9.18 | 6.35 | 16.91 | 14.82 | 12.42 | 12.44 | 25.50 | 0.18 |
| Crude protein (%) | 6.76 | 10.69 | 12.24 | 6.83 | 12.25 | 10.4 | 6.86 | 12.17 | 12.33 | 6.27 | 0.21 |
| Crude fat (%) | 0.49 | 22.19 | 1.95 | 0.54 | 15.60 | 4.57 | 5.67 | 17.07 | 15.23 | 15.90 | 0.28 |
| Crude fibre (%) | 0.18 | 0.20 | 2.04 | 0.25 | 1.93 | 2.14 | 0.25 | 2.07 | 2.07 | 2.45 | 0.10 |
| Total ash (%) | 0.57 | 0.68 | 2.67 | 0.67 | 2.49 | 1.52 | 0.67 | 2.84 | 2.82 | 0.42 | 0.12 |
| Total carbohydrates (g) | 79.07 | 49.94 | 76.27 | 82.53 | 61.37 | 64.46 | 71.74 | 53.44 | 55.10 | 49.45 | 0.57 |
Meethe chawal had the highest crude fat content (22.19%), followed by Mithdu (17.07%), Sheera (15.90%), Tali roti (15.60%), Babroo (5.67%), Bedvin roti (4.57%), Akhri roti (1.95%), Rice roti (0.54%), and Rice (0.49%). Gulgule had the highest crude protein content (12.33%), followed by Tali roti (12.25%) and Akhri roti (12.24%), whereas Chawal roti had the lowest (6.83%). Ash content was highest in Mithdu (2.84%) and Gulgule (2.82%), followed by Akhri roti (2.67%), Bedvin roti (1.52%), Meethe chawal (0.68%), Chawal roti (0.67%), Rice (0.57%), and Sheera (0.42%). Chawal roti had the highest percentage of total carbohydrates, followed by Rice, Akhri roti, Babroo, Bedvin roti, Tali roti, Gulgule, Mithdu, Meethe chawal, and Sheera, with corresponding values of (82.53%), (76.27%), (71.74%), (64.46%), (61.37%), (55.10%), (53.44%), (49.94%), and (49.45%), respectively. Farzana and Mohajan [31] examined the nutritional characteristics of wheat products such as alsi ke laddu, coconut laddu, green gram laddu, groundnut gacchak, groundnut ke laddu, and sundh ke laddu. On a fresh weight basis, the maximum values for fat, crude fibre, energy, calcium, and iron were 29.85%, 1.23%, 480 kcal, 142 mg, and 23.95 mg, respectively. The ash content was comparable to the present study.
According to Agrahar-Murugkar and Subbulakshmi [32], the protein content of rice-based snacks ranged from 3.9 to 9.1%. Pumaloi, Jashulia, Pulum, Pusla, and Pukhlein, fried products, had fat contents ranging from 0.1 to 14.5%. Fiber content ranged from 0.1 to 1.4% in Jashulia, and minerals ranged from 0.4 to 1.4% in Pumaloi and Pulsa, which is in accordance with the present research. Sharma et al. [33] observed that in ethnic foods made from cereals with or without pulses, protein content increased from 5.1 to 6.2 and thiamine content increased from 0.49 to 1.3 mg/100 g.
6. CONCLUSION
The current investigation was undertaken with the goals of documenting traditional cereal-based food recipes, their processes or preparations, and the nutritional evaluation of the selected food recipes. The current study concluded that traditional cereal-based recipes had higher nutritional value, along with sufficient quantities of minerals, vitamins, protein, and dietary fiber. Cereal-based fermented foods did possess health benefits, and these have been consumed by locals for decades. There is a need to document such food recipes, as they are missing the critical attention that they ought to receive. If we keep neglecting this major problem, our indigenous traditional knowledge of such food recipes will disappear earlier due to current food choices and shifting lifestyle patterns.
7. ACKNOWLEDGMENTS
Special thanks to the College of Community Sciences, CSKHPKV, Palampur, Himachal Pradesh, 176062, for accumulating the research work.
8. AUTHOR CONTRIBUTIONS:
Writing—original draft preparation, methodology, investigation, conceptualization, RS; formal analysis, writing—review and editing, SK, KT, and MK; review and editing, DS. All authors have read and agreed to the published version of the manuscript.
9. FUNDING
There is no funding to report.
10. CONFLICTS OF INTEREST
The authors report no financial or any other conflicts of interest in this work.
11. ETHICAL APPROVALS
This study does not involve experiments on animals or human subjects.
12. DATA AVAILABILITY STATEMENT
All the data is available with the authors and shall be provided upon request.
13. PUBLISHER’S NOTE
This journal remains neutral with regard to jurisdictional claims in published institutional affiliation.
REFERENCES
1. Saeed F, Hussain M, Arshad MS, Afzaal M, Munir H, Imran M, et al. Functional and nutraceutical properties of maize bran cell wall non-starch polysaccharides. Int J Food Prop 2021;24:233-48. [https://doi.org/10.1080/10942912.2020.1858864]
2. Nazir M, Arif S, Khan RS, Nazir W, Khalid N, Maqsood S. Opportunities and challenges for functional and medicinal beverages:Current and future trends. Trends Food Sci Technol 2019;88:513-26. [https://doi.org/10.1016/j.tifs.2019.04.011]
3. Xiong Y, Zhang P, Warner RD, Shen S, Fang Z. Cereal grain-based functional beverages:From cereal grain bioactive phytochemicals to beverage processing technologies, health benefits and product features. Crit Rev Food Sci Nutr 2020;62:2404-31. [https://doi.org/10.1080/10408398.2020.1853037]
4. Tamang JP. Naturally fermented ethnic soybean foods of India. J Ethn Foods 2015;2:8-17. [https://doi.org/10.1016/j.jef.2015.02.003]
5. Inamdar VI, Chimmad BV, Naik R. Nutrient composition of traditional festival foods of North Karnataka. J Hum Ecol 2005;18:43-8. [https://doi.org/10.1080/09709274.2005.11905805]
6. Blah MM, Joshi SR. Nutritional content evaluation of traditional recipes consumed by ethnic communities of Meghalaya, India. Indian J Tradit Knowl2013;12:498-505.
7. Deka P, Sit N. A review of the traditional cereal based foods and beverages of North-East India. Int J Gastron Food Sci 2023;31:100632. [https://doi.org/10.1016/j.ijgfs.2022.100632]
8. Linderberg S, Cordain L, Eaton SB. Biological and clinical potential of a palaeolithic diet. J Nutr Environ Med 2003;13:149-60. [https://doi.org/10.1080/13590840310001619397]
9. Thakur N, Savitri, Bhalla TC. Characterization of some traditional fermented foods and beverages of Himachal Pradesh. Indian J Tradit Knowl 2004;3:325-35.
10. Savitri, Bhalla TC. Traditional foods and beverages of Himachal Pradesh. Indian J Tradit Knowl 2007;6:17-24.
11. Sarkar T, Salauddin M, Paul A, Choudhury T, Chakraborty R, Faisal I. The essence of Bengal's ethnic sweetmeats:An exploratory journey through history, tradition, and culture. J Food Qual 2023;2023:5008420. [https://doi.org/10.1155/2023/5008420]
12. Smanalieva J, Iskakova J, Musulmanova M. Milk-and cereal-based Kyrgyz ethnic foods. Int J Gastron Food Sci 2022;29:100507. [https://doi.org/10.1016/j.ijgfs.2022.100507]
13. Kamal GM, Liaquat A, Ayesha N, Sabir A, Saqib M, Khalid M, et al. Phtyochemical profile of cereal grains. In:Nayik AG, Tufail T, Anjum FM, Ansari MJ, editors. Cereal Grains:Composition, Nutritional Attributes, and Potential Applications. 1st ed. Boca Raton:CRC Press;2023. 177-93. [https://doi.org/10.1201/9781003252023-9]
14. AOAC. Approved Methods of Association of Official Analytical Chemists.7th ed. Saint Paul, Minnesota:AOAC;2010. 345.
15. NIN (National Institute of Nutrition). Dietary Guidelines for Indians-A Manual. Hyderabad, 2010.
16. Makkar HP, Blummel M, Borowy NK, Becker K. Gravimetric determination of tannins and their correlations with chemical and protein precipitation method. J Sci Food Agric 1993;61:161-5. [https://doi.org/10.1002/jsfa.2740610205]
17. Haug W, Lantzch HJ. Sensitive method for the rapid determination of phytate in cereals and cereal products. J Sci Food Agric 1983;34:1423-6. [https://doi.org/10.1002/jsfa.2740341217]
18. Day RA, Underwood AL. Qualitative Analysis. 5th ed. New Delhi, India:Prentice Hall Publications;1986. 701.
19. Begum R, Uddin MJ, Rahman MA, Islam MS. Comparative study on the development of maize flour based composite bread. J Bangladesh Agric Univ 2013;11:133-9. [https://doi.org/10.3329/jbau.v11i1.18224]
20. David O, Arthur E, Kwadwo SO, Badu E, Sakyi P. Proximate composition and some functional properties of soft wheat flour. Int J Innov Res Sci Eng Technol 2015;4:753-8.
21. Devi GN, Padmavathi G, Babu VR, Waghray K. Proximate nutritional evaluation of rice (Oryza Sativa L.) J Rice Res 2015;8:23-32.
22. Salim R, Nazir F, Yosuf N, Amin F. Chemical composition of different rice cultivars grown in North India.Int J Chem Stud 2017;5:1929-30.
23. Surve VD, Dushing PM. Charaterization and development of wheat based Kurdi an indigenous fermented food. Int J Curr Microbiol Appl Sci 2018;6:1242-55.
24. Sule EI, Umoh VJ, Whong CM, Abdullahi IO, Alabi O. Chemical and nutritional value of maize and maize products obtained from selected markets in Kaduna state, Nigeria. Afr J Food Sci Technol 2014;5:100-4.
25. Ullah I, Ali M, Farooqi A. Chemical and nutritional properties of some maize (Zea mays L.) varieties grown in NWFP Pakistan. Pak J Nutr 2010;9:1113-7. [https://doi.org/10.3923/pjn.2010.1113.1117]
26. Rasul G, Hussain A, Mahapatra B, Dangol N. Food and nutrition security in the Hindu Kush Himalayan region. J Sci Food Agric 2018;98:429-38. [https://doi.org/10.1002/jsfa.8530]
27. Okafor UI, Omemu AM, Obadina AO, Bankole MO, Adeyeye SA. Nutritional composition and antinutritional properties of maize ogi cofermented with pigeon pea. Food Sci Nutr2018;6:424-39. [https://doi.org/10.1002/fsn3.571]
28. Olukemi AR, Abedemi OO, Abdulsalam SS. Functional properties and antinutritional factors of some selected Nigerian cereals. Compr Res J Agric Sci 2016;1:8-12.
29. Gunashree BS, Kumar RS, Roobini R, Venkateswaran G. Nutrients and antinutrients of ragi and wheat as influenced by traditional processes. Int J Curr Microbiol Appl Sci2014;3:720-36.
30. Oyarekua MA. Comparative studies of co-fermented maize/pigeon pea and Sorghum/Mucuna as infants complementary food. Wudpecker J Food Technol 2013;1:1-8.
31. Farzana T, Mohajan S. Effect of incorporation of soy flour to wheat flour on nutritional and sensory quality of biscuits fortified with mushroom. Food Sci Nutr 2015;3:363-9. [https://doi.org/10.1002/fsn3.228]
32. Agrahar-Murugkar D, Subbulakshmi G. Nutritive values of wild edible fruits, berries, nuts, roots and spices consumed by the Khasi tribes of India. Ecol Food Nutr 2005;44:207-23. [https://doi.org/10.1080/03670240590953025]
33. Sharma N, Gupta A, Handa S. An exploration of rich microbial diversity of rare traditional functional foods of Trans Himalayan state of India with proven additional probiotic effect. Int J Curr Microbiol Appl Sci2014;3:999-1014.