
ARTICLE HIGHLIGHTS
Sugarcane Yield prediction is carried out by Temporal-based Swin Transformer Network (TSTN), because existing CNN models are not very adequate for the extraction of long-range dependencies. The Swin Transformer incorporates the attention mechanism to encode remote dependencies and learn highly expressive representations. The proposed model is focused on Uttar Pradesh mainly because sugarcane was cultivated on 28.53 lakh hectares in Uttar Pradesh, which is more than any state in the country. To improve the classification accuracy, the Nutcracker optimizer algorithm is used for selecting the weight of the Long Short-Term Memory that is one of the components in the TSTN model.
1. INTRODUCTION
In order to meet the growing need for food, industrialization, and more intense agricultural production have become more important. The rapidly developing Internet of things (IoT) industry, which is leading the way in the new agricultural era, is putting forth a number of innovative ideas. By joining the IoT, research institutions and scientific groups hope to expand their reach and activity, bringing new technology and products to the agricultural sector. In 2000, with the advent of the Massachusetts Institute of Technology’s Auto-ID Center and subsequent reports, the concept of the IoT rose to prominence. These embedded technologies in the systems’ internal and exterior states allow for communication, perception, and connection in the IoT [1]. Many industry experts consider IoT to be the wave of the future because of its potential to boost the level of integration between final goods, schemes, and services. Healthcare amenities are just some of the many areas where IoT technologies shine [2].
Growing populations place a greater emphasis on agricultural output. According to the FAO’s projections, the global population will hit 9.73 billion in 2050 and rise to 11.2 billion in 2100 [3]. The request for artificial intelligence and the Internet in cyber-physical farm management is at the heart of the idea of “smart agriculture.” Because it permits the observation of shifts in climate conditions, soil properties, soil moisture, etc. [4], smart agriculture solves several problems associated with crop production. Because it enables objects to be linked together over the internet to be run autonomously [5], IoT technology may connect numerous distant sensors, including robots, ground sensors, and drones.
Sugarcane, which contains between 15 and 17% sugar, grows best in tropical climates [6]. Before being delivered to the factory, where the procedure described in the present experiment would start, sugarcane was either manually or mechanically harvested [7]. In the mill, it was then put on a specific conveyor system and weighed, washed, and crushed. In addition, while the sugarcane was being crushed, juice was pushed out [8]. After the sugarcane was removed, its juice was mixed and delivered to the raw section. Paper is created from bagasse, which is primarily composed of cellulosic fibers, and it can also be used as fuel. The lime method is frequently suggested as a workable solution when it comes to eliminating the pollutants present in raw juice [9]. The unglued, concentrated juice was then transferred to the oven after being clarified and condensed in three or five steps using vacuum-connected evaporators. In addition, the baking process was completed in stages, frequently up to three [10,11]. In addition, the sugar associated with each mascuit was isolated from the wastewater by centrifuging the mascuit in the proper centrifuge apparatus [12]. The effluent from Bake A is considered to be for Bake B when utilizing a three-mascuit system, for example, and vice versa. The remaining molasses were collected after removing baking C from the centrifuge [13].
After reviewing the relevant literature, we use the capabilities of the proposed model to make predictions about all of the influential factors in sugar production [14]. In this study, we introduce a Swin Transformer network (TSTNet) that uses temporal information to address phase identification problems. TSTNet is an end-to-end network that can improve the effectiveness of long-distance data gathering and address the numerous issues with current approaches to surgical video analysis. To make up for the shortcomings of traditional recognition techniques in terms of long-distance dependency extraction, the model creates a unique TSTN for sugarcane yield analysis. TSTN introduces an attention approach to encode distant dependencies and extract aspects using Swin Transformer as a reference network. In order to learn interdependencies across large distances, long short-term memory (LSTM) is employed. End-to-end training is used to teach the network how to best extract spatiotemporal characteristics, which are richer in context. The nutcracker optimizer algorithm (NOA) model determines the optimal weight of the LSTM. Increasing production, decreasing damages, removing boredom from the assembly line, and taking prompt judgments are all examples of boosting manufacturing productivity.
2. RELATED WORKS
To meet the demands of sugarcane farmers in India, Atheeswaran et al. [15] offer a smart farming system that employs intelligent solutions based on soft computing. Three sugarcane qualities, including color, shape, and texture, and four sugarcane illnesses (Eyespot, Leaf Scald, and Boeng), are studied. With photos acting as training data for fuzzy and case-based reasoning methods, the accuracy of the feature extraction method’s performance was evaluated.
The approach reported by Ribeiro et al. [16] uses a convolutional neural network to extract crop lines from plantation photos. We compared U-Net, LinkNet, and PSPNet, three different network models. To extract the feature maps, we employed the VGG16 network structure that had previously been trained on ImageNet for all networks. Training using a dataset created from the mixing of diverse plantations’ crops E (500), which enhances the network’s capacity to segment the pictures. The results showed that U-Net provides the best results for segmenting crop lines among the datasets examined. We also examined a line reconstruction method based on the Radon transform. The Dice coefficient goes down very slightly after the rebuilding. However, by resolving the disconnected crop lines and missing plants, it helps us get better segmentation results in some photos. These findings suggest that our method is a workable strategy for identifying crop lines in photos.
The MSVM-DAG-FFO technique presented by Senapaty et al. [17] provides farmers with access to and analysis of the processed soil data. To enter this cloud data, assess it, and anticipate the best crops to grow, an Android app was created. The FFO procedure is responsible for tuning the MSVM perfectly by deciding which kernel functions to use. Extensive experimental validation was performed at five distinct time points utilizing SVM, SVM kernel, decision tree, and MSVM-DAG-FFO using real-time data from four distinct crops. The accuracy rate was found to be much higher when compared to other approaches. Over the course of the five iterations, the suggested model has an average accuracy of 0.969. If you want to know what crops will thrive in a certain region, this is the method to use. In addition, it is possible to save information about the soil’s health on a regular basis in an inexpensive cloud, which not only helps farmers make educated crop selections but also provides them with the data they need to make informed decisions about the mineral supplements they use.
A hybrid optimum machine learning approach (HOML-SL) for detecting illness in sugarcane leaves has been proposed by Selvakumar and Seetharaman [18]. To begin, we present a segmentation technique based on non-linear cluster optimization that removes the infected portion of a sugarcane leaf while preserving the rest of the leaf. Second, we create a method for picking the best features from a pool of candidates, and we do this with the help of the cross-layer optimization algorithm. Finally, we show how sugarcane leaf diseases may be categorized using a moth flame-based capsule algorithm when compared to others. In terms of precision, recall, and F-measure, the suggested HOML-SL illness detection method performs comparably to the best methods currently available.
Ali et al. [19] have summarized the innovative methods used to counteract the consequences of climate change while still producing sufficient agricultural yields. The technologies used for yield prediction and enhancement, as well as smart strategies for contemporary crop management techniques, are also covered. It has been demonstrated that in order to increase agricultural yields, smart farming practices and the IoT must be put into place. With an average simulation accuracy of up to 92%, it was shown that different neural networks and simulation models might help in yield prediction for improved decision support. For accurate monitoring of crop health and water availability, several methods have been described, including those for predicting yields, controlling pests, implementing smart irrigation, and identifying and classifying diseases. Energy consumption may be decreased by as much as 8% with the use of various numerical models and smart irrigation tools, and the cost of irrigation can be cut by 25.34% when using advanced irrigation rather than a system based on soil moisture. In addition to assisting in the modification of current irrigation and fertilizer management practices, yield prediction under different expected climatic circumstances leads to resource use efficiency and lucrative agricultural output. Diseases may be effectively controlled and yields maintained through the use of smart and precise disease management. Using image processing tools, such as a genetic algorithm, farmers may effectively control leaf diseases across a wide range of crops. Using neural networks to help with image processing, researchers were able to obtain a detection and classification accuracy of 98% across a variety of crop illnesses. The effects of urbanization on food productivity have been examined, and prospective remedies, such as vertical farming and its numerous indoor production techniques, have been proposed. The use of artificial illumination with the goal of supplying and exploring is necessary for the better development and growth of a variety of horticultural produce.
The data base of a fuzzy inference system is developed with these climatic parameters in mind, as described by Sharma et al. [20]. Fuzzy rules are used by the multi-objective evolutionary procedure to determine the best time to plant crops and the best way to prevent the spread of pests. Fuzzy logic is used to determine the optimal planting times for crops in medium-grass environments, and an IoT sensor network monitoring architecture is proposed here. Rice and sugarcane crops are being tested at this time. The research was conducted at a farm near Gwalior, Madhya Pradesh, India. Wireless sensor nodes were set up around the field to record variables including soil moisture, precipitation, temperature, and more. IoT application development services use fuzzy logic to determine when it is best to grow crops, allowing farmers to avoid insect infestations and take other preventative measures for higher yields.
3. RESEARCH METHODOLOGY
3.1. Dataset Description
The economy of the Indian state of Uttar Pradesh is largely dependent on sugarcane. The terrain is fairly sloped, and the soil is primarily sandy loam. This region’s sugarcane harvest, referred to as “Eksali,” takes roughly a year to complete. Here, early cultivars are grown alongside more common mid-late cultivars like CoS 767, Cos 8432, Cos 99 and 259, etc., which are planted in February and March. Early cultivars include Co 0238, Co 98,014, CoS 8436, and CoS 88,230. Other important crops in the state include wheat, rice, mustard, maize, bajra, and a variety of seasonal vegetables and fruits. Since 1999 and 2002, the Terra and Aqua satellites have been using the moderate-resolution imaging spectroradiometer (MODIS) sensor. It has a massive 2,330 km sweep width and offers images in 36 different spectral bands. They have spatial resolutions of 1000 m, 500 m, and 250 m and orbit the Earth every 2 days.
Approximately forty-four major geophysical outputs are available from the MODIS sensor, which may be used for research into the atmosphere, land, and ocean on a global scale at medium resolution. It provides processed, high-level products that directly address the requirements of regional to global modeling and nursing, relieving end-users of the load of data processing. Vegetation indices, MOD 13: Normalized Difference Vegetation Index and Enhanced Vegetation Index were used in this investigation. Products for the research field were gathered with the use of a program called AppEEARS (Extraction and Exploration of Analysis-Ready Samples). Users of AppEEARS may quickly and easily apply spatial, temporal, and layer parameters to select geographic datasets. The standard precipitation index, calculated from the climate hazards center infrared precipitation with station data (CHIRPS) precipitation datasets, was also employed in this investigation. From 1981 until very recently, this data represents precipitation on a nearly worldwide scale. By combining satellite imagery with local station rain gauge data, CHIRPS provides a gridded rainfall time series for trend research.
Time-series yield information for Uttar Pradesh’s individual districts was culled from the states. The agricultural mask for the research region was extracted using the land-use land cover (50k) map available through thematic services on the Bhuvan Portal (Indian Geo-Platform of ISRO) [21].
The obtained data contains numerous challenging frames that are challenging to recognize effectively by visual cues. Therefore, it is critical to record interdependencies throughout time. Due to induction architectures, previous recognition approaches that rely on CNNs as the backbone network do not fully comprehend long-range correlations in pictures. The foregoing motivates our proposal of a Swin Transformer Network (TSTN) model for temporally-based agricultural yield recognition. Figure 1 shows the planning for implementing the IoT-based model for sugarcane yield prediction.
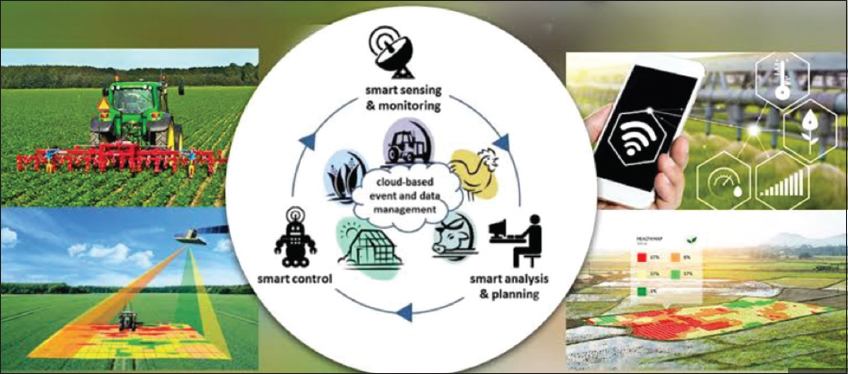 | Figure 1: Internet of things based smart farming in sugarcane field. [Click here to view] |
3.2. TSTN
The swin transformer architecture is used to train the TSTN network, depending on the pre-training model weight of the data set. After that, swin transformer is used to record a variety of scales of visual information from individual images. Modeling the temporal information of successive frames is done via an LSTM network [22]. Our TSTN network naturally includes these two components and is fashion to provide spatiotemporal features with significant discriminating capability.
3.2.1. Swin transformer network
We have challenges in obtaining spatiotemporal characteristics with excellent identification performance due to the complexity of the surgical environment. We suggest employing the swin transformer, centered on its attention mechanism, to solve this challenging but important task, in contrast to prior methods that used CNNs as the gold standard network for recognition tasks.
There are four distinct stages in the swin transformer network. Its feature map resolution is the same as that of other popular convolutional networks (like VGG and ResNet). Bottom-level data processing is becoming increasingly localized. The top network processes less input overall, but this is offset by a wealth of semantic information that allows for seamless integration of multiscale aspects. There are two sequential swin transformer blocks on stage, with the linear embedding layer in between them. The following formula’s (1), (2), (3), and (4) are used for calculating swin transformer blocks, and Figure 2 depicts its layout:
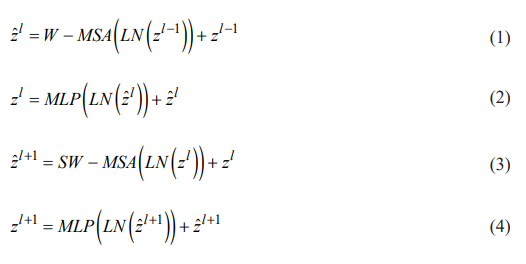
 | Figure 2: Two successive Swin transformer blocks. [Click here to view] |
Where z^l signifies the output structures of the module and reflects zl the block l characteristics that were produced by MLP. In contrast to SW-MSA, which employs a shifted window partition design, W-MSA refers to a window-based self-attention technique that makes use of a conventional window partition arrangement. The multihead self-attention mechanism of swin transformer, together with the network structure of multiscale attention fusion, not only establishes global connections between sequences but also completely extracts the feature information of pictures at varying scales. A more reliable feature representation for the yield recognition task is provided by the network’s ability to extract deep semantic information and merge superficial semantic information.
In this study, the pre-training model of a swin transformer is used to refine the entire dataset based on its performance on the massive dataset gathered during the first training. A D K complete connection layer with an initial value of 0 is added in lieu of the final prediction layer. The target dataset has K categories, and D is the D-dimensional feature vector.
3.2.2. LSTM network
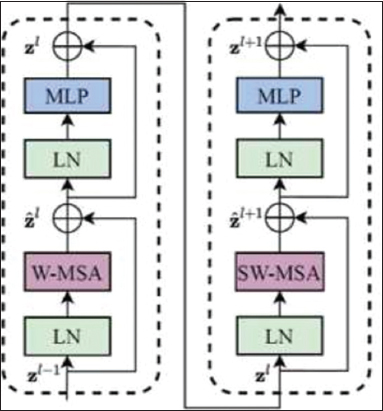
It is challenging to correctly discern between phases of sugarcane yield methods using only visual information. Richer content and more useful information for process identification are provided by the spatiotemporal duality of the input pictures. Phase identification can benefit greatly from the efficient extraction of high-quality temporal characteristics. To get around this issue of long-term dependencies and extract additional temporal characteristics with contextual information, we employ LSTM.
While the LSTM’s exterior state ht RD of the hidden layer is output non-linearly, a new internal state ct RD is introduced for linear cyclic transfer. The swin transformer outputs feature information, and the current moment unit gets the state of the preceding moment (ht1). The mental state of the preceding instant is under the jurisdiction of the first forgetting gate - ft. The amount of data that must be stored in the candidate state at the present time is set by the input gate. When the forgetting gate is combined with the input gate, a new state value, ct, is produced; this value remembers events that occurred before the present time and replaces the previous neuron state, ct1, with the current state, ct. The whole network sets up long-range temporal relationships via the recurrent unit. The formulas (5), (6), and (7) depict the same as follows:
When dealing with a long input sequence, LSTM’s gating mechanism keeps the network model’s gradient from disappearing. These studies are carried out entirely online. To train in an end-to-end fashion, the sequences are fed into TSTN. To be more specific, we feed the 1024-dimensional characteristics generated by a swin transformer into a one-way LSTM-linked layer. The LSTM network is comprised of 512 neurons and uses a 10-fold step size. During backpropagation, the swim transformer and LSTM share parameters that are optimized together. This allows for the extraction of spatiotemporal characteristics with a high degree of recognition. The anticipated picture frame classes are then output via a fully linked layer. The NOA model is used to determine the LSTM’s weight appropriately, as will be shown below.
3.2.2.1. Overview of NOA
Taking its cue from Clark’s nutcracker, [22] NOA is an innovative metaheuristic algorithm based on natural principles. The nutcracker gathers pine nuts (food) in the summer and fall, stashes them away, and then comes back to the stash in the spring and winter to forage for more. We drew inspiration from this concept of food availability to suggest two methods: (i) a foraging and caching approach, and (ii) a caching search and recovery method. Following population seeding, a fitness function of RMSE is applied to guide further rounds of random exploration and exploitation optimization.
3.2.2.2. Foraging and storage strategy
First, the nutcracker explores the environment in search of high-quality seeds during the summer and fall months. Since the storage location is frequently far from the search area and has less foliage in the winter and spring, the nutcracker may find it easier to collect the seeds at those times.
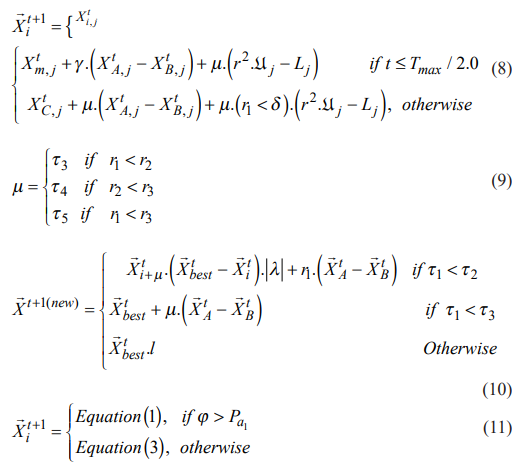
The formula for this tactic is shown in equations (8–11). The nutcracker’s hunt for nutritious seeds is depicted in Eqs. (8) and (9). Initial jurisdiction of ![]() represents maintaining solution space based on the typical value
represents maintaining solution space based on the typical value ![]() of all keys in the current population, and any solution
of all keys in the current population, and any solution ![]() and
and ![]() . The nutcracker’s initial stage of development, represented by Formula (10), is analogous to the storage of seeds. The state-of-the-art optimum solution directs algorithm development
. The nutcracker’s initial stage of development, represented by Formula (10), is analogous to the storage of seeds. The state-of-the-art optimum solution directs algorithm development ![]() and l, a variable that goes from 1 to 0 in a straight line. The probabilistic formula (11) represents a compromise between algorithmic discovery and refinement. Pa1 decreases linearly from 1 to 0.
and l, a variable that goes from 1 to 0 in a straight line. The probabilistic formula (11) represents a compromise between algorithmic discovery and refinement. Pa1 decreases linearly from 1 to 0.
3.2.2.3. Cache search and recovery strategy
The nutcracker relies on its spatial memory and the use of landmarks to find the food it has stashed away for the winter and spring. About 20% of nutcrackers, however, are unable to access their stored food and must thus find other nutrition.
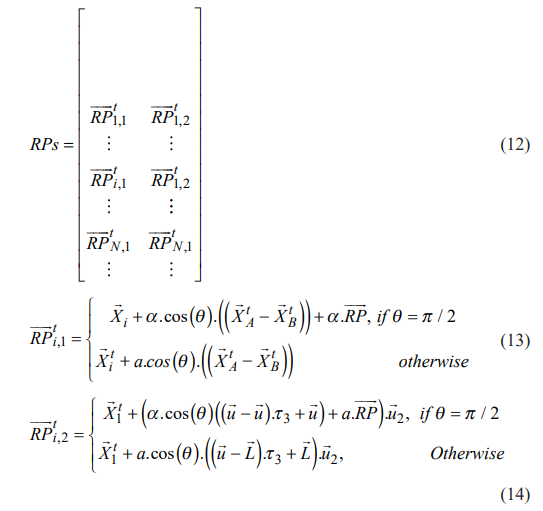
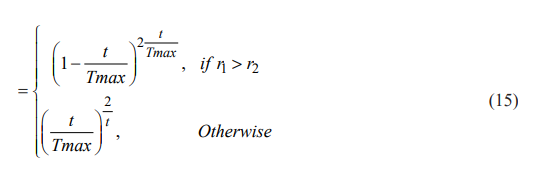
A mathematical model of the RP is given by Equations (12)–(15). AbdelBasset made the assumption that each cache had two reference points, leading to a two-column RP matrix in Equation (12). The two approaches to solving the RP are outlined by Equations (13) and (14). Equation (15) is utilized to modify RP with the second term in a linearly expanding form. Nutcracker retrieval is also characterized as a process of continuous learning from prior experiences.
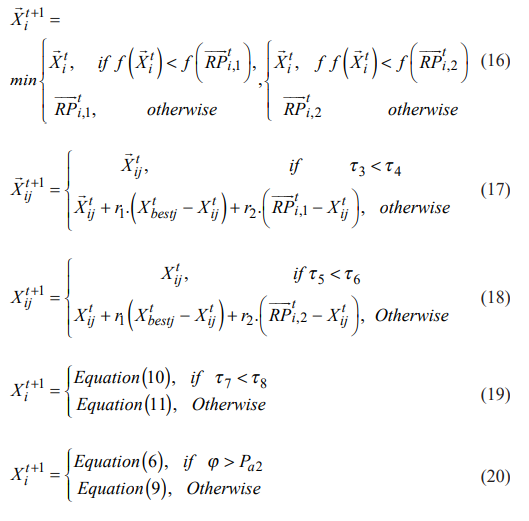
Formula (16) outlines the steps involved in the nutcracker’s second exploration phase, which include a search for seeds and the subsequent recovery of a cache from the storage region. Formulas (17) and (18) outline how to determine a new position by using the smaller of two starting points. According to the best possible answer ![]() and
and ![]() and
and ![]() , the using random numbers to create a blend of the two anchor points, as demonstrated by Formula (19). In order to balance the exploration and expansion processes in accordance with this policy, Pa2 is used in the forage and storage strategy formula (8).
, the using random numbers to create a blend of the two anchor points, as demonstrated by Formula (19). In order to balance the exploration and expansion processes in accordance with this policy, Pa2 is used in the forage and storage strategy formula (8).
3.2.2.4. Implementation of NOA
When using NOA for optimization, it is necessary to seed the population within the constraints you establish:
In accordance with their foraging and storage strategies, the nutcracker population then goes through an exploration and exploitation stage, followed by a cache search and retrieval stage. These two plans are executed simultaneously with 50/50 odds. Each nutcracker stands for an approach to the issue at hand. In the first phase, candidates are represented as potential food sources, and in the second phase, by caches. By using these techniques, fresh solutions are chosen and evaluated to determine the values of the fitness function to be optimized.
Alpha, the fraction of attempts to avoid local optima, and Prb, the fraction of explorations of other regions in the search space, must be pre-set during the NOA’s initialization process along with the population size, search boundaries, and iterations. The values of Alpha = 5% and Prb = 0.2 were used for this article to strike a good balance between the exploration and exploitation phases, as suggested by the original code. In both approaches, it is crucial to adhere to the information-sharing mechanism and coordinate with one another to find a happy medium and avoid local optima in the solution space through both exploration and exploitation.
Initial samples are delivered into the network for this purpose, and the network then adjusts its parameters. With the aid of these recently trained network samples, the output is precise with little room for error. Table 1 displays the prediction of sugar output using the characteristics that are currently available.
Table 1: Remaining features for forecasting sugar yield.
| Feature | Description |
|---|---|
| Mixed juice | Primary and secondary ingredients combined to create mixed juice |
| Bagasse | The cane waste left over from crushing in a single mill or a series of mills |
| POL | Sucrose consists of the monosaccharides glucose (dextrose, grape sugar, maize sugar, and blood sugar) and fructose (levulose, fruit sugar). |
| ASH | What’s left over after burning a product according to certain circumstances |
| Fiber | The dry, water-insoluble matter in the cane |
| Clarified juice | The finished product of the clarification process |
| Magma | A mechanical crystals and molasses or weighty syrup |
| Molasses | The sugar crystals in a massecuite are separated from the mother liquor, also known as moasses, when the massecuite is spun in a centrifugal machine. |
Prediction phase data collection processes were carried out as an example. These data were used to train a model for future predictions. Data was submitted into the program either by the user performing manual laboratory experiments or by using control machines or accurate devices connected to the program through ports. If the mean or other dependent variable star requires computation, the software performs those computations and sends the results to the prediction model.
The total number of records equaled the sum of the findings of experiments done at intervals of 1 or 2 h at various stages of product processing. To forecast the outcome of the program and collect data for an artificial neural network. The average number of hours of data collected per day was transformed into new data. All patterns were organized into distinct sequences according to the nature of the labor involved at each stage of sugar production. Each series’ characteristics were also portrayed. The results of one stage are considered the input for the subsequent stage in the sugar manufacturing process due to the interconnected nature of the several steps involved in turning sugarcane into sugar. To rephrase, every segment is treated as a separate system whose number of inputs is equal to the number of characteristics of the one before it. As a result, these findings can be used to make inferences about the current system’s characteristics.
After being trained with some sample data, a neural network can make accurate predictions when presented with additional, unseen data. The extension mechanism, which is completely internal, is used to generate this result. In this stage, the software records the properties of each step in the process and feeds that information into the neural networks. The software then evaluates how accurately the artificial neural networks predicted the system’s output. In the event of a discrepancy between these two results, the program verifies the existence of an issue and prompts the user to take action; otherwise, it allows the user to go to the next stage of the procedure. The calculations would benefit from normalizing the data series first. At this point, we have tried using the following equation to normalize the database values to fall somewhere between zero and one.
The data were then normalized, with XN and XI standing for the standard and observational data, respectively. In addition, XMAX and XMIN show the maximum and minimum values, respectively, for the data set. To achieve this objective, we employed Eq. (22) [23].

The networks were trained on a GTX1080 Ti 11GB GPU with 64GB of DDR4 2400MHz Duel Channel RAM. Software configuration on Windows 10 included Tensor flow GPU 2.4.1 and Keras 2.3.1.
4. RESULTS AND DISCUSSION
4.1. Performance Evaluation Metric
Classification metrics, including accuracy, precision, recall, and F-measure, were used to evaluate models and deep networks. The percentage of right detections is measured by accuracy, the percentage of relevant examples is measured by precision, and the percentage of relevant instances is measured by recall. When assessing a method’s overall performance, the F-measure is helpful because it considers both precision and recall.
Since the data are collected from the UP, the generic deep learning techniques are considered and tested with research work, and the results are averaged in Tables 2 and 3.
Table 2: Analysis of proposed model for 80–20% of data.
| Model | Accuracy | Recall | Precision | F-measure |
|---|---|---|---|---|
| CNN | 0.8834 | 0.8009 | 0.8175 | 0.8091 |
| RNN | 0.8862 | 0.7492 | 0.8657 | 0.8032 |
| LSTM | 0.8605 | 0.6661 | 0.8035 | 0.7284 |
| Swin transformer | 0.8390 | 0.6523 | 0.7667 | 0.7049 |
| TSTN | 0.9032 | 0.8545 | 0.8734 | 0.8843 |
| TSTN-NOA | 0.9442 | 0.9050 | 0.9203 | 0.9126 |
Table 3: Analysis of proposed model for 60–40% of data.
| Model | Accuracy | Recall | Precision | F-Measure |
|---|---|---|---|---|
| CNN | 0.8604 | 0.6845 | 0.7818 | 0.7299 |
| RNN | 0.8234 | 0.6234 | 0.7323 | 0.6735 |
| LSTM | 0.8280 | 0.7086 | 0.6855 | 0.6969 |
| Swin Transformer | 0.8277 | 0.7992 | 0.7522 | 0.6002 |
| TSTN | 0.8867 | 0.8186 | 0.8090 | 0.8045 |
| TSTN-NOA | 0.9173 | 0.8480 | 0.8530 | 0.8505 |
Table 2 above shows the proposed model’s analysis for 80–20% of the data. In this investigation, we compared the performance using a variety of methodologies. The accuracy calculation for the CNN model was 0.8834, the recall value was 0.8009, the precision value was 0.8175, and lastly, the F-measure value was 0.8091. In another type, the RNN model reached an accuracy calculation of 0.8862, a recall value of 0.7492, a precision value of 0.8657, and finally an F-measure value of 0.8032, respectively. And then another model, the LSTM model, reached an accuracy calculation of 0.8605, a recall value of 0.6661, a precision value of 0.8035, and finally an F-measure value of 0.7284, respectively. The method of the swin transformer model reached an accuracy calculation of 0.8390, a recall value of 0.6523, a precision value of 0.7667, and finally an F-measure value of 0.7049. After the TSTN model reached the accuracy calculation of 0.9032, the recall value of 0.8545, the precision value of 0.8734, and finally the F-measure value of 0.8843. And also, the TSTN-NOA model reached an accuracy calculation of 0.9442, a recall value of 0.9050, another performance precision value of 0.9203, and finally an F-measure value of 0.9126, respectively. Through this comparison analysis, the proposed TSTN-NOA model reaches the better performance results than another compared model.
In the above Table 3, the analysis of the proposed model for 60–40% of the data. In this analysis ratio, the CNN model reaches an accuracy of 0.8604, the recall value is 0.6845; after that, the precision value is 0.7818; and finally, the F-measure value is 0.7299, respectively. And also, another model of RNN model reaches an accuracy of 0.8234 and a recall value of 0.6234, after that; the precision value is 0.7323 and finally, the F-measure value is 0.6735, respectively. And also, another model of the LSTM model reaches an accuracy of 0.8280, the recall value is 0.7086; after that, the precision value is 0.6855, and finally, the F-measure value is 0.6969, respectively. And also, another model of the swin transformer model reaches an accuracy of 0.8277 and a recall value of 0.7992; after that, the precision value of 0.7522, and finally, the F-measure value is 0.6002, respectively. And also, another model of the TSTN model reaches an accuracy of 0.8867, a recall value of 0.8186, a precision value of 0.8090, and finally, an F-measure value of 0.8045, respectively. And also, another model of TSTN-NOA 0.9173, and the recall value of 0.8480, and finally, the F-measure value is 0.8505, respectively. And also in the comparison analysis, the proposed TSTN-NOA model reaches the better performance results than other compared models. The below figures 3 and 6 shows the accuracy, recall, precision and F1-score values of various techniques used for comparison with the proposed method.
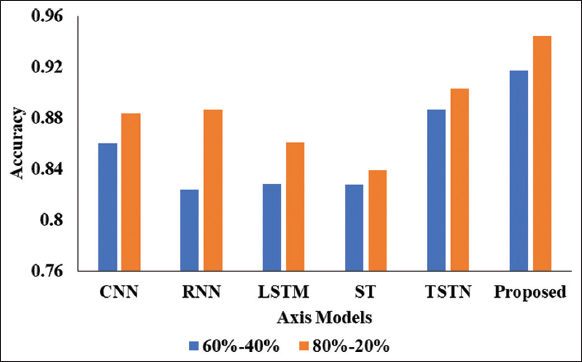 | Figure 3: Graphical representation of proposed model in accuracy. [Click here to view] |
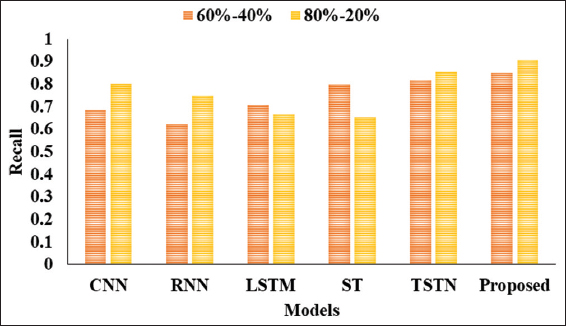 | Figure 4: Recall analysis. [Click here to view] |
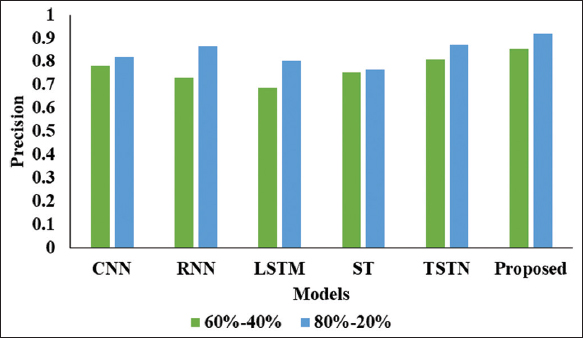 | Figure 5: Comparison of various models in precision validation. [Click here to view] |
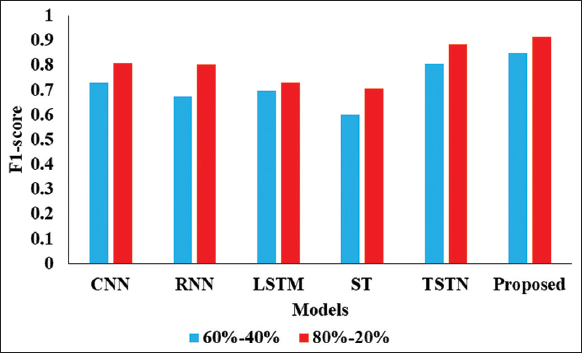 | Figure 6: Validation on F-measure. [Click here to view] |
5. CONCLUSION
This study recommends employing a TSTN to recognize sugarcane yield automatically. The swin transformer is the foundation of the TSTN, using attentional approaches to learn extremely emotive pictures and encode remote relationships. Second, to extract features with more contextual information, an LSTM network is used. The swin transformer and LSTM networks are combined in the TSTN, which is trained end-to-end using non-dominated optimization (NOA) to effectively tune both visual and temporal variables. Data mining methods will make it possible to predict future industrial productions like milk and juice. This method is highly advised for usage in factories since it enables step-by-step process control. This is particularly true when preserving a condition from the previous stage and comparing process variables like Pol, Brix, and Tonne to those of the following phase. It is vital to swiftly assess the data acquired at each stage in order to determine whether or not the work conducted there was appropriate in order to undertake an accurate evaluation of the process. When it comes to the repair stage, the system permits moving on to the next step of the process, but if a flaw is found after implementing that section of the manufacturing line, the system will stop you.
6. ACKNOWLEDGMENT
The authors are thankful to the Plant Pathology Research Institute, Agricultural Research Center, Giza, Egypt, for providing, Serological and Molecular Laboratory, and greenhouse facility.
7. AUTHORS’ CONTRIBUTIONS
All authors contributed to conception and design, data collection, analysis, and interpretation, authoring and editing the article for intellectual content, agreeing to submit to the journal and approving the final version, and agreeing to be accountable for all elements of the work.
8. CONFLICTS OF INTEREST
The authors declare that there are no conflicts of interest regarding the publication of this manuscript.
9. FUNDING
The authors declare that no funds, grants, or other support were received during the preparation of this manuscript.
10. ETHICAL APPROVALS
This study does not involve experiments on animals or human subjects.
11. DATA AVAILABILITY
Data will be provided upon request.
12. PUBLISHER’S NOTE
This journal remains neutral with regard to jurisdictional claims in published institutional affiliation.
REFERENCES
1. Quy VK, van Hau N, van Anh D, Quy NM, Ban NT, Lanza S, et al. IoT-enabled smart agriculture:Architecture, applications, and challenges. Appl Sci 2022;12:3396. [https://doi.org/10.3390/app12073396]
2. Sinha BB, Dhanalakshmi R. Recent advancements and challenges of internet of things in smart agriculture:A survey. Future Gener Comput Syst 2022;126:169-84. [https://doi.org/10.1016/j.future.2021.08.006]
3. Qazi S, Khawaja BA, Farooq QU. IoT-equipped and AI-enabled next generation smart agriculture:A critical review, current challenges and future trends. IEEE Access 2022;10:21219-35. [https://doi.org/10.1109/ACCESS.2022.3152544]
4. Rehman A, Saba T, Kashif M, Fati SM, Bahaj SA, Chaudhry H. A revisit of internet of things technologies for monitoring and control strategies in smart agriculture. Agronomy 2022;12:127. [https://doi.org/10.3390/agronomy12010127]
5. Whig P, Kouser S, Velu A, Nadikattu RR. Fog-IoT-assisted-based smart agriculture application. In:Demystifying Federated Learning for Blockchain and Industrial Internet of Things. Pennsylvania:IGI Global;2022. 74-93. [https://doi.org/10.4018/978-1-6684-3733-9.ch005]
6. Srivastava A, Das DK. A comprehensive review on the application of internet of thing (IoT) in smart agriculture. Wirel Pers Commun 2022;122:1807-37. [https://doi.org/10.1007/s11277-021-08970-7]
7. Siddiquee KN, Islam MS, Singh N, Gunjan VK, Yong WH, Huda MN, et al. Development of algorithms for an Iot-based smart agriculture monitoring system. Wirel Commun Mob Comput 2022;2022:1-16. [https://doi.org/10.1155/2022/7372053]
8. Mohapatra H, Rath AK. IoE based framework for smart agriculture:Networking among all agricultural attributes. J Ambient Intell Humaniz Comput 2022;13:407-24. [https://doi.org/10.1007/s12652-021-02908-4]
9. Junior FM, Bianchi RA, Prati RC, Kolehmainen K, Soininen JP, Kamienski CA. Data reduction based on machine learning algorithms for fog computing in IoT smart agriculture. Biosyst Eng 2022;223:142-58. [https://doi.org/10.1016/j.biosystemseng.2021.12.021]
10. Strong R, Wynn JT, Lindner JR, Palmer K. Evaluating Brazilian agriculturalists'IoT smart agriculture adoption barriers:Understanding stakeholder salience prior to launching an innovation. Sensors (Basel) 2022;22:6833. [https://doi.org/10.3390/s22186833]
11. Gupta A, Nahar P. Classification and yield prediction in smart agriculture system using IoT. J Ambient Intell Humaniz Comput 2022;14:10235-44. [https://doi.org/10.1007/s12652-021-03685-w]
12. Qureshi T, Saeed M, Ahsan K, Malik AA, Muhammad ES, Touheed N. Smart agriculture for sustainable food security using internet of things (IoT). Wirel Commun Mob Comput 2022;2022:9608394. [https://doi.org/10.1155/2022/9608394]
13. Gupta B, Madan G, Md AQ. A smart agriculture framework for IoT based plant decay detection using smart croft algorithm. Mater Today Proc 2022;62:4758-63. [https://doi.org/10.1016/j.matpr.2022.03.314]
14. Wicaksono MG, Suryani E, Hendrawan RA. Increasing productivity of rice plants based on IoT (internet of things) to realize smart agriculture using system thinking approach. Procedia Comput Sci 2022;197:607-16. [https://doi.org/10.1016/j.procs.2021.12.179]
15. Atheeswaran A, Raghavender KV, Chaganti BL, Maram A, Herencsar N. Expert system for smart farming for diagnosis of sugarcane diseases using machine learning. Comput Electr Eng 2023;109:108739. [https://doi.org/10.1016/j.compeleceng.2023.108739]
16. Ribeiro JB, da Silva RR, Dias JD, Escarpinati MC, Backes AR. Automated detection of sugarcane crop lines from UAV images using deep learning. Inf Process Agric 2023. [https://doi.org/10.1016/j.inpa.2023.04.001]
17. Senapaty MK, Ray A, Padhy N. IoT-enabled soil nutrient analysis and crop recommendation model for precision agriculture. Computers 2023;12:61. [https://doi.org/10.3390/computers12030061]
18. Selvakumar V, Seetharaman K. HOML-SL:IoT based early disease detection and prediction for sugarcane leaf using hybrid optimal machine learning technique. J Surv Fish Sci 2023;10:3284-309.
19. Ali A, Hussain T, Tantashutikun N, Hussain N, Cocetta G. Application of smart techniques, internet of things and data mining for resource use efficient and sustainable crop production. Agriculture 2023;13:397. [https://doi.org/10.3390/agriculture13020397]
20. Sharma RP, Dharavath R, Edla DR. IoFT-FIS:Internet of farm things based prediction for crop pest infestation using optimized fuzzy inference system. Internet Things 2023;21:100658. [https://doi.org/10.1016/j.iot.2022.100658]
21. Nihar A, Patel NR, Danodia A. Machine-learning-based regional yield forecasting for sugarcane crop in Uttar Pradesh, India. J Indian Soc Remote Sens 2022;50:1519-30. [https://doi.org/10.1007/s12524-022-01549-0]
22. Abdel-Basset M, Mohamed R, Jameel M, Abouhawwash M. Nutcracker optimizer:A novel nature-inspired metaheuristic algorithm for global optimization and engineering design problems. Knowl Based Syst 2023;262:110248. [https://doi.org/10.1016/j.knosys.2022.110248]
23. Qian J, Feng S, Tao T, Hu Y, Li Y, Chen Q, et al. Deep-learning-enabled geometric constraints and phase unwrapping for single-shot absolute 3D shape measurement. APL Photon 2020;5:046105. [https://doi.org/10.1063/5.0003217]