
ARTICLE HIGHLIGHTS
Some genes show altered expression during all three abiotic stress conditions such as drought, cold and salt. Up-regulated genes are mainly involved in metabolic activities. Down-regulated genes are majorly associated with DNA repair mechanisms.
1. INTRODUCTION
Over one-third of the worldwide people get the majority of their food from rice, which is the most significant food crop in the world. About 8–9% of rice is protein. It is a member of the tribe Oryzeae, family Poaceae (Gramineae), and genus Oryza. Oryza sativa, the Asian rice variety, is farmed all over the world, while Oryza glaberrima, the African variety, is planted on a small scale in West Africa. Rice is a member of the Gramineae grass family, along with wheat, corn, rye, oats, and barley. Rice helps avoid hypertension since it is low in sodium, fat, and cholesterol. It is also frequently used in baby foods and is allergen-free [1].
Rice is one of the most vulnerable crops to drought stress [2] because it directly affects the phenological traits and prolongs the crop duration [3]. Abiotic stresses have an impact on the biochemical and physiological pathways of rice. Many phytohormones, antioxidants, and various plant enzymes get activated in stress response, which on activation produce certain stress-based metabolites to prevent the crops from cellular damage. One of the most detrimental elements that reduce rice crop output are resistance to water deficit and salt stress [4].
Drought has an impact that begins at the seedling stage and lasts until harvest. Responding to these stressors, crop damage has been observed to exceed 50% globally. By interfering with seed germination, blooming, root and shoot length, and grain filling, abiotic factors such as drought, high and low temperatures, salinity, submergence, and oxidative stress contribute considerably to limiting rice output. Cell signaling pathways are activated by abiotic stress. When responding to stressful situations, a number of proteins, antioxidants, and suitable solutes are created. Through the control of gene expression and modifications to cellular functions, plants have evolved stress resistance and responses to reduce the harm caused by abiotic stress [5].
Transcriptomic profiling has become a crucial tool to specify genes and pathways related to abiotic stress responses. DNA microarrays are extensively employed to find out differentially expressed genes (DEGs) in various stress conditions in a variety of crop plants. Several studies have reported numerous abiotic stress-responsive regulators identified through DNA microarrays [6]. Hence, it would be beneficial to find out the genes which exhibit changes in their expression pattern when the plant is exposed to an abiotic stress condition. Such genes would play a crucial role in the stress response system. Thus, in this article, we have made an attempt to apply computational approaches to determine genes that were differentially expressed in rice during multiple abiotic stress conditions. These genes were further investigated in terms of functional annotation, protein–protein interactions (PPI), and pathway analysis. The functional relevance of such genes may provide insights into the molecular basis of stress response mechanisms and this knowledge can be employed in developing stress-tolerant rice varieties.
2. METHODOLOGY
2.1. Retrieval of DEGs
The expression profiles of O. sativa depicting the expression of different genes in abiotic stresses were retrieved from the GEO database (http://www.ncbi. nlm.nih.gov/geo/) [7]. The GEO series unique identification number GSE6901 was considered for differential gene expression analysis of O. sativa subjected to cold, drought, and salt stresses. As per experimental details reported in GEO, 7-day-old light-grown rice (subsp. indica var IR64) seedlings grown under controlled and abiotic stress conditions were used for RNA extraction and hybridization on Affymetrix microarrays [8]. In the first step, the Affymetrix raw data (.cel) from GEO series GSE6901 were retrieved. The collected data were further analyzed by GEO2R which is an online NCBI gene expression tool to compare control and test samples to scrutinize genes that show variations in expression under different experimental conditions. Fold change (FC) values were used to distinguish the DEGs. Genes that were having log (FC) value greater than +1 were considered up-regulated and log (FC) <−1 was considered down-regulated and the resultant genes were filtered through log P-value.
2.2. Clustering Analysis
The selected genes were further considered for obtaining Venn diagrams to find out the commonly expressed genes in all three stress conditions, that is, drought, cold, and salt. Statistical utility for microarray and omics data (SUMO) (https://angiogenesis.dkfz.de/oncoexpress/software/sumo/) tools were applied which represent data as Venn diagrams. SUMO extracts the gene names from the data table and unique gene names are used for set analysis. All keys, that is, Gene IDs from a list were compared with all other IDs in different stress conditions. Then, common keys were assigned to the corresponding intersection lists. This was followed by the hierarchical clustering of selected genes by Genesis 1.8.1 [9].
2.3. Functional Annotation
Functional annotation was performed on the resultant genes using BLAST2GO to obtain insights into their biological functions and contribution in various biological processes (http://www.blast2go.de) [10]. The biological functions of the genes that were involved in the various cellular processes to cope with the plant in stress conditions were analyzed for particular genes. Motifs generated in BLAST2GO were extracted from Interpro web service.
2.4. Pathway Analysis
Resultant genes were investigated to find out their involvement in various metabolic pathways. This was done using Plant Reactome (http://plantreactome.gramene.org), an unrestricted and publicly available software under the Gramene project. It gives insights into bioinformatics tools for the visualization, analysis, and interpretation of metabolic pathways and supports annotated genomic analysis. Plant Reactome shows a diverse range of developmental, metabolic, transport, genetic, and signaling pathways operating in plants.
2.5. Network Analysis
First, protein-protein interactions (PPI) of both up- and down-regulated genes were obtained using the STRING database [11] (http://string-db.org/). Only the high-confidence interactions were considered, based on a confidence score of >0.7. For visualization of molecular networks, Cytoscape was used [12]. It is a publicly available software project that interlaced molecular interaction networks and molecular states into a theoretical configuration. The up- and down-regulated protein-protein interaction networks (PPIN) were further analyzed by the NetworkAnalyzer plugin of Cytoscape.
3. RESULTS
3.1. Box Plot Analysis
The sample IDs GSM159262, GSM159263, and GSM15964 represented gene expression under drought stress, and the control samples were GSM159259, GSM159260, and GSM159261. The sample IDs GSM159268, GSM159269, and GSM159270 represented gene expression under cold stress, whereas the control samples were GSM159259, GSM159260, and GSM159261. The sample IDs GSM159265, GSM159266, and GSM15967 represented gene expression under salt stress, whereas the control samples were GSM159259, GSM159260, and GSM159261. The box plot represents the range of expression values obtained for each sample and the variability of up- and down-regulated genes [Figure 1]. It shows the shape of the distribution of the data as well as its central value (median) and variability (interquartile range) [13]. As the median of all samples lies at the same level, it indicates that the normalization applied to the dataset is appropriate [Figure 1]. Moreover, there are negligible chances of the occurrence of problematic chips.
 | Figure 1: Box plot analysis for all stress conditions (drought, salt, and cold) versus control samples. [Click here to view] |
3.2. Filtering of Genes
The DEGs were identified with the help of log (FC) values. Genes with log (FC) values >1 were considered up regulated, and those with <−1 were considered down regulated. The up- and down-regulated genes were selected for three stress conditions: drought, cold, and stress [Table 1]. A maximum number of DEGs were found in drought conditions, followed by salt and cold. Across all stress conditions, there are fewer down-regulated genes than up-regulated genes.
Table 1: Number of differentially expressed genes during different stress conditions.
| Stress | No. of up-regulated genes | No. of down-regulated genes | Total |
|---|---|---|---|
| Drought | 3870 | 3852 | 7722 |
| Cold | 1042 | 663 | 1705 |
| Salt | 1902 | 1138 | 3040 |
3.3. Common Genes of Drought, Cold, and Salt Stress
According to specific patterns of regulation, the stress-inducible genes that had been screened have been divided into different groups. The venn analysis was used to identify genes that were shared by each of the three stress conditions. Based on overlapped venn diagram sections, the genes having common expression profiles under drought, cold, and salinity-stressing circumstances were examined. Whereas 58 genes from down-regulated genes were found to be expressed in all stress circumstances, 222 genes from up-regulated genes have been highly expressed throughout all three stress conditions (drought, cold, and salt). Such commonly DEGs were considered significant. The common genes that are up-regulated [Figure 2a] or down-regulated [Figure 2b] for all three stress scenarios are represented in the venn diagrams.
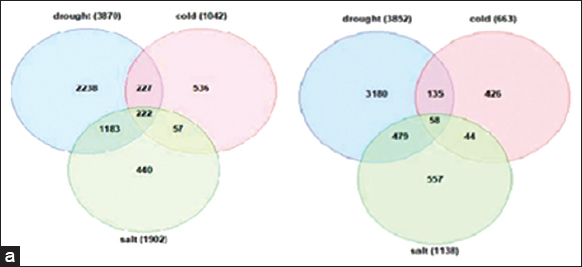 | Figure 2: (a): Venn diagram showing common genes that are up regulated in drought, salt, and cold conditions: (b): Venn diagram showing common genes that are down regulated in drought, salt, and cold conditions. [Click here to view] |
3.4. Classification of Gene Expression Data
To handle microarray data, Genesis comprises filters, normalization and visualization tools, and distance measures, including common clustering methods such as clustering algorithms, identity maps, k-means, principal component analysis, and support vector machine [14]. The average linkage algorithm was applied to obtain the gene expression values of genes. A heat map of DEGs was analyzed. In the generated heat maps, genes were arranged according to a hierarchical dendrogram [Figure 3]. The heat maps, in which the rows indicate observations from various genes and the columns reflect various samples, are connected with hierarchical clustering. High gene expression is shown by the red region, whereas low gene expression is represented by the green section. The data frames are arranged according to resemblance using hierarchical clustering. As a result, the correlation within the dataset is easy to discern. Hierarchical clustering is widely used in association with such a dendrogram. It denotes similarity as well as the formation of the order of the clusters [15]. The cluster with the shortest branch has the highest degree of similarity, and as branch length increases, the degree of similarity falls. To determine, the distance between genes and their clusters, Euclidean distance is frequently used.
 | Figure 3: Hierarchical heat map tree generated from the genesis tool. [Click here to view] |
3.5. Gene Ontology Classification of DEGs
The significant up- and down-regulated genes were further subjected to functional annotation that was performed using BLAST2GO (now available as an omics box). BLAST2GO looks for comparable sequences using local or remote blast hunts. The program extracts the GO terms associated with each of the obtained hits and provides a GO annotation that has been evaluated for the query sequence. For down-regulated genes, the molecular function “binding” was found to be more prominent [Figure 4]. For down-regulated genes, the most prominent functions were metal ion binding, ATP binding, and DNA binding transcription factor activity [Figure 5]. GO terms for DEGs are summarized in Table 2.
 | Figure 4: Molecular functions for down-regulated genes obtained from Blast2GO. [Click here to view] |
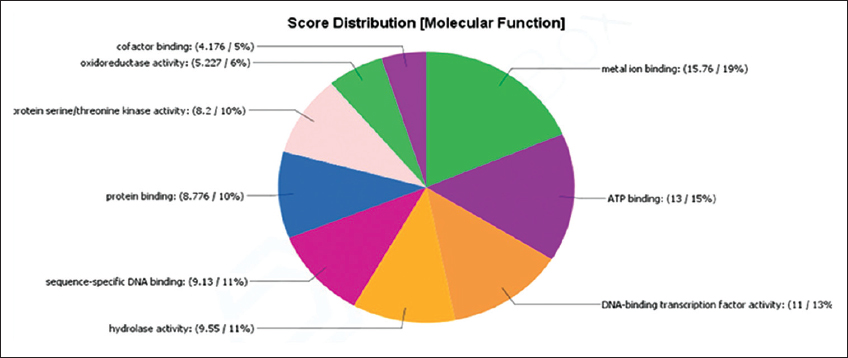 | Figure 5: Molecular function score distribution for up-regulated genes obtained from Blast2GO. [Click here to view] |
Table 2: List of GO terms and corresponding scores for biological function obtained from Blast2GO.
| GO-term | Score |
|---|---|
| Carboxylic acid metabolic process | 2.1599999999999993 |
| Positive regulation of nitrogen compound metabolic process | 0.4367001599999999 |
| Catabolic process | 7.698112 |
| Oxidation-reduction process | 11.7296 |
| Signal transduction | 8.52 |
| Response to organic substance | 4.67712 |
| Cellular response to stress | 4.5120000000000005 |
| Transport | 7.112255999999999 |
| Protein phosphorylation | 12.3936 |
| Regulation of transcription, DNA-template | 19.729599999999998 |
| Positive regulation of macromolecule metabolic process | 1.344384 |
| Response to temperature stimulus | 4.416 |
| Lipid metabolic process | 9.56896 |
| Positive regulation of the cellular metabolic process | 0.7278335999999999 |
| Response to oxygen-containing compound | 5.8511999999999995 |
| Response to acid chemical | 5.9712 |
3.6. PPIN Analysis of Differential Expression Genes
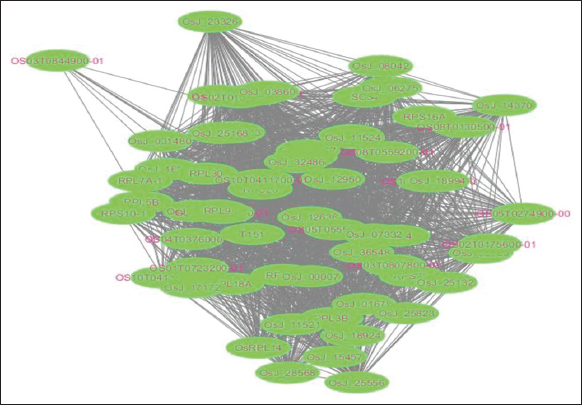
PPI of both up-regulated and down-regulated genes were obtained from STRING. The PPIN was built for both up-regulated and down-regulated PPI data. The following sources are used by STRING to collect experimental data on PPIs: (i) systematic co-expression analysis; (ii) identification of sharable specific signals all over genome sequences; (iii) automated text mining of the research literature; and (iv) computational transfer of interaction understanding among organisms involved in gene orthology [16]. Furthermore, the PPIN was visualized using the Cytoscape tool, which provides a basic set of features for data integration, analysis, and visualization [17]. The network’s nodes represent genes, and its edges refer to interactions [Figures 6 and 7]. Network topology parameters were found using the NetworkAnalyzer plugin of Cytoscape [Table 3]. The most significant genes were sorted based on the value of the degree, which indicates the number of interactions of a node with other nodes in the network. The up-regulated genes with a degree ≥37 and the down-regulated genes with a degree ≥61 were obtained. This was followed by clustering analysis, where the clusters were constructed based on vertex height, identified through the K-core value (core clustering coefficient). The vertices that are weighted by local neighborhood density or the nearest weighted vertex belong to the same cluster. In the cluster, the vertex that has the highest weight is considered the seed node or seed vertex.
 | Figure 6: Protein-protein interactions network for up-regulated genes. [Click here to view] |
 | Figure 7: Protein-protein interactions network for down-regulated genes. [Click here to view] |
Table 3: Topological properties of PPI network.
| Features | Values in up-regulated PPI network | Values in down-regulated PPI network |
|---|---|---|
| No. of nodes | 82 | 62 |
| Clustering coefficient | 0.854 | 0.996 |
| Network diameter | 4 | 2 |
| Network centralization | 0.373 | 0.029 |
| Average no. of neighbors | 16.512 | 59.290 |
| Network density | 0.204 | 0.972 |
| Connected components | 4 | 1 |
PPI: Protein-protein interactions
3.7. Functional Annotation of the Resultant Genes
The functions of the resultant genes were obtained through UniProt [Tables 4 and 5]. For the up-regulated genes, the QsJ_04098 gene id has a molecular function in glycogen phosphorylase activity, linear malto-oligosaccharide phosphorylase activity, pyridoxal phosphate binding, SHG alpha-glucan phosphorylase activity, and a biological function in glycogen catabolic process. Furthermore, the UniProt id QsJ_12328 with degree 46 has a biological function in the galactose catabolic process, glucose metabolic process, and glycogen biosynthetic process, as well as a molecular function in magnesium ion binding and phosphoglucomutase activity.
Table 4: Molecular and biological functions (obtained from UniProt) of up-regulated genes.
| S. No. | Gene ID | Degree | Molecular function | Biological function |
|---|---|---|---|---|
| 1 | OsJ_04098 | 46 | Glycogen phosphorylase activity; Linear malto-oligosaccharide phosphorylase activity; Pyridoxal phosphate binding; SHG alpha-glucan phosphorylase activity | Glycogen catabolic process |
| 2 | OS03T075810 | 46 | Glycogen phosphorylase activity; Linear malto-oligosaccharide phosphorylase activity; Pyridoxal phosphate binding; SHG alpha-glucan phosphorylase activity | Glycogen catabolic process; Response to temperature stimulus; Response to water deprivation |
| 3 | OsJ_30930 | 40 | Magnesium ion binding; Phosphoglucomutase activity | Galactose catabolic process; Glucose metabolic process; Glycogen biosynthetic process |
| 4 | OsJ_12328 | 37 | Magnesium ion binding; Phosphoglucomutase activity | Galactose catabolic process; Glucose metabolic process; Glycogen biosynthetic process |
Table 5: Molecular and biological functions (obtained from UniProt) of down-regulated genes.
| S. No. | Gene id | Degree | Molecular function | Biological function |
|---|---|---|---|---|
| 1 | OsJ_01678 | 61 | Structural constituent of ribosome | Ribosomal large subunit assembly and Translation |
| 2 | OsJ_11524 | 61 | Damaged DNA binding; DNA-(apurinic or apyrimidinic site) endonuclease activity; RNA binding; Structural constituent of ribosome | DNA repair; Translation |
| 3 | RPS15 | 61 | Structural constituent of ribosome | Translation |
| 4 | OS03T080780001 | 61 | RNA binding; Structural constituent of ribosome | Translation |
| 5 | OsJ_25132 | 61 | Structural constituent of ribosome | Cytoplasmic translation; Ribosomal small subunit assembly; Translation |
| 6 | RPL5B | 61 | 5S rRNA binding; RNA binding; Structural constituent of ribosome | Ribosomal large subunit assembly; Translation |
| 7 | OsJ_36548 | 61 | RNA binding; Structural constituent of ribosome | Cytoplasmic translation |
| 8 | OsJ_12636 | 61 | mRNA binding; Structural constituent of ribosome | Negative regulation of translation; Translation |
Down-regulated genes with degree ≥61 were found to be mainly associated with DNA repair mechanisms and biological functions such as damaged DNA binding, DNA-(apurinic or apyrimidinic site) endonuclease activity, RNA binding, and structural constituent of the ribosome. It is interesting to see that translational biological function is common among interacting partners of down-regulated genes. On the other hand, up-regulated genes with degree ≥37 are predominantly involved in metabolic functions such as glycogen phosphorylase activity, linear malto-oligosaccharide phosphorylase activity, pyridoxal phosphate binding, SHG alpha-glucan phosphorylase activity, phosphorylase activity, magnesium ion binding, phosphoglucomutase activity and other biological functions such as galactose catabolic process, response to water deprivation, glucose metabolic process, and glycogen biosynthetic process.
3.8. Pathway Analysis
Using the Plant Reactome database, the DEGs were further analyzed for their role in different metabolic pathways. Up-regulated genes were found to be involved in diverse pathways such as coat protein 2 (COP2) mediated vesicle transport, phenylpropanoid biosynthesis, aluminum stress response, glutamate degradation, abscisic acid (ABA) signaling, and choline biosynthesis. Drought, salinity, and cold conditions have been shown to stimulate the phenylpropanoid biosynthesis pathway, causing an accumulation of different phenols and flavonoids. Phenolics have an impact on a variety of biological procedures involved in plant growth, particularly the germination of seeds, cell division, and the production of pigment used in photosynthetic processes. It has been discovered that, in response to various environmental stimuli, ABA levels rise dramatically in vegetative tissue. Despite having an inhibitory impact on plant growth, a higher ABA level is advantageous for plants during stress. Excess water has been shown to reduce due to ABA-induced stomatal closure under osmotic stress and decreased canopy expansion [18]. ABA has been reported to induce several stress response pathways that are beneficial for the synthesis of suitable osmolytes and late embryogenesis-abundant (LEA)-such as proteins, avoiding plant damage from stress, and increasing plant stress tolerance.
The results indicated that down-regulated genes are involved in the activation of pre-replication complexes, the removal of superoxide, UDP-L-arabinose, and many more processes. Abiotic stress has been shown to increase stomatal closure and encourage the synthesis of hydroxyl radicals through photorespiration [19]. Stress-related overexpression is extremely reactive and harmful to plant proteins, lipids, and nucleic acids.
4. DISCUSSION
4.1. Biological Functions of DEGs
Our research has determined DEGs during abiotic stress through computational analysis. Functional annotation further revealed that these genes are involved in a wide range of activities showing different cellular, molecular, and biological aspects conferring tolerance to drought, salt, and cold conditions. Functional analysis through computational approaches has revealed that the gene encoding beta-amylase was found to be up regulated. Beta-amylase has been reported to be involved in catabolic processes such as the polysaccharide catabolic process, and the amylopectin process [20]. Because maltose production is a single-step reaction, plants with adequate starch levels could produce significant quantities in the stroma in a very short time to contribute to the protection of chloroplast membranes and proteins [20]. Such a short-term protective advantage would give plants more time to produce the full complement of proteins and metabolites relevant to long-term distress, which demands considerable alteration as well as restructuring of metabolism and physiology [21]. This further explains the greater expression of metabolizing enzymes, such as beta-amylase observed during stress conditions.
The cytochrome P450 (CYP) gene also showed higher expression during stress. It is involved in the oxidation-reduction process and helps the rice plants combat environmental stress [22]. CYPs seem to be the biggest family of enzymes engaged in plant metabolism, involving hormone production and catabolism as well as the formation of primary and secondary metabolites. They make up around 1% of the protein-coding regions in plants [23]. Through a variety of biosynthetic and detoxifying pathways, the CYP superfamily contributes significantly toward the growth and development of plants as well as their defense against stressors [24]. Our study has found that the gene dwarf and small seed 1 (DSS1), a gene belonging to the CYP450 gene family, was up regulated. DSS1 gene has been reported to be involved in the regulation of rice plant height [23]. Cytochromes are crucial in controlling the growth and development of plants. Rice stem elongation can be controlled by fine-tuning the gibberellic acid (GA) to ABA balance, which is significant. Rice DSS1 also plays a function in lipid metabolism. The DSS1 mutant has been shown to exhibit increased drought tolerance, delayed germination, and early development as a result of ABA and metabolite buildup, as well as decreased GA levels. As a negative regulator of seed germination and seedling growth, while encouraging tolerance to abiotic conditions such as drought and salt, ABA plays important functions in maintaining seed dormancy and regulating a variety of processes of plant development and responses to environmental challenges [25]. The DSS1 mutant’s delayed germination and early development as well as its increased tolerance to drought are caused by the accumulation of ABA and metabolites by cytochrome. Thus, our findings support the role of the DSS1 gene in combating stress conditions.
In our research, we discovered that the Cyclin-dependent protein kinase gene, AK120479.1, was up regulated during stress. Cyclin-dependent protein kinases have earlier been suggested to help O. sativa to withstand heat stress [26]. Protein kinases are part of signaling pathway cascades. Wheat sucrose non-fermenting 1 (SNF1)-related kinase (SnRK)2 family members have been linked to the control of increased abiotic stress tolerance and development under both normal and stressful circumstances [27]. Previous research has demonstrated that ABA-dependent and ABA-independent signaling pathways stimulate Ca+2-dependent protein kinases (CDPKs) and SnRKs, which in turn affect the expression of LEA genes and other stress-responsive genes [28].
Functional annotation has further revealed another gene AK068392.1 that encodes the NAC domain-containing transcription factors were up regulated during stress. The NAC domain contains a highly conserved N-terminal NAC domain, accompanied by diverse C-terminal domains. NAC is an acronym derived from the names of the three genes first described as containing the domain, namely no apical meristem, ATAF1, 2, and cup-shaped cotyledon [29,30]. NAC family transcription factors are mainly involved in plant growth, development, and biotic or abiotic stress responses. Numerous rice NAC transcription factor genes have been reported to be activated by abiotic stresses [31]. Both throughout the vegetative and blooming phases, rice’s tolerance to drought may be significantly increased by stress-related NAC (SNAC1) [32]. OsNAC529 and OsNAC630 proteins can bind to the OsLEA3 promoter and notably boost resistance to excessive salt and drought. Under dry conditions, OsNAC10 overexpression has been shown to boost rice production. Rice gene OsNAC063 transgenic Arabidopsis plants have been reported to improve high salt and drought tolerance. OsLEA3 and stress-activated protein kinases (OsSAPK1) are directly regulated by OsNAC2, giving it a novel role and regulatory mechanism in abiotic stress responses [31]. Therefore, it could be crucial in establishing a link between the ABA and abiotic stress response pathways.
In our work, we discovered that several genes encoding mitogen-activated protein kinase (MAPKs) were up regulated in O. sativa under stress. MAPKs are involved in protein-mediated signal transduction, mitotic cell cycle control, and ATP binding and enable rice plants to resist stress [33]. Being a vital component, MAP kinase plays a crucial role in integrating upstream signals with mitogen-activated proteins for subsequent cellular responses. Cross talks between MAP kinases occur during the signaling pathway. Dual specificity kinases phosphorylate threonine and tyrosine residues found in the activation loops to activate MAPKs. In mammals and yeast, MAPK cascades function in generally conserved signaling modules. Numerous studies have reported that MAPKs become active when plants are subjected to various abiotic and biotic stresses [34].
Another gene AK060284.1 encoding diacylglycerol kinase (DGK) was found to be up regulated under stress. DGK is one of the most important enzymes that phosphorylates diacylglycerol (DAG) to form phosphatidic acid (PA). In both animal and plant cells, the synthesis of PA through phospholipase D and the linked phospholipase C/DGK pathway is a crucial signaling step [35]. Second messengers DAG and PA are both essential for the production of the main phospholipids. When exposed to diverse stimuli, such as cold, injury, elicitors, and pathogen assault, PA builds up its response. DAG has been implicated in causing ion pumping in guard-cell protoplasts and the opening of intact stomata [36]. In plants, DGK activity has been characterized and is primarily localized to the plasma membrane, with some activity associated with the cytoskeleton and nucleus disease resistance responses.
Our study also revealed that a gene AK062487.1 encoding myeloblastosis (MYB) transcription factor (Myb proto-oncogene protein is a member of the MYB family of transcription factors) was down regulated in the rice plant during abiotic stress. It has been reported that a number of MYB transcription factors control plant survival in response to salt and drought stress. The expression of MYB transcription factors have been shown to be induced by ABA [37]. Earlier studies have demonstrated that the Arabidopsis R2R3-MYB transcription factor promotes lateral root development through the ABA-auxin signaling network and helps the plant to combat drought [38,39].
Another gene AK058429.1 encoding for GDSL-type esterase/lipase proteins (GELPs) was down regulated during all three abiotic stress conditions. This is in line with the previous findings from a Genome-wide study that aimed at identifying and describing the functions of several genes from the GELPs family in Soybeans. These have been reported to play crucial roles in growth and development, stress responses, and pathogen defense in Soybeans [40]. Another gene (AK108868.1) encoding ribosomal protein was found to be down regulated under all stress conditions. This is in agreement with the findings of a previous study that demonstrated reduced expression of 60S ribosomal protein in rice upon exposure to abiotic stress conditions. This study has also reported that transcription regulation involved the removal of transcription factors from the specific sites [41].
Our study has also revealed that gene AY525368.1 encoding Protein lesion simulating disease 1 (LSD1) shows decreased expression during stress conditions. LSD1, a zinc finger protein, has been reported to regulate programmed cell death (PCD) in Arabidopsis thaliana [42]. The LSD1 gene has also been isolated from O. sativa, where it acts as a negative regulator of PCD [43]. PCD is a crucial component of defense mechanisms in response to abiotic stimuli such as ultraviolet radiation, heat, cold, drought, or floods [44].
Functional analysis has revealed that AK070731.1, that is, AAA-ATPase gene was up regulated during stress. An N-terminal domain, an AAA domain, and a C-terminal domain make up the usual chemical composition of a eukaryotic AAA-ATPase. Twenty-nine members of the AAA protein family have been found in the rice genome, including CDC48 (Os03g0151800) and OsFidgetin-like 1 (OsFIGNL1) [45]. The formation of the male meiosis, microspore, and anther in rice has been significantly influenced by the rice OsFIGNL1 gene, that encodes for a conserved AAA-ATPase domain [46].
4.2. Role of DEGs in Metabolic Pathways
DEGs were found to participate in metabolic pathways such as COP2 mediated vesicle transport, phenylpropanoid biosynthesis, aluminum stress response, glutamate degradation, ABA signaling, and choline biosynthesis. Down-regulated genes are involved in the activation of the pre-replication complex, the removal of superoxide, UDP-L-arabinose, and many more processes.
Pathway analysis revealed that an up regulated gene AY077725.1 encoding Zinc Finger Protein ZAT8 is a key component of the phenylpropanoid pathway, which accumulates phenolic and flavonoid compounds. Numerous studies have reported that phenolic compounds influence the physiological processes of seed germination and photosynthetic pigment formation. In addition, phenolic compounds have antioxidant properties and can scavenge free radicals that cause cell membrane peroxidation, preventing oxidative stress on plant cells [47]. This indicates that up regulation of proteins in the phenylpropanoid pathway potentially enables the rice plants to produce more phenolic compounds to cope with a stressful environment. Flavonoid accumulation has also been shown to detoxicate harmful H2O2 resulting from drought stress [48]. In addition, CYP gene has been reported to lead to flavonoid accumulation in Arabidopsis plants exposed to drought conditions [22]. Thus, in agreement with previous findings, our study also found greater expression of CYP gene in all three stress conditions.
From the pathway analysis, another up-regulated gene (AK063578.1) encoding GL2 expression modulator-like, a protein phosphatase, was found to participate in choline biosynthesis. Several species commonly employ low molecular weight substances, osmolytes, or other suitable solutes as a part of the defense system against environmental challenges. For instance, Glycine betaine (GB), a quaternary amine with a zwitterion nature that is produced by oxidizing choline or methylating glycine, has been linked to increasing resistance to abiotic stress in a variety of organisms [49,50]. Choline acts as a main substrate for the biosynthesis of GB. Choline is first converted into betaine in the presence of choline monooxygenase to begin the synthesis of glycine betaine, which is then produced by the NAD+-dependent enzyme betaine aldehyde dehydrogenase. Osmotic stress has been shown to induce the biosynthesis of GB [51]. Another study has demonstrated that GB reverses the inhibitory effects of salt stress [52]. Thus, our study corroborates the previous findings that suggest a critical role of accumulation of GB in the stress tolerance mechanism.
In our study, a gene AK068266.1 encoding for ribulose-1,5 bisphosphate carboxylase/oxygenase small subunit was found to be down regulated under abiotic stress conditions. Functional annotation has revealed that this protein is involved in photorespiration. High temperatures promote photorespiration, which results in the loss of CO2 and energy in photosynthetic cells. Previous research has demonstrated that when the stomata are closed due to water stress and there is high light intensity, photorespiration is required to waste excess ATP and reduce power from the photosynthesis light reactions, thereby preventing damage to the photosynthetic equipment [53]. This might explain the reduced expression of ribulose-1,5 bisphosphate carboxylase/oxygenase upon exposure to stress.
It was also found that a down-regulated gene AK072914.1 encoding for chloroplast unusual positioning 1 (CHUP1) plays a critical role in the movement and optimal positioning of chloroplasts in plants. Mutant studies on A. thaliana have revealed that CHUP1 enables the chloroplasts to relocate by changing intracellular positions in response to light and optimizing photosynthetic activities [54]. Altered chloroplast movement has been reported to affect photosynthesis and carbohydrate metabolism during low-temperature conditions [55].
Another gene U30477.1 was found to be a key component of cell wall organization. Several studies have shown that heat stress affects the synthesis of cell wall constituents [56-58]. The lignification process has been reported to be impacted by DEGs involved in lignin production, as revealed by the proteomic study [59]. Overall, in drought-stress circumstances, the expression pattern of genes associated with cell walls changes, thereby affecting the cell wall composition.
5. CONCLUSION
Abiotic stresses such as water deprivation, low or high temperature, and salinity are known to affect the gene expression of rice plants. Genes show altered expression levels during various abiotic stress conditions and are known as DEGs. DEGs of rice plants were obtained through computational analysis of microarray data available at the NCBI GEO database. Common genes were filtered out which exhibited differential expression during all three abiotic stress conditions, that is, drought, cold, and salt. Such DEGs were considered significant. Functional annotation of significant DEGs was found to encode for a variety of proteins involved in specific functions such as beta-amylase, CYP, Cyclin-dependent protein kinases, NAC domain-containing protein, AAA-ATPase, MAPKs, AP2 containing the domain and DGKs. PPIN analysis has revealed that PPIs exhibited by down-regulated genes are mainly associated with DNA binding activity, whereas PPIs involving up-regulated genes are mainly involved in metabolic activities. DEGs have a role in diverse biological pathways such as phenylpropanoid pathway, choline biosynthesis, and cell wall organization. Thus, our study has predicted several important genes which may play a critical role in stress tolerance mechanisms, however, these need to be validated through experiments.
6. AUTHOR’S CONTRIBUTIONS
Concept and design by RS; Data acquisition and drafting manuscript by SD, YG, MM, NK, and Y; Data analysis by RS, SD, YG, and MM; Critical revision of manuscript by RS, KS. Final approval of manuscript by all the authors.
7. ACKNOWLEDGMENT
The authors would like to thank the Principal, head of the department, faculty members, and technical staff of the Department of Bioinformatics, Goswami Ganesh Dutta Sanatan Dharma College (GGDSD), Chandigarh for their support.
8. FUNDING
There is no funding to report.
9. CONFLICT OF INTEREST
The authors report no financial or any other conflicts of interest in this work.
10. ETHICAL APPROVALS
This study does not involve experiments on animals or humans.
11. DATA AVAILABILITY
All the data obtained in the study are represented as table or figures.
12. PUBLISHER’S NOTE
This journal remains neutral with regard to jurisdictional claims in published institutional affiliation.
REFERENCES
1. Khush GS. Origin, dispersal, cultivation and variation of rice. Plant Mol Biol 1997;35:25-34.
2. Showler AT. Selected abiotic and biotic environmental stress factors affecting two economically important sugarcane stalk boring pests in the United States. Agronomy 2016;6:10.
3. Shao HB, Chu LY, Jaleel CA, Manivannan P, Panneerselvam R, Shao MA. Understanding water deficit stress-induced changes in the basic metabolism of higher plants-biotechnologically and sustainably improving agriculture and the ecoenvironment in arid regions of the globe. Crit Rev Biotechnol 2009;29:131-51.
4. Cohen SP, Leach JE. Abiotic and biotic stresses induce a core transcriptome response in rice. Sci Rep 2019;9:6273.
5. Wiltgen M, Tilz GP. DNA microarray analysis:Principles and clinical impact. Hematology 2007;12:271-87.
6. Shariatipour N, Heidari B. Investigation of drought and salinity tolerance related genes and their regulatory mechanisms in Arabidopsis (Arabidopsis thaliana). Open Bioinform J 2018;11:12-28.
7. Barrett T, Edgar R. Gene expression omnibus:Microarray data storage, submission, retrieval, and analysis. Methods Enzymol 2006;411:352-69.
8. Jain M, Nijhawan A, Arora R, Agarwal P, Ray S, Sharma P, et al. F-box proteins in rice. Genome-wide analysis, classification, temporal and spatial gene expression during panicle and seed development, and regulation by light and abiotic stress. Plant Physiol 2007;143:1467-83.
9. Sturn A, Quackenbush J, Trajanoski Z. Genesis:Cluster analysis of microarray data. Bioinformatics 2002;18:207-8.
10. Conesa A, Gotz S, García-Gómez JM, Terol J, Talón M, Robles M. Blast2GO:A universal tool for annotation, visualization and analysis in functional genomics research. Bioinformatics 2005;21:3674-6.
11. Begley TJ, Rosenbach AS, Ideker T, Samson LD. Damage recovery pathways in Saccharomyces cerevisiae revealed by genomic phenotyping and interactome mapping. Mol Cancer Res 2002;1:103-12.
12. Su G, Morris JH, Demchak B, Bader GD. Biological network exploration with Cytoscape 3. Curr Protocols Bioinformatics 2014;47:8.13.1-24.
13. Williamson DF, Parker RA, Kendrick JS. The box plot:A simple visual method to interpret data. Ann Intern Med 1989;110:916-21.
14. Oh SJ, Kim YS, Kwon CW, Park HK, Jeong JS, Kim JK. Overexpression of the transcription factor AP37 in rice improves grain yield under drought conditions. Plant Physiol 2009;150:1368-79.
15. Oyelade J, Isewon I, Oladipupo F, Aromolaran O, Uwoghiren E, Ameh F, et al. Clustering algorithms:Their application to gene expression data. Bioinformatics Biol Insights 2016;10:237-53.
16. Szklarczyk D, Franceschini A, Wyder S, Forslund K, Heller D, Huerta-Cepas J, et al. STRING V10:Protein-protein interaction networks, integrated over the tree of life. Nucleic Acids Res 2015;43:D447-52.
17. Shannon P, Markiel A, Ozier O, Baliga NS, Wang JT, Ramage D, et al. Cytoscape:A software environment for integrated models of biomolecular interaction networks. Genome Res 2003;13:2498-504.
18. Ye N, Jia L, Zhang J. ABA signal in rice under stress conditions. Rice (N Y) 2012;5:1.
19. Lawlor DW, Tezara W. Causes of decreased photosynthetic rate and metabolic capacity in water-deficient leaf cells:A critical evaluation of mechanisms and integration of processes. Ann Bot 2009;103:561-79.
20. Kaplan F, Guy CL. Beta-amylase induction and the protective role of maltose during temperature shock. Plant Physiol 2004;135:1674-84.
21. Damaris RN, Lin Z, Yang P, He D. The rice alpha-amylase, conserved regulator of seed maturation and germination. Int J Mol Sci 2019;20:450.
22. Rao MJ, Xu Y, Tang X, Huang Y, Liu J, Deng X, et al. CsCYT75B1, a Citrus CYTOCHROME P450 Gene, is involved in accumulation of antioxidant flavonoids and induces drought tolerance in transgenic Arabidopsis. Antioxidants (Basel) 2020;9:161.
23. Tamiru M, Undan JR, Takagi H, Abe A, Yoshida K, Undan JQ, et al. A cytochrome P450, OsDSS1, is involved in growth and drought stress responses in rice (Oryza sativa L.). Plant Mol Biol 2015;88:85-99.
24. Ohkawa H, Imaishi H, Shiota N, Yamada T, Inui H, Ohkawa Y. Molecular mechanisms of herbicide resistance with special emphasis on cytochrome P450 monooxygenases. Plant Biotechnol 1998;15:173-6.
25. Shu K, Liu XD, Xie Q, He ZH. Two faces of one seed:Hormonal regulation of dormancy and germination. Mol Plant 2016;9:34-45.
26. Kitsios G, Doonan JH. Cyclin dependent protein kinases and stress responses in plants. Plant Signal Behav 2011;6:204-9.
27. Kulik A, Wawer I, Krzywi?ska E, Bucholc M, Dobrowolska G. SnRK2 protein kinases--key regulators of plant response to abiotic stresses. OMICS 2011;15:859-72.
28. Yoshida T, Mogami J, Yamaguchi-Shinozaki K. ABA-dependent and ABA-independent signaling in response to osmotic stress in plants. Curr Opin Plant Biol 2014;21:133-9.
29. Souer E, van Houwelingen A, Kloos D, Mol J, Koes R. The no apical meristem gene of Petunia is required for pattern formation in embryos and flowers and is expressed at meristem and primordia boundaries. Cell 1996;85:159-70.
30. Aida M, Ishida T, Fukaki H, Fujisawa H, Tasaka M. Genes involved in organ separation in Arabidopsis:An analysis of the cup-shaped cotyledon mutant. Plant Cell 1997;9:841-57.
31. Shen J, Lv B, Luo L, He J, Mao C, Xi D, et al. The NAC-type transcription factor OsNAC2 regulates ABA-dependent genes and abiotic stress tolerance in rice. Sci Rep 2017;7:40641.
32. Liu G, Li X, Jin S, Liu X, Zhu L, Nie Y, et al. Overexpression of rice NAC gene SNAC1 improves drought and salt tolerance by enhancing root development and reducing transpiration rate in transgenic cotton. PLoS One 2014;9:e86895.
33. Kumar K, Rao KP, Sharma P, Sinha AK. Differential regulation of rice mitogen activated protein kinase kinase (MKK) by abiotic stress. Plant Physiol Biochem 2008;46:891-7.
34. Majeed Y, Zhu X, Zhang N, Rasheed A, Tahir MM, Si H. Functional analysis of mitogen-activated protein kinases (MAPKs) in potato under biotic and abiotic stress. Mol Breed 2022;42:31.
35. Tan WJ, Yang YC, Zhou Y, Huang LP, Xu L, Chen QF, et al. Diacylglycerol acyltransferase and diacylglycerol kinase modulate triacylglycerol and phosphatidic acid production in the plant response to freezing stress. Plant Physiol 2018;177:1303-18.
36. Ge H, Chen C, Jing W, Zhang Q, Wang H, Wang R, et al. The rice diacylglycerol kinase family:Functional analysis using transient RNA interference. Front Plant Sci 2012;3:60.
37. Shinozaki K, Yamaguchi-Shinozaki K, Urao T, Koizumi M. Nucleotide sequence of a gene from Arabidopsis thaliana encoding a myb homologue. Plant Mol Biol 1992;19:493-9.
38. Seo PJ, Park CM. Auxin homeostasis during lateral root development under drought condition. Plant Signal Behav 2009;4:1002-4.
39. Roy S. Function of MYB domain transcription factors in abiotic stress and epigenetic control of stress response in plant genome. Plant Signal Behav 2006;11:e1117723.
40. Su HG, Zhang XH, Wang TT, Wei WL, Wang YX, Chen J, et al. Genome-wide identification, evolution, and expression of GDSL-type esterase/lipase gene family in soybean. Front Plant Sci 2020;11:726.
41. Mukhopadhyay P, Reddy MK, Singla-Pareek SL, Sopory SK. Transcriptional downregulation of rice rpL32 gene under abiotic stress is associated with removal of transcription factors within the promoter region. PLoS One 2011;6:e28058.
42. Czarnocka W, Van Der Kelen K, Willems P, Szechy?ska-Hebda M, Shahnejat-Bushehri S, Balazadeh S, et al. The dual role of Lesion Simulating Disease 1 as a condition-dependent scaffold protein and transcription regulator. Plant Cell Environ 2017;40:2644-62.
43. Wang L, Pei Z, Tian Y, He C. OsLSD1, a rice zinc finger protein, regulates programmed cell death and callus differentiation. Mol Plant Microbe Interact 2005;18:375-84.
44. Wituszy?ska W, Szechy?ska-Hebda M, Sobczak M, Rusaczonek A, Koz?owska-Makulska A, Wito?D, et al. Lesion simulating disease 1 and enhanced disease susceptibility 1 differentially regulate UV-C-induced photooxidative stress signalling and programmed cell death in Arabidopsis thaliana. Plant Cell Environ 2015;38:315-30.
45. Wang Q, Song C, Li CC. Hexamerization of p97-VCP is promoted by ATP binding to the D1 domain and required for ATPase and biological activities. Biochem Biophys Res Commun 2003;300:253-60.
46. Zhang P, Zhang Y, Sun L, Sinumporn S, Yang Z, Sun B, et al. The rice AAA-ATPase OsFIGNL1 is essential for male meiosis. Front Plant Sci 2017;8:1639.
47. Vogt T. Phenylpropanoid biosynthesis. Mol Plant 2010;3:2-20.
48. Sharma A, Shahzad B, Rehman A, Bhardwaj R, Landi M, Zheng B. Response of phenylpropanoid pathway and the role of polyphenols in plants under abiotic stress. Molecules 2019;24:2452.
49. Su J, Hirji R, Zhang L, He C, Selvaraj G, Wu R, Evaluation of the stress-inducible production of choline oxidase in transgenic rice as a strategy for producing the stress-protectant glycine betaine. J Exp Bot 2006;57:1129-35.
50. Giri J. Glycinebetaine and abiotic stress tolerance in plants. Plant Signal Behav 2011;6:1746-51.
51. Xu Z, Sun M, Jiang X, Sun H, Dang X, Cong H, et al. Glycinebetaine biosynthesis in response to osmotic stress depends on jasmonate signaling in watermelon suspension cells. Front Plant Sci 2018;9:1469.
52. Ohnishi N, Murata N. Glycinebetaine counteracts the inhibitory effects of salt stress on the degradation and synthesis of D1 protein during photoinhibition in Synechococcus sp. PCC 7942. Plant Physiol 2006;141:758-65.
53. Sharkey TD. Photosynthesis Photosynthetic Carbon Dioxide Fixation, Encyclopedia of Biological Chemistry III. 3rd ed. Netherlands:Elsevier;2021. 399-412.
54. Oikawa K, Kasahara M, Kiyosue T, Kagawa T, Suetsugu N, Takahashi F, et al. Chloroplast unusual positioning1 is essential for proper chloroplast positioning. Plant Cell 2003;15:2805-15.
55. Kitashova A, Schneider K, Fürtauer L, Schröder L, Scheibenbogen T, Fürtauer S, et al. Impaired chloroplast positioning affects photosynthetic capacity and regulation of the central carbohydrate metabolism during cold acclimation. Photosynth Res 2021;147:49-60.
56. Lima RB, dos Santos TB, Vieira LG, Ferrarese ML, Ferrarese-Filho O, Donatti L, et al. Heat stress causes alterations in the cell-wall polymers and anatomy of coffee leaves (Coffea arabica L.). Carbohydr Polym 2013;93:135-43.
57. Le Gall H, Philippe F, Domon JM, Gillet F, Pelloux J, Rayon C. Cell wall metabolism in response to abiotic stress. Plants (Basel) 2015;4:112-66.
58. Tenhaken R. Cell wall remodeling under abiotic stress. Front Plant Sci 2015;5:771.
59. Liu W, Zhang J, Jiao C, Yin X, Fei Z, Wu Q, et al. Transcriptome analysis provides insights into the regulation of metabolic processes during postharvest cold storage of loquat (Eriobotrya japonica) fruit. Hortic Res 20196;6:49.